
Fuzzy Inference System in a Local Eigenvector Based Color Image
Smoothing Framework
Khleef Almutairi
1,2 a
, Samuel Morillas
1 b
, and Pedro Latorre-Carmona
3 c
1
Instituto Universitario de Matem
´
atica Pura y Aplicada, Universitat Polit
`
ecnica de Val
`
encia,
Camino de Vera s/n, Valencia, 46022, Spain
2
Mathematics Department, Faculty of Science, Albaha University, Suadi Arabia
3
Departmento de Ingenier
´
ıa Inform
´
atica, Universidad de Burgos, Avda. Cantabria s/n, Burgos, 09006, Spain
Keywords:
Colour Image Smoothing, Fuzzy Inference System, Gaussian Noise, Noise Reduction, Eigenvector Analysis.
Abstract:
Noise filtering in colour images is a complex task since it is essential to distinguish between structural and
noise information in the image. It would therefore be important to simultaneously remove noise while keeping
the original image details. This paper proposes a method based on a fuzzy inference system to eliminate noise
and retrieve original image details. Images are transformed from an RGB space to an eigenvector based space
and this transformation is fed to the fuzzy system. Results confirm the validity of the approach, its superior
performance when compared to the eigenvector based framework it is based on, and its competitive behaviour
when compared to other state-of-the-art methods.
1 INTRODUCTION
Digital image processing and computer vision fields
have experienced sustained and intensive growth due
to the importance digital image processing have had
in the last decade. One of the research scopes that
brought scientist attention is image denoising (filter-
ing), since this research line has played a prominent
role in computer vision. Focus has been given to im-
age denoising to help suppress unwanted noise and
improve the quality of reconstructed (transmitted) im-
ages.
Noise is defined as the random changes appear-
ing in the pixel colour information or image bright-
ness (Hong and Thanh, 2020). A well-known noise
source is the so-called thermal noise, which is caused
by the sensor charge-coupled device (CCD) malfunc-
tion. This type of noise can be modelled as addi-
tive white Gaussian noise, and it can be simulated by
adding a random amount of zero-mean Gaussian dis-
tributed values to those in the image, on a channel-
independent basis (Plataniotis and Venetsanopoulos,
2000).
Many Gaussian noise filtering methods have
a
https://orcid.org/0000-0003-3167-5708
b
https://orcid.org/0000-0001-9262-6139
c
https://orcid.org/0000-0001-6984-5173
shared the same aim of maximizing the smoothing
of homogeneous regions. The structure of the im-
ages should be preserved and avoid mixing the tex-
ture of the image with noise. Finally, the denois-
ing method should not introduce any colour artifacts.
That is, once the denoising process is done, no addi-
tional colours that are different from the image’s orig-
inal colours should appear. (Hong and Thanh, 2020).
The first filtering methods, which appeared more
than twenty years ago, were of linear nature. We
can mention, for instance, the arithmetic mean fil-
ter (AMF) (Plataniotis and Venetsanopoulos, 2000).
Despite its noise-suppressing capability, taking ad-
vantage of its zero-mean property, AMF added un-
wanted blur to the image details and structure. This
drawback, which is inherent to its linear nature,
motivated the development of many non-linear ap-
proaches. Some of them overcame the blur effect that
was added to the edges, by detecting the details and
the structure, in order to smooth them less than the
rest of the image.
A number of non-linear methods use the advan-
tage of the zero-mean property. The well-known
bilateral filter (BF) method (Tomasi and Manduchi,
1998) is one example. Not only using the average may
successfully minimize the noise, but other approaches
can also improve noise suppression. The eigenvector
142
Almutairi, K., Morillas, S. and Latorre-Carmona, P.
Fuzzy Inference System in a Local Eigenvector Based Color Image Smoothing Framework.
DOI: 10.5220/0011966900003497
In Proceedings of the 3rd International Conference on Image Processing and Vision Engineering (IMPROVE 2023), pages 142-149
ISBN: 978-989-758-642-2; ISSN: 2795-4943
Copyright
c
2023 by SCITEPRESS – Science and Technology Publications, Lda. Under CC license (CC BY-NC-ND 4.0)

analysis filter (EIG) (Latorre-Carmona et al., 2020),
for instance, uses the technique of weighted pixel av-
eraging to be used in colour images smoothing prob-
lems based on linear algebra. This approach will be
thoroughly discussed in the next section.
In addition, wavelet theory has been used for im-
age filtering. An example is the collaborative wavelet
filter (CWF), originally proposed in (Dabov et al.,
2007). Another method named the graph method for
simultaneous smoothing and sharpening (GMS
3
) and
its normalized version (NGMS
3
) is based on the anal-
ysis of local graphs structure, obtained at every pixel,
using its neighbour (P
´
erez-Benito et al., 2020). On
the other hand, fuzzy logic has recently contributed
to the design of systems that may be able to smooth
images.
In this study, we use a fuzzy inference system
(FIS) to adapt the filter denoising capability to the
amount that might be needed for each image region.
The image is first transformed from the RGB space to
a local eigenvector space in order to analyse the corre-
lation among the colour image channels, and then to
extract three descriptive statistic features, which are
therefore used as input data for FIS. Extracting the
statistics is also an inherent part of the EIG filtering
process.
Our proposal is different from EIG in some as-
pects. One of them is that EIG uses the so-called
normalized standard deviation to perform smoothing,
whereas FIS uses the local standard deviation of each
EIG channel component as an input value. The mem-
bership functions as well as the set FIS rules, are used
to infer the degree of smoothing in the three image
channels, depending on the channel information.
Hence, if the channel has details that should be
preserved, the system will perform a gentle smooth-
ing in that channel. Otherwise, in the homogeneous
regions where no information needs to be kept intact
in the channel, FIS will smooth with the highest po-
tential intensity. When smoothing has already been
applied, the image is returned to the original RGB
space. Experimental results for FIS are promising
when compared to the method it is based on and with
others consdiered here.
This paper is organized as follows: Section 2 re-
views the EIG filter. Section 3 illustrates the proposed
method. Section 4 shows the experimental results
and compares this method with other state-of-the-art
methods. Section 5 presents the conclusions and fu-
ture work.
2 EIGENVECTOR ANALYSIS
METHOD, REVIEWED
This section highlights the process of Eigenvector
analysis shown in (Latorre-Carmona et al., 2020) that
has been used in this study. Assume F is an RGB
colour image. Let us consider a sliding window of
size N × N where N = 2N + 1 and n = 1,2,.... Each
pixel to be processed is in the centre in the sliding
window, denoted as F
0
, and defined as (F
R
0
,F
G
0
,F
B
0
).
The neighbour pixels are denoted as F
i
, where i =
1,...N
2
− 1. The data matrix, called D of the size
N
2
− 1, is built using the pixel colour channel val-
ues. A proper analysis of this matrix D may allow for
processing the correlation of the colour image chan-
nels and also to preserve the edges of the image under
processing. Based on principal component analysis
(PCA) (Dillon and Goldstein, 1984) and using the in-
formation of the D matrix, we can find the eigenvector
of D
T
D, where T is the matrix transpose. Since D is a
symmetric matrix, it can be reduced to a diagonal ma-
trix L by pre-multiplication and post multiplication by
an orthonormal matrix O. The diagonal elements of
L are called the eigenvalues, and the columns of the
matrix O are called the eigenvector of the D
T
D. A
vector v is called an eigenvector of D
T
D if it satisfies
the condition of the eigenvector of a matrix that can
compress or stretch without affecting the direction.
We may then transform the original data into a
group of uncorrelated data employing the coordinate
axis given by the direction of each one of the inferred
eigenvectors. Thus, if V is an orthonormal matrix of
size 3 × 3 that has the three eigenvectors of D
T
D as
columns, named as V
1
,V
2
, and V
3
, the transformation
process is given by the following equation:
U = DV (1)
where U is the score matrix that has the trans-
formed data, since V is orthonormal. The whole pro-
cess is completely invertible:
UV
T
= D (2)
We can now consider applying any component-
wise method on U, which is a set of uncorrelated vari-
ables U
1
, U
2
, and U
3
, each of them associated with
the eigenvalues V
1
, V
2
, and V
3
. Now, we apply a de-
noising method taking advantage of the information
from the eigenvector analysis stated previously.
Due to the sample variance maximization, we can
associate the new variable U
i
with how many corre-
lated changes in the data they represent. We may have
that σ(U
i
) >> σ(U
j
) and σ(U
i
) >> σ(U
k
) where σ
is the sample standard deviation. In this case, while
the variable U
i
is associated with a correlated colour
Fuzzy Inference System in a Local Eigenvector Based Color Image Smoothing Framework
143

variance, most probably representing edges of the im-
age which means we should smooth this variable gen-
tly. However, in the absence of edges and correlated
information in the images where we expect the vari-
ance of U
i
, U
j
and U
k
to be similar, which means
safely smoothing. In order to smooth each compo-
nent independently, we apply a weighted averaging
operation
ˆ
U
i
0
=
N
2
−1
∑
p=0
W
i
p
U
i
p
N
2
−1
∑
p=0
W
i
p
,i = 1,2,3. (3)
where i is the colour channels and p are the pixel
numbers around the central pixel. Where W
i
p
needs
to be set depending on the desired smoothing. Us-
ing this information and a decreasing function repre-
senting that U
i
p
close to U
i
0
receive high weight, EIG
computes
W
i
p
= exp
−
|U
i
p
−U
i
0
|σ
n
(U
i
)
D
!
, (4)
where D is the filter parameter which is experi-
mentally optimized, and it has been set to be D =
(5/6) × s for the window of the size 3 × 3 where s
is the value of noise standard deviation, and that can
be quite accurately estimated.
In the last stage, the processed data should be re-
turned back to RGB space, and this can be done by
multiplying the data by the matrix V
T
.
EIG exhibits a good performance when preserv-
ing image details while removing unwanted noise. In
the following section, we propose how this smooth-
ing effect can be enhanced using a fuzzy system with
an appropriate setting to take non-normalized stan-
dard deviation as an input of the system to determine
three smoothing coefficients that replace the normal-
ized standard deviations used by EIG the filter.
3 DENOISING COLOUR IMAGES
USING A FUZZY INFERENCE
SYSTEM
Fuzzy logic was introduced by Zadeh (Zadeh, 1965)
with the idea of extending the classical logical frame-
work. This means including flexibility for reason-
ing with uncertain data so that it is closer to human
thinking instead of being restricted to either true or
false statements (Nov
´
ak et al., 2012). Illustrating that,
there are other propositions that have a range of po-
tential responses, such as those that arise when ask-
ing a group of individuals to name a colour. When
this happens, the sampled answers are mapped on a
spectrum, and it appears that the truth can be deduced
based on incomplete or imperfect knowledge. For this
fact, fuzzy logic has been used in diverse research ar-
eas covering almost all disciplines in technology and
science.
In the image processing field, several articles
pointed out that the benefits of using a fuzzy in-
ference were particularly important in two main as-
pects (Qidwai and Chen, 2009): (i) The fuzzy ap-
proach is a powerful tool for representing and pro-
cessing knowledge, and (ii) Vagueness and ambiguity
can be effectively managed using fuzzy approaches.
Some studies, (Schulte et al., 2007a) and (Schulte
et al., 2007b) showed the feasibility to use a fuzzy ap-
proach to minimize the noise in colour images. On the
other hand, (Van De Ville et al., 2003) uses a 2-steps
fuzzy method to remove white additive noise (Gaus-
sian noise). Moreover, (Shen and Barner, 2004) and
(Lukac et al., 2005) showed the advantages of using
fuzzy logic in other particular image filtering opera-
tions.
In this work, we study whether or not the use of
a fuzzy inference system may improve the EIG filter
performance in terms of noise reduction while keep-
ing the details preservation ability.
Any fuzzy inference system usually consists of
three major components: Fuzzyfication, Inference
and Defuzzyfication (Mendel, 1995), as shown in Fig-
ure 1.
In our case, we propose to use the σ(u
i
), σ(u
j
)
values as the crisp inputs for FIS, and compute σ(u
k
)
as described in Section 2. In the fuzzification stage,
the transformation of numerical inputs to linguistic
variables with the help of membership functions is
done. We consider different linguistic variables for
each input, as their ranges are different. Then, they
are ranked so that σ(U
1
) < σ(U
2
) < σ(U
3
). In each
case, we consider low, medium, and high fuzzy sets.
The membership functions that are used in the input
and the output are chosen to be Gaussian membership
functions.
Each function has two parameters (location and
width), which are then multiplied by three linguistic
variables for three different inputs, for a total amount
of 36 parameters. Other functions could be used in-
deed, but we prefer to keep the number of total pa-
rameters as low as possible. Subsection 3.1 explains
the optimization process for this set of parameters.
The next stage is the inference process. Here, the
system applies the set of linguistic rules built with
expert knowledge that implements the expected be-
haviour of the process. The set of rules takes the form
IMPROVE 2023 - 3rd International Conference on Image Processing and Vision Engineering
144
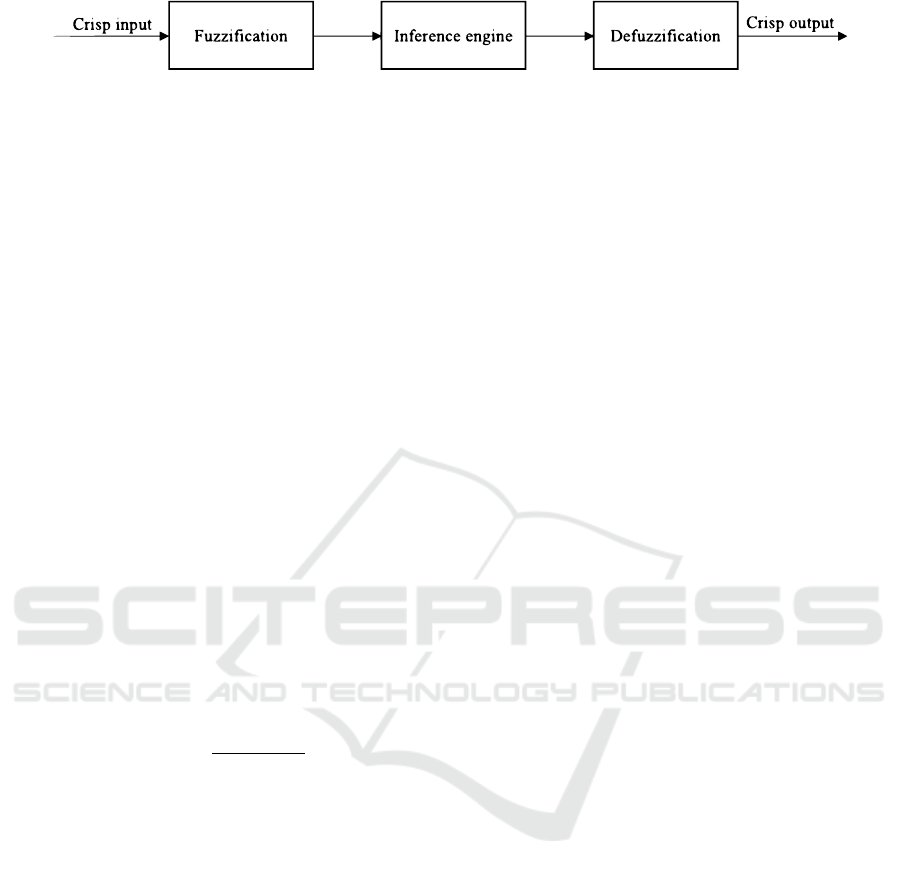
Figure 1: The general structure of any fuzzy inference system.
of IF-THEN implication rules. The inference system
transforms the fuzzy input linguistic certainty values
into fuzzy output linguistic certainty values. The set
of rules that are specified for this system process in-
cludes 3 rules for each input i = 1,2,3, described as
follows:
1. IF σ(u
i
) is low, Then the smoothing coefficient C
i
is low.
2. IF σ(u
i
) is medium, Then the smoothing coeffi-
cient C
i
is medium.
3. IF σ(u
i
) is high, Then the smoothing coefficient
C
i
is high.
Therefore, we have 9 rules overall because we
consider that the linguistic variables are different for
each input because each input takes values in different
ranges, taking into account that: σ(U
1
) < σ(U
2
) <
σ(U
3
).
The Last part is the defuzzification process, where
processing done by the linguistic terms will be de-
fuzzified again to three numerical values called C
1
,
C
2
, and C
3
, through membership functions. Those co-
efficients will be used for smoothing the noisy image,
replacing the normalized standard deviation used in
EIG in Eq. (8), so that:
W
i
p
= exp
−
|U
i
p
−U
i
0
|C
i
D
!
. (5)
3.1 Membership Functions
Optimization
Regardless of the method employed to create the
fuzzy inference system, its numerical accuracy can
be improved by optimizing its parameters. This
goal should be accomplished without compromis-
ing the system’s interpretation (Casillas et al., 2003).
Many strategies allow us to deal with these types of
problems: Genetic algorithms (GA) (Moallem et al.,
2015), for instance, are used effectively to optimize
the fuzzy inference system for both categories; (i) The
structure dealing with the definition and the fuzzy sys-
tem rule (ii) The parameters defining the membership
function in each FIS subset. In this study, we focus
on parameter optimization using a GA approach.
GAs are global stochastic optimization methods.
They are based on structures developed primarily
employing Darwin’s ”survival of the fittest” concept
and natural selection and evolutionary theories. The
aforementioned approach is commonly used as an ef-
fective optimization technique for difficult real-world
optimization issues, such as design and combinatorial
problems (Abualigah and Hanandeh, 2015). When
using GAs to solve a specific problem, a defined num-
ber of people are produced at random for each gener-
ation to form the initial population of people or can-
didate solutions. The variation, selection, and inher-
itance principles are used to build the population of
candidate solutions in question.
GAs can be simplified into the following seven
steps (Moallem et al., 2015):
• Start with an n chromosome population that was
produced randomly.
• Compute the fitness for each chromosome.
• From the original population, choose a set of
parental chromosomes.
• Preform crossover to create two offspring with the
probability of P
cross
.
• The two offspring should be mutated with the
probability of P
mut
.
• Replace the offspring among the population.
• Check for the end or back to point two.
In this paper, GA is used to optimize the mem-
bership functions for the inputs and the outputs of
the fuzzy inference system separately, as each input
and output is taking values in different ranges. In
other words, the low subset for instance, is different
for each input. The fitness function is defined as the
minimization of the mean square error between the
denoised pixel and the original one. The maximum
number of generations is set to be 100. The bound-
aries of the membership functions for the inputs are
0 −200 for the input centre and 5− 100 for the width.
For the output boundaries, the settings are 0 − 1 and
0.01 − 1 for the centre and width of the membership
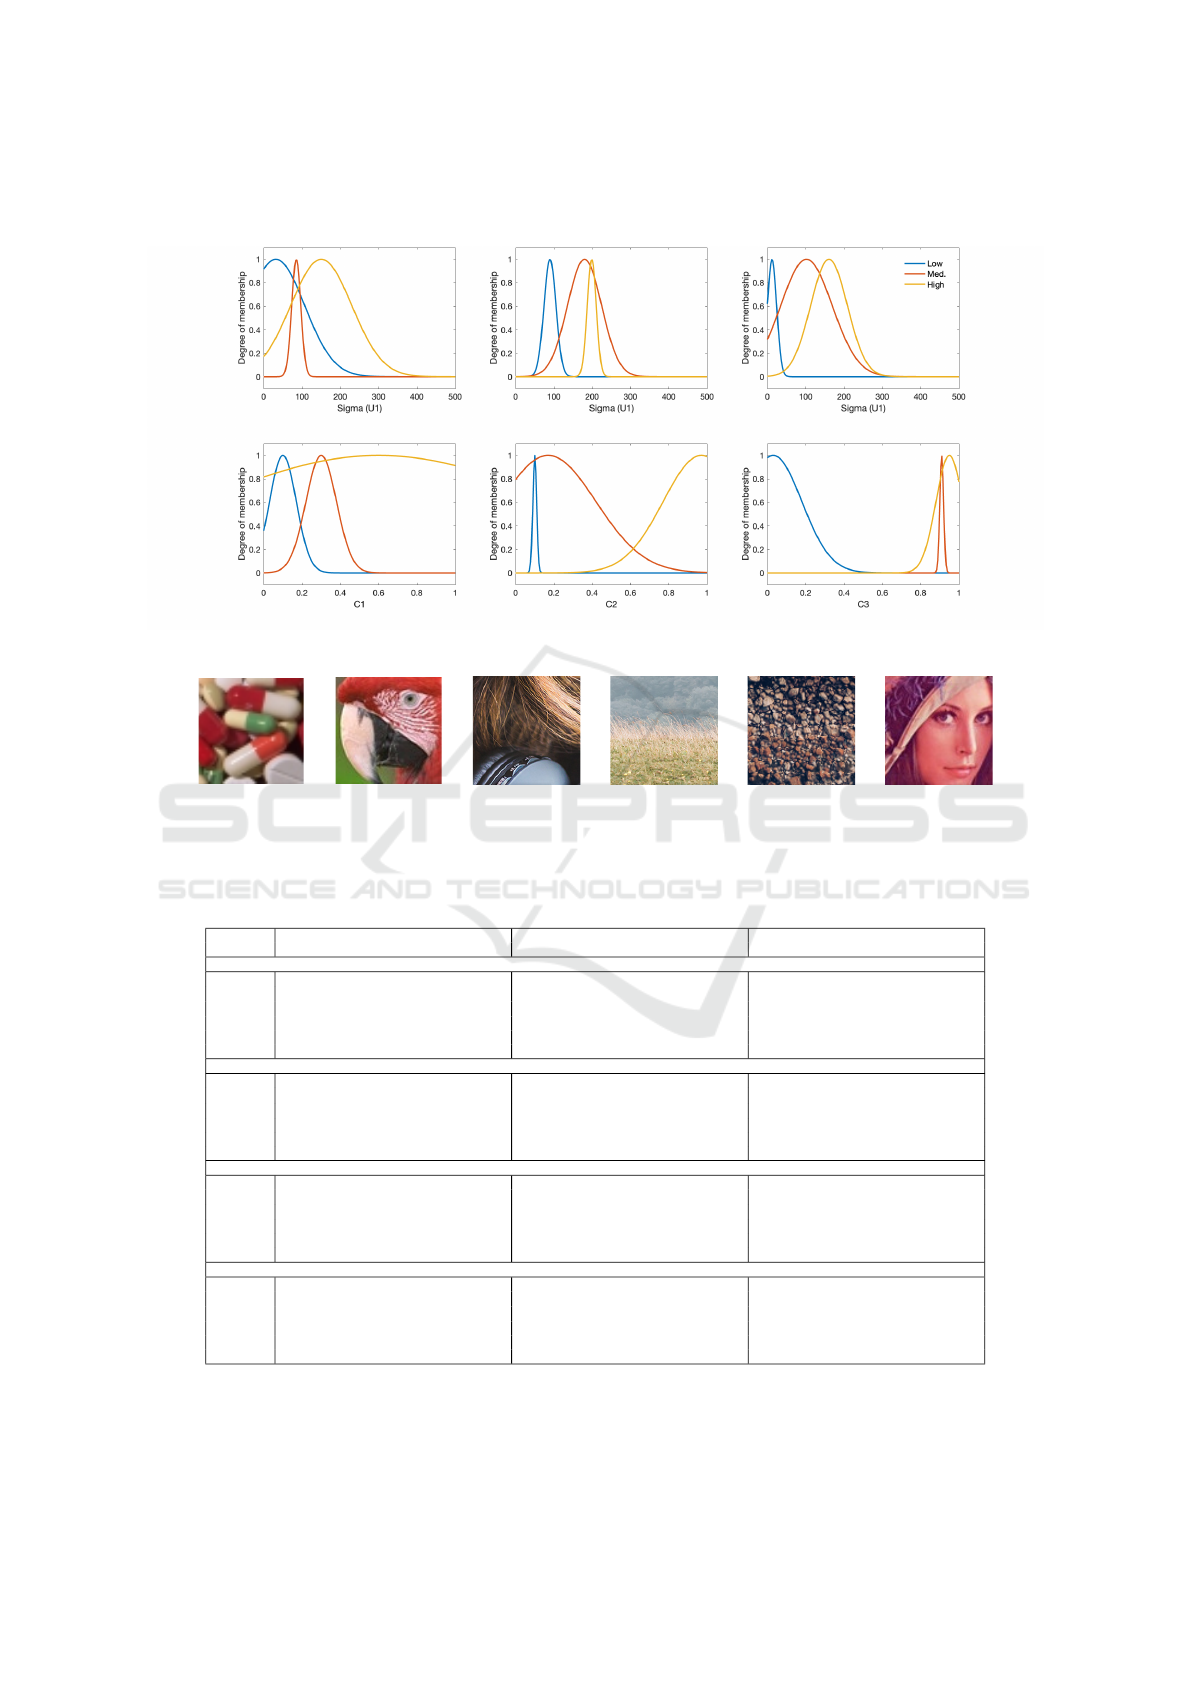
functions, respectively. Figure 2 graphically shows
the FIS membership functions using the optimized pa-
rameters for noise level s = 10. The first row has the
input membership functions, and the second row rep-
resents the corresponding output membership func-
tions.
Table 1 summarizes the result of the optimization
process for each level of Gaussian noise studied and
input and output membership functions, respectively.
To compute this, we have used the image training
Fuzzy Inference System in a Local Eigenvector Based Color Image Smoothing Framework
145

dataset explained in Section 4. By looking at Table
1 we can see that location parameters agree with the
meaning of each linguistic variable. Also, when noise
is increased, we can see that in general, the location
of the membership functions increases in value. This
happens because the higher the noise is, the higher the
standard deviation in all the channels is as well. How-
ever, there are some exceptions to this behaviour that
we need to analyze in more detail. For instance, the
introduction of noise affects more the first input than
the rest. This may be explained because inputs two
and three are related to more correlated data variations
meaning that noise will affect them less. Worth point-
ing out that, by looking at Table 1, we see that loca-
tion of functions is increased by the addition of noise.
This means that output coefficients tend to be higher
in these cases, which means that smoothing will be
higher, which is what it is needed for higher noise.
Therefore, this behaviour is what one would expect it
to happen.
4 EXPERIMENTAL RESULTS
We divided a set of images into training and valida-
tion sets, and performed the optimization and vali-
dation of the fuzzy inference system using the train-
ing images set, which are Pills 50 × 50, Head-phone
100 × 100, and Parrot 80 × 80. We tested the sys-
tem with the optimized parameters, using the vali-
dation set of images formed by Beach 100 × 100,
Lena 90 × 90, and Grass 200 × 200. The train-
ing and validation image sets are shown in Figure
3. Those sets of images have been corrupted with
different Gaussian noise levels. We used five differ-
ent measures, each of which accounts for a different
point of view when evaluating the performance of a
filtering process: (a) The mean absolute error (MAE)
(Plataniotis and Venetsanopoulos, 2000) to estimate
the ability of details preservation; (b) The peak signal
to noise ratio (PSNR) (Plataniotis and Venetsanopou-
los, 2000) for the ability of noise-cancelling; (c) The
normalized colour difference (NCD) (Plataniotis and
Venetsanopoulos, 2000) to measure the colourimetric
preserving; (d) The Fuzzy colour structural similar-
ity (FCSS) (Gre
ˇ
cova and Morillas, 2016); and lastly
(d) The perceptual difference inspired in the image
colour appearance model iCAM (iCAMd) (Fairchild
and Johnson, 2004). We then compared the perfor-
mance of the proposed method with state-of-art meth-
ods, which are: Collaborative Wavelet Filter (CWF)
(Dabov et al., 2007), Eigenvector analysis method
(EIG) (Latorre-Carmona et al., 2020), Graphs based
methods for simultaneous smoothing and sharpening
(GMS
3
), and Normalized graph-method for simulta-
neous smoothing and sharpening (NGMS
3
) (P
´
erez-
Benito et al., 2020). Each filter was applied to a
3× 3 filter window, and the parameter settings recom-
mended by the respective authors were used for each
approach. It is worth pointing out that the sharpen-
ing process in the methods (GMS
3
) and (GMS
3
) has
been ignored for a fair comparison with the proposed
method.
All experimental results of the methods are shown
in Table 2. In this table, the best result is highlighted
in blue, and the second best, in red. Several images
that were denoised using these filters are presented in
the second row of the Figure 4. It can be seen that the
images given by the proposed method give good re-
sults in terms of suppressing the noise, while keeping
the structure and details of the image.
It has therefore been shown that the proposed
method achieves effective noise reduction without
adding colour artifacts, and it does so while main-
taining image features, colours, and structures. In
the larger images with more homogeneous areas, the
proposed method is performing better than the EIG
filter, which was one of its drawbacks. CWF, how-
ever, has the best results in these kinds of images
and this makes sense as the block matching method
used in CWF finds more matches in these types of
images, allowing for better denoising efficiency. In
relation to the high-spatial frequencies content, the
proposed approach performance is more efficient than
CWF which means the latter fails in preserving tex-
ture and small details. Nevertheless, in these cases,
our proposal is not as good as the EIG filter, and
hence we still have some room for future improve-
ment. This potential (future) improvement may come
from changing the system settings (The number of
subsets of membership functions and rules) and also
by increasing the number of images under the test.
Overall, it should be noted that the proposed method
works competitively with different types of images.
5 CONCLUSION AND FUTURE
WORK
In this paper, a fuzzy inference system, on top of an
eigenvector-based image denoising strategy, was ap-
plied in order to filter Gaussian noise in colour im-
ages. The complete system infers, on a pixel-by-pixel
basis, the amount of noise that should be smoothed.
This method performs competitively in terms of both
noise reduction image structure and details preserva-
tion, without the introduction of artifacts in the im-
age. However, in order to increase the efficiency of
IMPROVE 2023 - 3rd International Conference on Image Processing and Vision Engineering
146

Table 1: Optimized parameters of the membership functions of the input and the output of the fuzzy inference system.
Optimized parameters for the inputs
SD First input \output Second input \output Third input \output
MF Low Med. High Low Med. High Low Med. High
Params. Loc. Wid. Loc. Wid. Loc. Wid. Loc. Wid. Loc. Wid. Loc. Wid. Loc. Wid. Loc. Wid. Loc. Wid.
Noise 10 31.54 75.30 84.91 11.86 150.12 79.90 89.80 15.68 179.98 44.58 198.85 11.72 11.85 12.13 101.80 67.30 160.67 48.00
Noise 20 49.47 15.55 113.18 25.97 191.86 15.38 69.58 5.79 149.80 98.76 150.58 12.99 60.85 73.64 117.51 35.60 195.31 36.54
Noise 30 68.89 91.65 136.88 14.38 154.47 18.10 11.96 67.85 153.51 25.49 168.22 11.97 53.66 92.86 100.82 32.59 196.52 63.81
Optimized parameters for the output
Noise 10 0.10 0.07 0.30 0.08 0.60 0.94 0.10 0.01 0.17 0.25 0.97 0.20 0.03 0.15 0.91 0.01 0.95 0.07
Noise 20 0.03 0.06 0.26 0.57 0.33 0.69 0.02 0.02 0.03 0.14 0.46 0.04 0.23 0.07 0.95 0.33 0.97 0.43
Noise 30 0.06 0.03 0.16 0.94 0.92 0.77 0.06 0.01 0.06 0.47 0.67 0.41 0.30 0.08 0.87 0.18 0.91 0.26
the method and to generalize it for any level of noise
we need to find out a way to adjust one set of param-
eters to be valid for every case in the colour images.
This filtering method could be improved by train-
ing the system from data extracted from the images
themselves.
ACKNOWLEDGEMENTS
S. Morillas acknowledges the support of the research
project PID2019-107790RB-C22, funded by MCIN/
AEI/10.13039/501100011033/
REFERENCES
Abualigah, L. M. Q. and Hanandeh, E. S. (2015). Applying
genetic algorithms to information retrieval using vec-
tor space model. International Journal of Computer
Science, Engineering and Applications (IJCSEA) Vol,
5.
Casillas, J., Cord
´
on, O., Herrera, F., and Magdalena, L.
(2003). Interpretability improvements to find the bal-
ance interpretability-accuracy in fuzzy modeling: an
overview. Interpretability issues in fuzzy modeling,
pages 3–22.
Dabov, K., Foi, A., Katkovnik, V., and Egiazarian, K.
(2007). Color image denoising via sparse 3d collabo-
rative filtering with grouping constraint in luminance-
chrominance space. In 2007 IEEE International Con-
ference on Image Processing, volume 1, pages I–313.
IEEE.
Dillon, W. R. and Goldstein, M. (1984). Multivariate anal-
ysis: Methods and applications. New York (NY): Wi-
ley, 1984.
Fairchild, M. D. and Johnson, G. M. (2004). icam frame-
work for image appearance, differences, and quality.
Journal of Electronic Imaging, 13(1):126–138.
Gre
ˇ
cova, S. and Morillas, S. (2016). Perceptual similarity
between color images using fuzzy metrics. Journal
of Visual Communication and Image Representation,
34:230–235.
Hong, N. M. and Thanh, N. C. (2020). Distance-based mean
filter for image denoising. In Proceedings of the 4th
International Conference on Machine Learning and
Soft Computing.
Latorre-Carmona, P., Mi
˜
nana, J.-J., and Morillas, S. (2020).
Colour image denoising by eigenvector analysis of
neighbourhood colour samples. Signal, Image and
Video Processing, 14(3):483–490.
Lukac, R., Plataniotis, K. N., Smolka, B., and Venet-
sanopoulos, A. N. (2005). cdna microarray image pro-
cessing using fuzzy vector filtering framework. Fuzzy
Sets and Systems, 152(1):17–35.
Mendel, J. M. (1995). Fuzzy logic systems for engineering:
a tutorial. Proceedings of the IEEE, 83(3):345–377.
Moallem, P., Mousavi, B., and Naghibzadeh, S. S. (2015).
Fuzzy inference system optimized by genetic algo-
rithm for robust face and pose detection. Int. J. Artif.
Intell, 13(2):73–88.
Nov
´
ak, V., Perfilieva, I., and Mockor, J. (2012). Mathemat-
ical principles of fuzzy logic, volume 517. Springer
Science & Business Media.
P
´
erez-Benito, C., Jord
´
an, C., Conejero, J. A., and Morillas,
S. (2020). Graphs based methods for simultaneous
smoothing and sharpening. MethodsX, 7:100819.
Plataniotis, K. N. and Venetsanopoulos, A. N. (2000).
Companion image processing software. In Color
Image Processing and Applications, pages 349–352.
Springer.
Qidwai, U. and Chen, C.-h. (2009). Digital image process-
ing: an algorithmic approach with MATLAB. Chap-
man and Hall/CRC.
Schulte, S., De Witte, V., and Kerre, E. E. (2007a). A fuzzy
noise reduction method for color images. IEEE Trans-
actions on image Processing, 16(5):1425–1436.
Schulte, S., Witte, V. D., Nachtegael, M., M
´
elange, T., and
Kerre, E. E. (2007b). A new fuzzy additive noise re-
duction method. In International Conference Image
Analysis and Recognition, pages 12–23. Springer.
Shen, Y. and Barner, K. E. (2004). Fuzzy vector median-
based surface smoothing. IEEE Transactions on Visu-
alization and Computer Graphics, 10(3):252–265.
Tomasi, C. and Manduchi, R. (1998). Bilateral filtering for
gray and color images. In Sixth international confer-
ence on computer vision (IEEE Cat. No. 98CH36271),
pages 839–846. IEEE.
Van De Ville, D., Nachtegael, M., Van der Weken, D.,
Kerre, E. E., Philips, W., and Lemahieu, I. (2003).
Noise reduction by fuzzy image filtering. IEEE trans-
actions on fuzzy systems, 11(4):429–436.
Zadeh, L. A. (1965). Fuzzy sets. Information and control,
8(3):338–353.
Fuzzy Inference System in a Local Eigenvector Based Color Image Smoothing Framework
147
APPENDIX
Figure 2: Membership functions that are optimized to use for images with noise level 10 of the fuzzy inference system: The
first row represents the input subsets and the second row shows the output subsets.
Pills 50 × 50 Parrot 80 × 80 Headphone 100 × 100 Grass 200 × 200 Beach 100 × 100 Lenna 90 × 90
Figure 3: The first three images are the training images set, and the last three images are the validation images set.
Table 2: Performance for each one of the methods, in terms of MAE, PSNR, NCD (×10
2
), FCSS (×10) and iCAMd using
different images with different sizes contaminated with various standard deviation s of Gaussian noise. In the table, the best
result for each noise level and performance measure is highlighted in blue, the second best is highlighted in red.
Filter s = 10 s = 20 s = 30
MAE PSNR NCD FCSS iCAMd MAE PSNR NCD FCSS iCAMd MAE PSNR NCD FCSS iCAMd
The results of Grass image (200 × 200)
None 7.82 28.22 5.37 9.38 3.38 15.56 22.24 10.75 8.69 6.71 23.23 18.79 16.16 7.97 10.04
GMS
3
5.23 31.16 2.91 9.51 2.72 8.94 26.71 5.65 9.19 4.93 14.68 22.53 9.85 8.70 7.70
NGMS
3
5.52 30.59 2.88 9.48 2.80 8.11 27.35 4.66 9.18 4.72 10.92 24.96 6.86 8.98 6.70
CWF 3.82 33.90 1.82 9.63 1.91 5.80 30.08 2.48 9.38 2.93 7.35 27.92 2.97 9.14 3.76
EIG 4.82 32.24 2.80 9.58 2.56 8.64 27.20 5.33 9.27 4.82 12.21 24.22 7.85 8.98 7.02
Proposed 4.76 32.19 2.58 9.51 2.58 7.76 28.11 4.56 9.30 4.57 11.71 24.55 7.37 9.01 6.85
The results of Beach image (200 × 200)
None 7.59 28.39 15.22 9.42 4.78 14.91 22.52 29.16 8.93 8.92 21.82 19.20 41.55 8.51 12.79
GMS
3
7.23 28.73 10.26 9.19 4.96 11.31 24.81 17.63 8.94 7.96 16.45 21.53 26.50 8.68 11.15
NGMS
3
9.17 26.55 11.23 8.98 5.89 12.47 23.88 16.39 8.68 8.61 15.53 21.94 21.38 8.48 10.98
CWF 5.62 31.01 8.26 9.49 4.01 9.64 26.30 12.35 9.14 6.67 12.99 23.66 15.67 8.83 8.91
EIG 5.61 30.97 8.94 9.47 4.14 10.03 25.92 15.08 9.08 7.29 14.05 23.00 20.55 8.76 10.09
Proposed 5.69 30.85 8.94 9.44 4.14 9.99 25.96 14.34 9.01 7.30 13.78 23.16 19.61 8.76 9.94
The results of Beach image (100 × 100)
None 3.88 34.35 6.88 9.68 3.33 7.61 28.51 13.12 9.42 6.31 11.22 25.13 18.90 9.17 8.91
GMS
3
6.51 29.62 6.70 9.16 4.60 7.87 28.08 9.27 9.07 5.89 9.70 26.32 12.41 8.95 7.41
NGM
3
10.94 24.86 9.52 8.68 6.72 11.90 24.27 11.30 8.61 7.58 13.21 23.47 13.44 8.49 8.81
CWF 4.23 33.40 6.29 9.66 3.52 8.40 27.25 10.75 9.30 6.37 12.74 23.61 14.59 8.79 9.10
EIG 3.69 34.60 4.94 9.65 3.02 6.33 30.00 8.06 9.34 5.01 9.04 26.90 11.11 9.02 6.83
Proposed 3.80 34.27 4.99 9.63 2.96 7.50 28.42 8.73 9.14 5.54 9.78 26.19 11.45 8.89 7.16
The results of Lenns image (90 × 90)
None 7.64 28.33 9.11 9.34 5.19 14.88 22.54 17.49 8.63 10.25 21.85 19.17 25.75 7.95 15.39
GMS
3
4.87 31.62 4.95 9.49 3.31 8.53 26.99 9.18 9.20 6.24 13.72 22.89 15.25 8.68 10.26
NGMS
3
5.08 31.16 4.90 9.45 3.31 7.71 27.62 7.74 9.22 5.47 10.45 25.07 11.01 8.98 8.01
CWF 3.38 35.23 3.01 9.64 2.17 5.07 31.51 4.25 9.47 3.19 6.87 28.91 5.91 9.30 4.24
EIG 4.56 32.64 4.67 9.56 3.20 8.17 27.57 8.48 9.24 5.96 11.40 24.63 12.14 8.95 8.72
Proposed 4.28 33.10 4.29 9.56 2.95 7.29 28.55 7.38 9.31 5.32 10.85 25.04 11.38 9.00 8.30
IMPROVE 2023 - 3rd International Conference on Image Processing and Vision Engineering
148
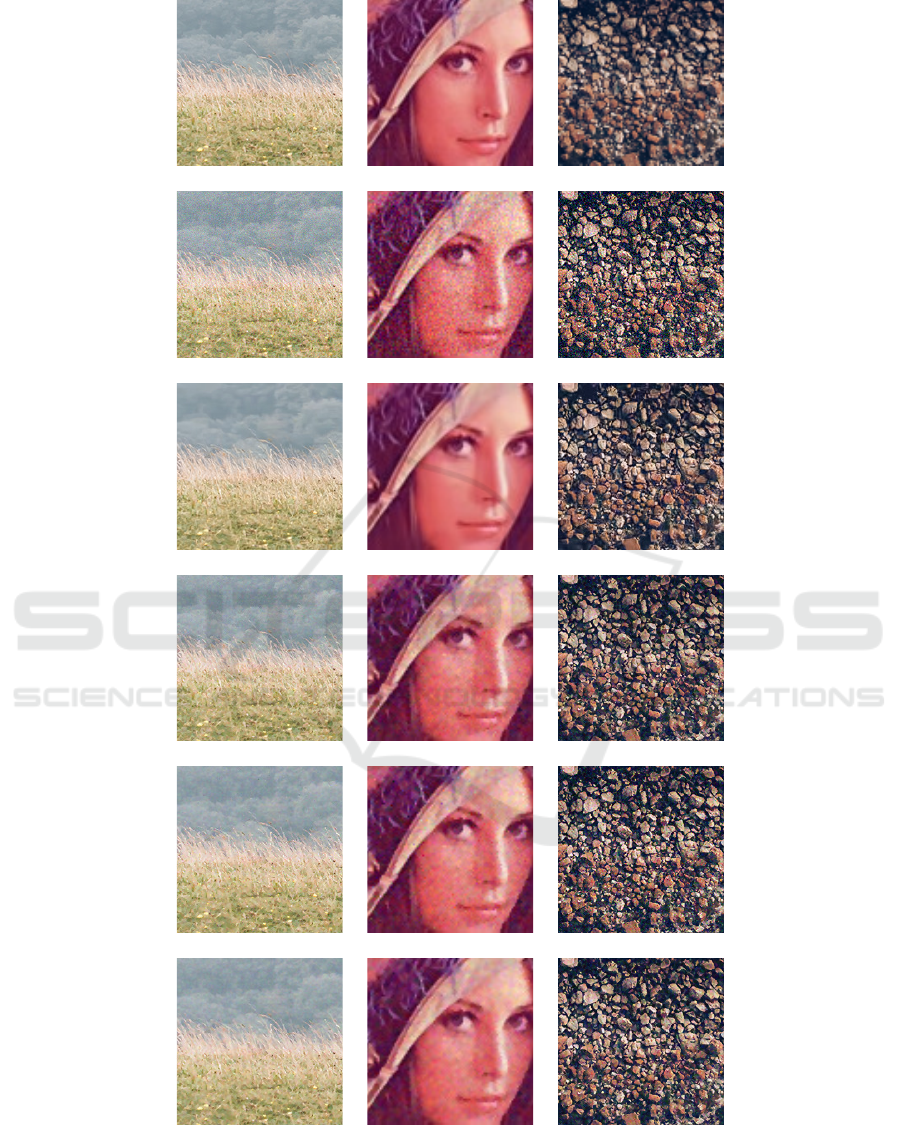
Figure 4: Filtering methods output for visual comparison. The first column contains the Grass images in size (200 x 200)
with noise level s = 10. The second column contains the images of Lenna in size (90 x 90) with noise level s = 20. The last
column contains the images of the Beach in size of (200 x 200) with noise level s = 30. The first row has the original images.
The second row has noisy images with different levels of noise. The third row is the output images from the CWF filter. The
fourth row has the output images from the EIG method. The fifth row has the output images from the GMS
3
filter. The last
row has the output images from the proposed method.
Fuzzy Inference System in a Local Eigenvector Based Color Image Smoothing Framework
149
