
Multi-Modal Artificial Intelligence in Additive Manufacturing:
Combining Thermal and Camera Images for 3D-Print Quality
Monitoring
Markus Bauer
1,∗
, Benjamin Uhrich
2,∗
, Martin Sch
¨
afer
3
, Oliver Theile
3
, Christoph Augenstein
2
and Erhard Rahm
2
1
Institute for Applied Informatics, Goerdelerring 9, Leipzig, Germany
2
Center for Scalable Data Analytics and Artificial Intelligence, Humboldtstraße 25, Leipzig, Germany
3
Siemens AG, Siemensdamm 50, Berlin, Germany
Keywords:
Artificial Intelligence, Additive Manufacturing, Physics-Informed Neural Networks, Multi-Modal Imaging,
Quality Monitoring.
Abstract:
With emerging technologies such as high-precision Laser Powder Bed Fusion (LPBF), rapid prototyping has
gained remarkable importance in metal manufacturing. Furthermore, cloud computing and easy-to-integrate
sensors have boosted the development of digital twins. Such digital twins use data from sensors on physical
objects, to improve the understanding of manufacturing processes as a whole or of certain production param-
eters. That way, digital twins can demonstrate the impact of design changes, usage scenarios, environmental
conditions or similar variables. One important application of such digital twins lies in early detection of man-
ufacturing faults, such that real prototypes need to be used less. This reduces development times and allows
products to be individually, affordable, powerful, robust and environmentally friendly. While typically simple
USB-camera setups or melt-pool imaging are used for this task, most solutions are difficult to integrate into
existing processes and hard to calibrate and evaluate. We propose a digital-twin-based solution, that leverages
information from camera-images in a self-supervised fashion, and creates a heat transfer based AI quality
monitoring. For that purpose, artificially generated labels and physics simulation were combined with a multi-
sensor setup and supervised learning. Our model detects printing issues at more than 91% accuracy.
1 INTRODUCTION
The virtual world of development, testing, and opti-
mization of complex products and processes nowa-
days precedes production processes in the real world.
Future components and operations are created and
simulated as software models – a so-called digital
twin. Digital twins are virtual equivalents of products,
machines, processes, or even entire production plants
that contain all relevant data and simulation models.
To ensure precise simulation throughout the life of a
product or its production, digital twins use data from
sensors on physical objects, to determine real-time
performance, operating conditions, and changes to
the system over time. By incorporating multi-physics
simulation, data analysis and machine learning capa-
bilities, digital twins can demonstrate the impact of
*
M. Bauer and B. Uhrich contributed equally to this
work as first authors.
design changes, usage scenarios, environmental con-
ditions or similar variables. Hence, excessive usage
of real prototypes is avoided, which offers advantages
in cost reduction and sustainability.
In the special case of metal additive manufactur-
ing (MAM), avoiding faulty prints is a crucial factor,
especially for the case of rapid prototyping, where
production time and material usage are key perfor-
mance indicators, and must be kept low. Further-
more, the influence of misjudged printing parameters
such as laser power must be reduced, to make a valid
estimate of the final product’s quality, based on the
prototypes. Digital twins are an adequate option, to
build up a quality monitoring, that ensures a high stan-
dard throughout the MAM process. Hence, they have
gained popularity in MAM.
Recent work has shown, that AI can support the
simulation of complex physical processes such as
fluid dynamics and heat transfer, which are of con-
Bauer, M., Uhrich, B., Schäfer, M., Theile, O., Augenstein, C. and Rahm, E.
Multi-Modal Artificial Intelligence in Additive Manufacturing: Combining Thermal and Camera Images for 3D-Print Quality Monitoring.
DOI: 10.5220/0011967500003467
In Proceedings of the 25th International Conference on Enterprise Information Systems (ICEIS 2023) - Volume 1, pages 539-546
ISBN: 978-989-758-648-4; ISSN: 2184-4992
Copyright
c
2023 by SCITEPRESS – Science and Technology Publications, Lda. Under CC license (CC BY-NC-ND 4.0)
539

siderable relevance for successfully printing layers in
MAM without issues such as porosity. This especially
accounts for the use of physics-informed neural net-
works (PINNs), which have been shown to provide
competitive simulation results to standard approaches
such as the finite element method (FEM) (Zhu et al.,
2021). In addition, there is a large trend in fusing
multiple sources of information in a single AI model,
which aids in manufacturing applications that typi-
cally utilize multiple sensors of different types. An-
other recent development in AI is the use of self-
supervised models that can significantly reduce the
training effort, by superseding the need for manual
annotation.
In this work, we are using AI methods, to demon-
strate how a quality monitoring can be implemented,
without the need for time- and cost expensive sen-
sor setups and manual data analysis. Our approach
aims for applicability in small to medium enterprises,
where access to specialist equipment (such as CT- or
X-ray scanners) often is limited, and labelling proce-
dures (required for supervised AI approaches) are un-
feasible, as it would require too much time of highly
skilled experts. For our solution, we thus create print
quality pseudo labels in a self-supervised fashion us-
ing only one reference build part (BP) and a sim-
ple USB-camera together with an autoencoder model.
We then proceed to combine the pseudo labels with
the output of a PINN that was applied to a pyrometer’s
measurements, to build a BP-quality-classifier. Our
model achieves state-of-the-art results as presented in
section 4.
To the best of our knowledge, our approach is the
first leveraging physics simulation, high-speed cam-
era imaging and AI together with widespread, inex-
pensive sensor setups for high accuracy error detec-
tion. The contribution of our work are as follows:
• We present a setup, which is easy to integrate, in-
expensive, and thus is a feasible solution for small
to medium enterprises (SMEs).
• We use a self-supervised autoencoder to create la-
bels for classification as high, medium and low-
quality layers, whereas data exploration is re-
duced to evaluating few representative samples.
• We demonstrate the use of PINNs for quality as-
surance in LPBF processes.
• We show that pseudo labels taken from camera-
images and thus reflecting the BP’s quality can
be used to directly build a classifier upon highly
informative temperature field information. This
way, the model may be used to identify critical
parts in the temperature field images and then re-
fined to more sophisticated models.
2 RELATED WORK
To understand the scientific background of our pro-
posed solution, related work in the domains of MAM
and AI needs to be considered. In this section, rele-
vant literature is provided, to gain a good overview of
the work’s fundamentals.
2.1 Metal Additive Manufacturing
Recently, MAM has experienced a significant up-
swing, as it offers great potential in reducing the effort
required to build metal parts. This can be especially
useful where iterative development of certain parts is
required, for example in the field of rapid prototyp-
ing. Several efforts have been made in MAM mon-
itoring and computer-assisted process controlling by
various scientific and industry teams. To this end,
Praveena et al. provide a comprehensive review of
MAM, particularly on methods, applications, materi-
als, challenges, trends and future potentials (Praveena
et al., 2022). Nevertheless, MAM is a highly complex
process, that requires controlling of various parame-
ters such as laser-power, scan velocity etc. (Knaak
et al., 2021). Additionally, melting and fusing metal
leads to heating and cooling cycles that significantly
affect component quality. A research milestone in the
field of numerical simulation from Mukherjee et al.
made it possible to get a more in-depth understand-
ing of heat and fluid flow in MAM (Mukherjee et al.,
2018).
2.2 Machine Learning
Due to AI’s increasing popularity, various conceptu-
alizations have been proposed for automated or AI-
driven quality assurance in MAM. The most popular
approaches extract their information from melt pool
images or characteristics (Akbari et al., 2022; Kunkel
et al., 2019) or high-speed camera setups (Kwon et al.,
2018). Promising results could be achieved that way.
For example, Kunkel et al. (Kunkel et al., 2019)
achieve an accuracy of 99.7% in classifying four cat-
egories of yield strength (good, average, bad, and
mapping failure). Inspired by the success of ana-
lytic approaches that operate on melt pool shape or
layerwise camera-imaging, recent work includes se-
tups that combine multiple domains for even better
model accuracies. Shen et al. (Shen et al., 2022) pro-
pose a system for weld reinforcement. Their solution
includes multi-modal information given by the melt
pool camera images, as well as heatmap images of
different parameter groups.
We adapt the basic ideas and core findings of the
ICEIS 2023 - 25th International Conference on Enterprise Information Systems
540

referenced work and transfer them to our use case. In
addition, we extend the existing approaches, by pay-
ing particular attention to self-supervised learning and
heat flow simulation, to achieve comparable results
with less effort on the industry-practitioner side.
2.2.1 Autoencoder
Autoencoders (AEs) consist of two phases, the encod-
ing step and the decoding step. In the encoding step, a
non-linear function is learned that transforms the in-
put into a low-dimensional vector space, and in the
decoding step, an inverse transformation is learned
that reconstructs the input from this low-dimensional
vector space. AEs are an effective method for de-
tection of anomalies in unlabelled data. Bel-Hadj et
al. presented an AE for anomaly detection in vibra-
tion signals for structural health monitoring of an off-
shore wind turbine (Bel-Hadj and Weijtjens, 2023).
The principle also works in physics, as Ngairangbam
et al. have recently shown in an application using a
quantum AE (Ngairangbam et al., 2022).
In our case, autoencoders are used as a tool to au-
tomatically extract print quality labels from diverg-
ing representations of different BP’s layers, which is
a scenario comparable to referenced works.
2.2.2 Physics-Informed Neural Networks
Heat transfer during melting in 3D printing is one
of the most important factors influencing part qual-
ity in MAM. To monitor MAM processes, heat trans-
fer must be considered and understood. Such a
natural phenomenon based on physical laws is well
known. Researchers have been studying thermal be-
haviour more than 100 years and have formalized
their knowledge in the form of partial differential
equations (PDEs). There is an opportunity to incor-
porate this knowledge into classical deep learning al-
gorithms such as neural networks (NNs) to increase
prediction accuracy with the data-driven capabilities
of NNs. Raissi et al. were the first to show that PINNs
are a viable alternative method to obtain an approxi-
mation for solving these PDEs, using several time-
dependent benchmark problems (Raissi et al., 2019).
A good overview of the possibilities of PINNs for heat
transfer problems is given by Cai et al. (Cai et al.,
2021). Zhu et al. presented first results for heat trans-
fer and fluid flow in MAM using PINNs and compare
the solutions with finite element method.
PINNs are used in our work to generate input
for the error classifier. We assume that deviations
between the estimated temperature profiles and the
measured ones will help to indicate emerging prob-
lems such as delamination. As PINNs embed existing
physical knowledge, possibly more meaningful infor-
mation can be supplied than using just the raw data.
2.2.3 Multi-Modal Machine Learning
Multimodal ML is important if there is more than
one data representation or modality for the same real-
world application, respectively. This could be the
combination of text and images or images of different
types, such as greyscale and thermal images. Similar
to our work, Gaikwad et al. (Gaikwad et al., 2020)
incorporate information from a pyrometer as well as
a high speed video camera to characterize the quality
of single tracks printed using LPBF. They extract var-
ious statistical features for each sensor measurement
and process them using a set of echelon artificial neu-
ral networks. Using quality metrics generated from
profilometer measurements, their approach provides
state-of-the-art results for detecting and pairing errors
(e.g., balling, keyholding) to critical process param-
eters (e.g., laser velocity and laser power). More re-
cent work of the authors (Gaikwad et al., 2022) on
the effects of melt pool characteristics (e.g., tempera-
ture, spatter, and size) on build part porosity presents
a similar approach. The main difference to our work
lies in the more time-, knowledge- and resource ex-
pensive setup, which may be impractical for small to
medium enterprises.
As described in section 4, multi-modal machine
learning is a good strategy to increase the perfor-
mance of a printing error classifier. We thus make
use of this technique in our work.
3 METHODS
Our proposed architecture features the application of
supervised CNN learning, Autoencoders for label-
generation and process simulation using PINNs. Be-
low, those methods’ theoretical background is pro-
vided.
3.1 Laser Powder Bed Fusion
For our experiments, we use the LPBF procedure,
which is one of the most widespread and industrially
used additive manufacturing processes. It is based on
the melting of single metal powder layers using a laser
beam. The laser energy is focused on the powder sur-
face and the powder is melted at the focal point due
to the high energy-density. The laser “scans” the geo-
metric shape of the component to be produced in each
powder layer, i.e., the laser beam is deflected by a mir-
ror system and the focal point is guided over the pow-
Multi-Modal Artificial Intelligence in Additive Manufacturing: Combining Thermal and Camera Images for 3D-Print Quality Monitoring
541

der surface according to a predefined pattern. After
melting a layer, the build platform is lowered, usu-
ally approx. 50 µm, powder is reapplied through a re-
coating system and afterward the next layer is melted.
The laser energy is sufficient to create a melt pool
that extends over several layer thicknesses. However,
the resulting melt pool must be adapted to both the
material and the process settings to ensure optimal,
true-to-shape solidification of the metal without de-
fects such as cracks or flaws. It is thus similar to the
welding process, but more complex, as not only indi-
vidual traces are melted, but flat areas besides small
zones are created without interruptions. The melting
and cooling behaviour of the process is more compre-
hensive and dependent on a variety of process condi-
tions.
3.2 Multimodal Dataset
To develop and test a real-time data processing work-
flow, EOS M 290 and SLM 280 laser melting ma-
chines were used. In total, nine different specimens
of pillars have been built in two distinct print jobs
with AISI 316L (1.4404), and IN718 (2.4668) pow-
der. For each print job, 382 × 288 pixels greyscale
images and pyrometer heatmaps of λ = 7 µm to 14 µm
were recorded with f
record
= 3 Hz. While for the first
job only smaller printing errors could be observed
qualitatively, the second print job contained signifi-
cant warping / delamination issues. The quality of
the first build job was evaluated by manufacturing ex-
perts, using surface roughness and shape deviation
measurements, and found to be on a par with the man-
ufacturer’s quality standards. For the second build
job, no further part evaluation was done, as severe is-
sues were clearly visible.
3.3 Machine Learning Methods
Multiple machine learning methods have been ap-
plied, to create the error classifier, including an au-
toencoder, PINNs and convolutional neural networks
(CNNs) trained with supervision.
An Autoencoder, as described in section 2.2.1 is a
special kind of NN that uses an encoder E to create
vector representations z (:= embeddings) from input
data X (i.e., camera images), and a decoder D to re-
store the original images. The output image
ˆ
X thus is
created by:
ˆ
X = D(z ∼ E(X, ω), θ) (1)
where ω refers to the encoder’s and θ to the decoder’s
parameters. As the decoder is simply the inverse of
the encoder, weights can be shared between them. In
this case, ω is identical with θ. For training, a re-
construction error between X and
ˆ
X is calculated and
used to optimize the parameters ω of the network by
solving:
argmin
ω,θ
∑
(X −
ˆ
X)
2
N
(2)
with N as the total number of input samples. The cre-
ated embeddings z can then, as in our case, be used
as pseudo labels to train further models, or directly to
perform tasks like clustering etc.
PINNs describe a special form of NNs that incor-
porate PDEs as a mathematical formalism of knowl-
edge about physical behaviour. A neural network is
trained to learn a function T
NN
(t,x, y, z,W, b) that can
approximate a scalar temperature field while consid-
ering the energy conservation equation. t,x,y,z de-
scribes the spatial-temporal domain of the BP and W ,
b are the trainable weights and bias of the neural net-
work. The optimization of the weights and biases W,
b are driven by initial and boundary value conditions
as well as by the PDE of energy conservation. If any
of the three restrictions is not satisfied, this is penal-
ized in the form of the loss function (3) and optimized
by backpropagation.
Loss = λ
1
R
1
+ λ
2
R
2
+ λ
3
R
3
(3)
Here R
1
and R
2
are initial and boundary conditions,
and R
3
describes the energy conservation equation.
To obtain the derivatives of the learned function T
NN
,
automatic differentiation is used. λ
1
− λ
3
are weights
of the individual loss terms, ranging from 0-1, prior-
itizing the loss terms differently. Using the pseudo
labels created from the autoencoder and the images
created with the PINNs, a CNN M(X , ψ) is trained in
a supervised fashion. This is done by optimizing the
parameters ψ using the cross entropy loss between the
outputs of M and the pseudo labels
ˆ
X.
3.4 Proposed Training Architecture
To create an error classification model, we are using
a procedure as depicted in Fig. 1. We are combining
both the thermal and greyscale records in the created
dataset. For that purpose, first, we train an autoen-
coder to a set of hold-out patches taken from the suc-
cessful BPs greyscale images, with the objective to
reduce the mean squared error of the reconstruction
vs. the input image.
The greyscale data consists of 110 × 110 pixels
patches x and x
re f
(15112 patches in total), cropped
from the full-size images, around the individual pil-
lar’s centre. Additionally, as the pillars are of different
shape and thus may never fill the whole image patch
area, the final row of pixels was repeated to the edge
ICEIS 2023 - 25th International Conference on Enterprise Information Systems
542
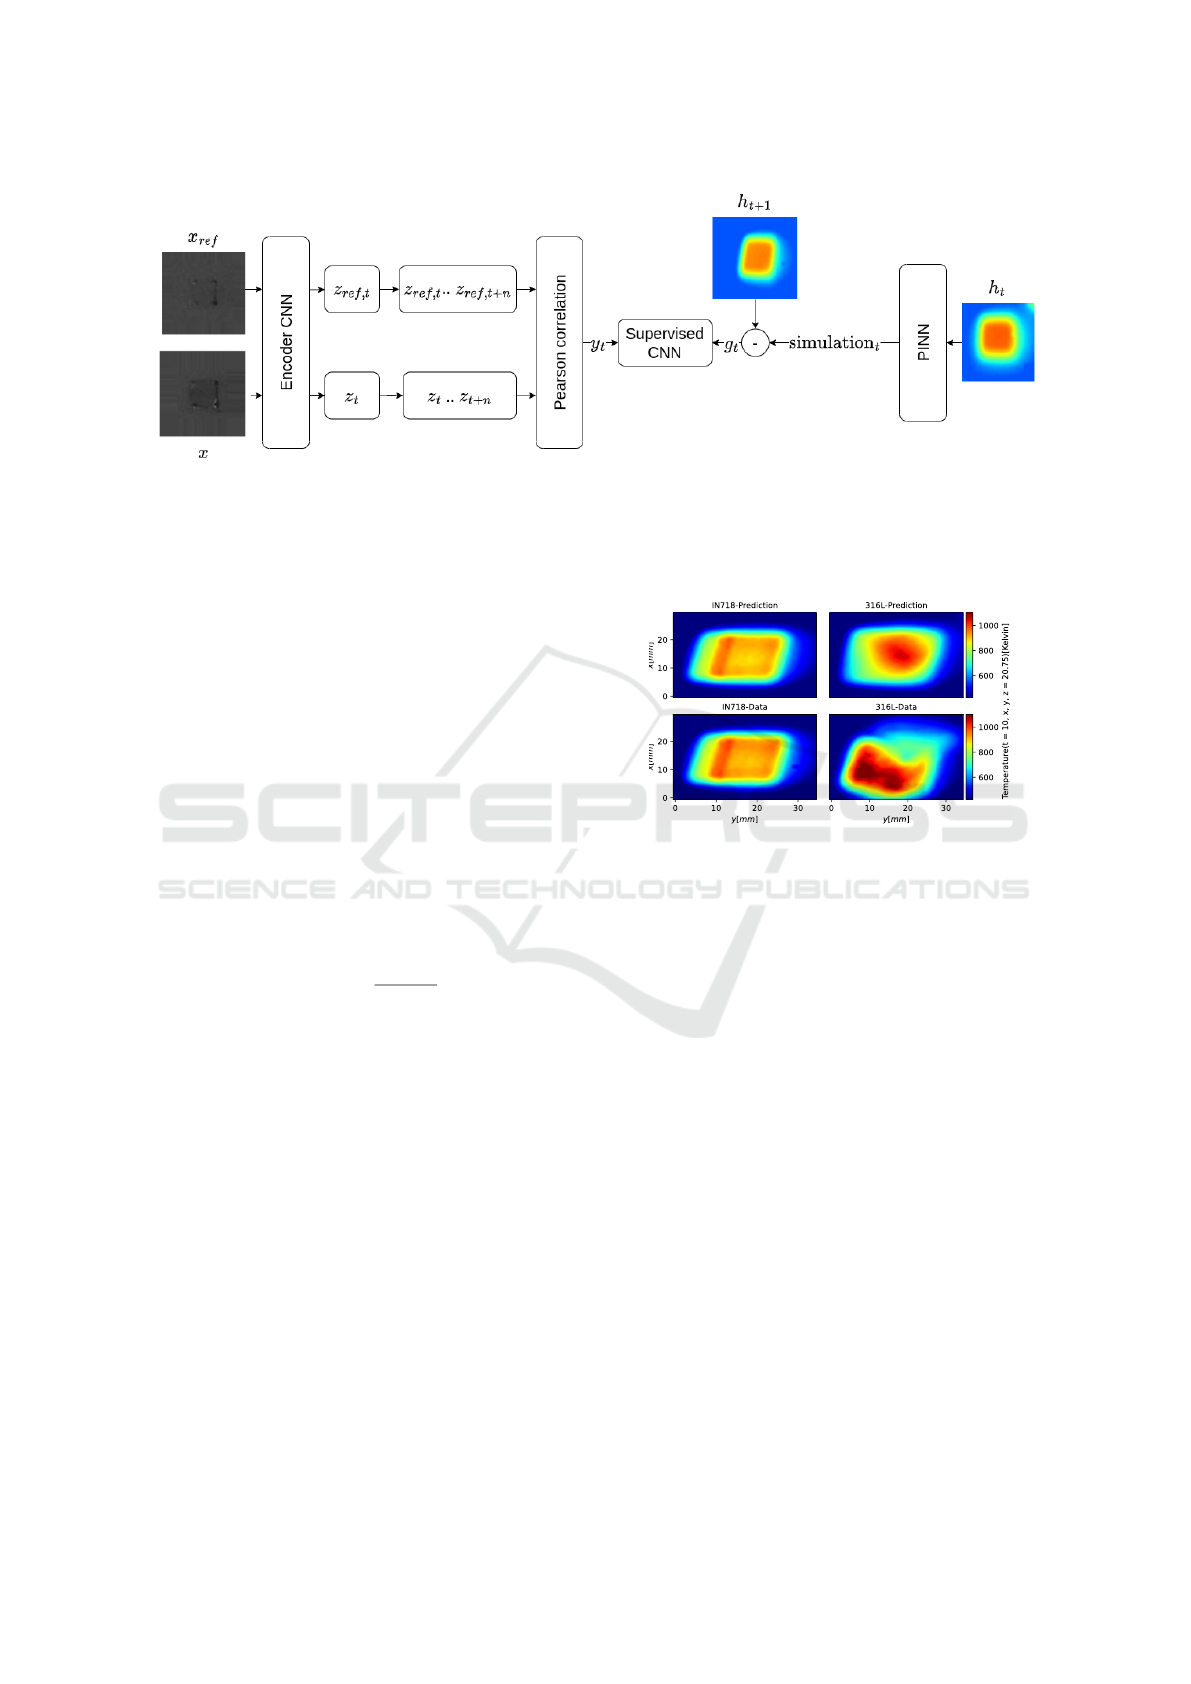
Figure 1: Architecture of the proposed training method - Camera images x
t
are collected and processed using a NN
encoder, together with a reference image. After buffering a certain number of images, a pseudo label is created using the
Pearson correlation between reference and current images. As soon as pseudo labels y
t
are created for a layer, referring images
g
t
are provided, which are created by subtracting the currently predicted temperature profile from the measured temperature
field image. That way, a neural network is trained, to later predict, whether a layer was printed successfully.
of the patch according to the actual build parts shape,
rather than applying zero padding. Our autoencoder
uses a Resnet18-like architecture (He et al., 2016) for
the encoder and decoder.
With the trained encoder, we then process the re-
maining images of both BPs to create a vectorized
version z and z
re f
of each patch, whereas z are the
vectors of the faulty BP and z
re f
are the ones of the
successful BP. Afterwards, all vectors are stored in
buffers of length n = 10 and compared using the Pear-
son correlation. That way, we identify trends of dif-
ference between the BPs, without any human supervi-
sion. With this procedure, except for an initial amount
of 10 layers, we create pseudo labels y according to
the following rule:
y =
successful, Pearson r >= 0
warning, 0 >
∂Pearson r
∂t
> −0.02
failed, otherwise
(4)
The thresholds for the pseudo labels have been set em-
pirically.
In the next step, we create input images g for train-
ing the classifier M. For that purpose, regions of the
pillars are cropped from the heatmap images. We then
create heatmap predictions h for each next layer, start-
ing with the n − 1
th
layer (as we already needed to dis-
card images for greyscale images). We then subtract
the heatmaps simulation
t
predicted from h
t
from the
previously measured ones h
t+1
and take the absolute
error to create a new training image g
t
.
4 RESULTS
To create our model, we are running three distinct
tasks. Those consist of training the PINN and AE,
creating labels and images, and finally creating the
Figure 2: Comparison of heat prediction - Heat predic-
tion for INC 718 (left) and 316L (right) in comparison with
measurement data. For the INC718 print job prediction and
measurement data match. In the case of the 316L print job
prediction and measurement data show differences indicat-
ing defective layers, as the simulations match, i.e., layers
that have been printed earlier.
classifier. Our particular results for each step are pre-
sented below.
4.1 Heatmap Simulation
Heatmap prediction is based on a fully connected,
physics-informed feed forward network. Each printed
layer is simulated by solving an initial and boundary
value problem. The NN is informed by the energy
conservation equation, which describes the physical
laws of heat transfer, and the solution domain is de-
scribed by randomly selected collocation points. On
these points, a solution is prepoints, based on a batch
size of 1000. We set initial and boundary conditions
based on real measured data. For this purpose, a train-
ing data set of a total of 1200 thermal images was
used for the entire printing process. Additionally, a
heat source position detection method is implemented
to produce comparable heatmaps. The heat source
Multi-Modal Artificial Intelligence in Additive Manufacturing: Combining Thermal and Camera Images for 3D-Print Quality Monitoring
543
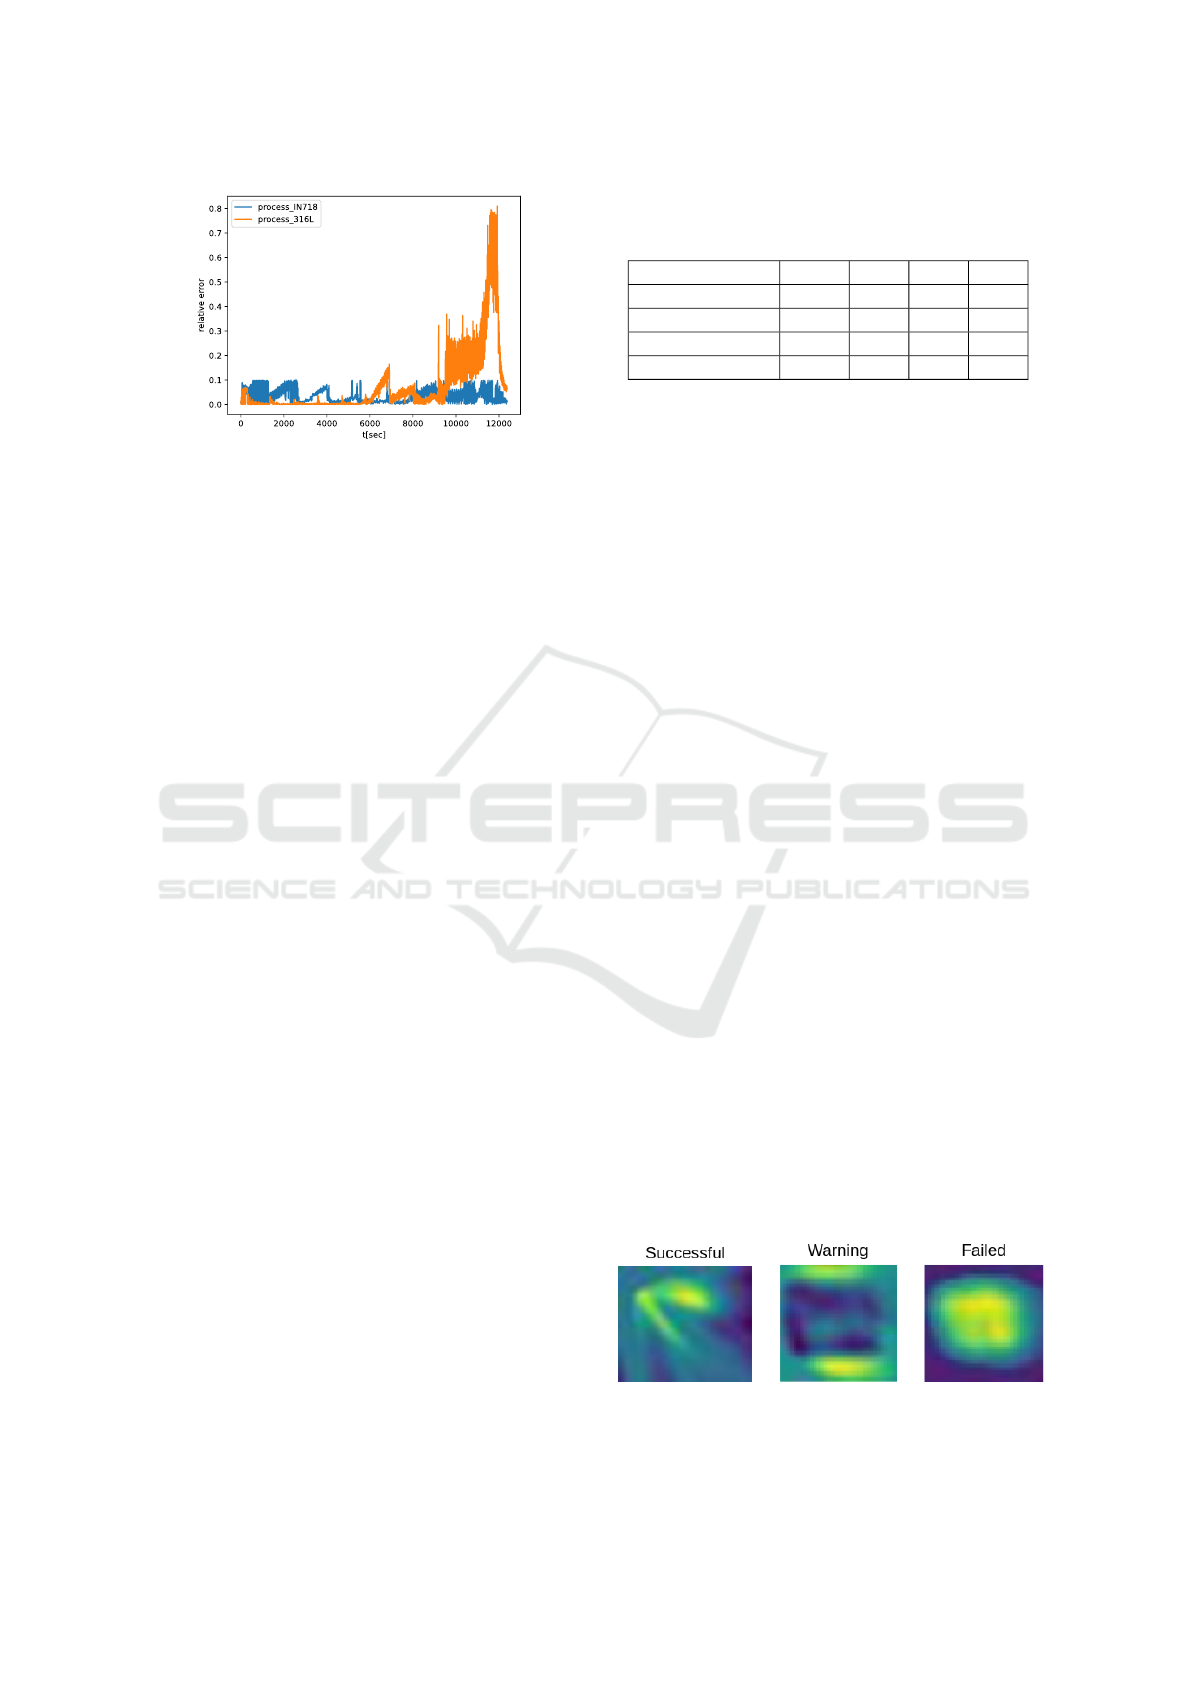
Figure 3: Error between temperature scalar field of pre-
diction and sensor data - To quantify anomalies, the rela-
tive error between prediction and sensor data is calculated
over more than three hours of printing. Irregularities can be
detected, especially in the last section of 316L.
is described analytically by a Gaussian function. A
sigmoid function was used as an activation function
in each layer and a learning rate of 10
−3
. Fig. 2
shows an example solution of a heatmap prediction
for a specific point at a time t. For the nickel-based
alloy INC718, the heatmap simulation is comparable
to the measured data of the print job. For the 316L
stainless steel, the heat simulation and the measured
data are not equivalent, significant disparities are visi-
ble. Boundary conditions are not met, and heat build-
up can be seen, affecting BP quality. These anomalies
can be quantified, as can be seen in Fig. 3. The dis-
tance between the scalar field of the temperature mea-
surement and the simulation is calculated and quanti-
fied using the relative error over a printing duration
of more than three hours. Significant differences be-
tween the simulation and the measurements can be
seen, especially in the fourth quarter.
4.2 Generated Pseudo Labels
The heatmap difference images g are matched with
the labels y to create a dataset of 37246 data pairs. As
the pyrometer-based data was recorded using a higher
sampling rate than the greyscale images, the same la-
bel y
t
has been used for a layer’s heatmap images, ac-
cording to the timestamp of the greyscale images. The
data was split into a training and test set, whereas sep-
arate layers were used in the subsets to avoid overfit-
ting. Fig. 4 shows some example images taken from
g. From the examples, it’s evident, that distinguish-
ing successful and failed layers can be a challenging
task, when considering the deviations in the simulated
and measured temperature profile. A plausible way to
interpret the data, may be that the temperature differ-
ences are generally low for successfully printed lay-
ers. In case a faulty layer or multi-layer area of the
BP is emerging, anomalous temperature spread is ris-
Table 1: Performance of different classification models -
Evaluation were done using balanced accuracy (Acc.) and
f
1
scores for successful (s), warning (w), and failed (f).
Model Acc. f
1,s
f
1,w
f
1, f
Resnet18 0.917 0.98 0.87 0.89
Resnet50 0.920 0.98 0.87 0.90
EfficientNet-B0 0.926 0.98 0.88 0.89
MobileNet-V3 0.860 0.96 0.79 0.81
ing especially at the corners of the BPs, which is the
case for the warning class. By the time a faulty layer
can even be identified by human supervision, the tem-
perature profile shows larger deviations in the area
where the BP is melted. It is, however, hard to draw a
clear border here. Thus, using self-supervised learn-
ing as a label generator and an AI-based approach to
build a classifier is a promising approach, that enables
manufacturers to create a fault prevention based on
heatmap data.
4.3 Printing Error Classifier
With the created dataset, we proceed to train a su-
pervised CNN. We use a learning rate of 5 · 10
−6
,
a weight decay of 1 · 10
−7
, and a cyclic learning
rate. We evaluated the Resnet18, Resnet50 (He
et al., 2016), EffcientNet-B0 (Tan and Le, 2019) and
MobileNet-V3 (Howard et al., 2017) architectures, to-
gether with 2D batch norm layers and Dropout of 0.1
for each convolution layer, which were pretrained to
the ImageNet dataset (Deng et al., 2009). The im-
age size was downsampled to 35 × 35 pixels, with a
batch size of 256. The cross entropy loss was used
as a cost function. We train the model until the point
of convergence, which is determined as the intersec-
tion of the training and validation loss curve. After
training the model, classification accuracy was mea-
sured using the test data and within a 5-fold cross val-
idation scenario. A maximum accuracy of 92.60%
was achieved this way by a EfficientNet-B0 (c.f. Tab.
1), which even improves earlier work of the authors
(Bauer et al., 2022). For most of the individual
classes’ f
1
scores, the EfficientNet-B0 performs best
as well, even though the residual networks achieve
comparable performance.
Figure 4: Example images - of a successful layer (left),
a layer that causes a warning (centre), and a faulty layer
(right).
ICEIS 2023 - 25th International Conference on Enterprise Information Systems
544
Further investigation indicated that most confu-
sion occurs for failed layers that have been marked as
successful. The successful layers, on the other hand,
have been classified very well. The most confusion
only occurred to the warnings, which are not critical
for practice. It should be noted that the earlier layers
recorded consist of support material, which may mis-
lead the classifier, given the fact that only few such ex-
amples are provided. Additionally, outliers in the self-
supervised labelling procedure can impose a degree of
label noise, which can’t be avoided completely. Thus,
the number of missed errors can be expected to be
lower than in Tab. 1, in practice.
In a real-world application, however, a false neg-
ative for an actually faulty layer may cause severe is-
sues within the production. The warning class serves
as a measure against missing faulty layers completely,
by smoothing the borders between successful and
failed. The high f
1,w
value (c.f. Tab. 1) indicates
that the warning class compensates most of the suc-
cessful as failed / failed as successful false positives.
This would reduce the amount of manual inspection,
as well as “false alarms” in practice.
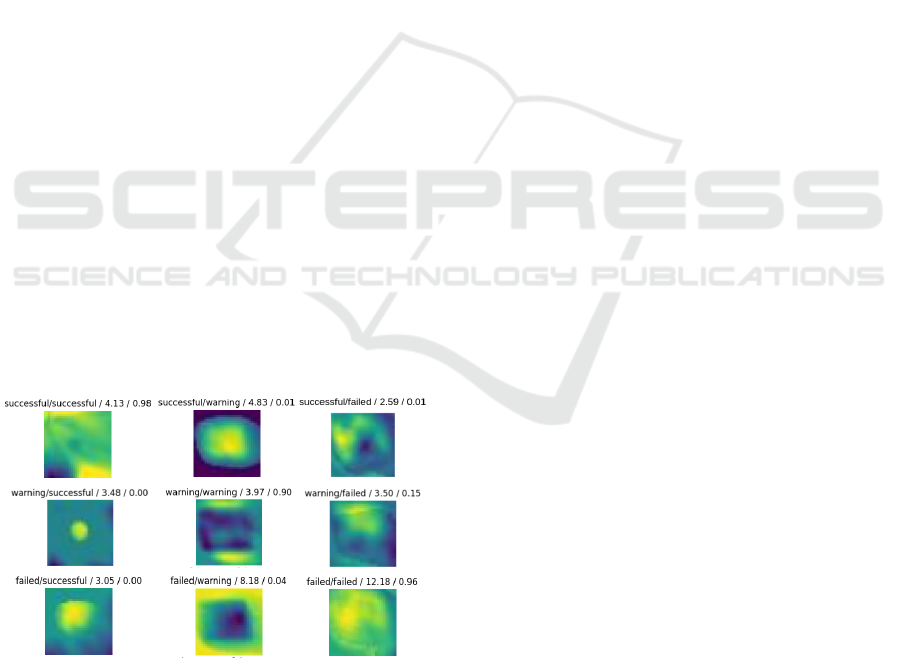
The model’s performance can be demonstrated
better, by visually investigating how certain cases
have been classified, as depicted in Fig. 5. The exam-
ple underlines the model’s capability of fine-granular
separation of different temperature profile types. For
example, the first and last image look very similar,
but show indeed a successful and failed layer. The
model successfully classifies both of them right, even
with a high probability. Confusion with the success-
ful class, as described above, often occurs during the
support layer printing. The model’s predictions thus
seem plausible.
Figure 5: Example temperature difference im-
ages – and the model’s referring prediction (ac-
tual/prediction/loss/probability) for low model loss.
5 DISCUSSION
Summarizing, it could be shown that the presented ap-
proach successfully can be used to predict a BPs cur-
rent quality, using example components. We achieve
a competitive accuracy in this task using various AI
methods. Our approach has potential to increase AM
production quality, while keeping efforts for manu-
facturers low, as only few resources are needed for
implementation.
For a more general approach, however, extensive
evaluation needs to be done on other components, es-
pecially on such with different and more complex ge-
ometries. The transferability of the approach to other
metal powder has not yet been demonstrated. Fur-
ther experiments should be conducted to determine
the limitations of the proposed approach, when the
material parameters, and thus the material behaviour
itself, change. Furthermore, the problem with the ini-
tially printed support layers has to be clarified and has
not been solved in this work so far. This will be inves-
tigated in a further approach. Possibly, the solution
can be found in an additional model trained on the
support layers. If the data quality can be improved,
especially for the greyscale images, a more detailed
analysis of the BP would be possible.
6 CONCLUSIONS AND FUTURE
WORK
In this paper, we presented an approach, to build a
simple AI-based error prevention, that combines mul-
tiple modalities of sensors. The created model can be
used to digitally clone the actual BP’s printing pro-
cedure, and to predict its current state. It therefore
serves as a first digital twin part for in-process qual-
ity assurance. We conclude that extracting relevant
information about BP quality from measured temper-
ature profiles may be difficult, but of value for var-
ious quality monitoring models. To avoid the need
for laborious annotation procedures, self-supervised
learning may be used with more comprehensive pre-
diction examples based on greyscale image data. In
the future, issues, such as the remaining failed-as-
successful classification should be investigated and
reduced, to make the model a robust variant for prac-
tical use. Besides that, different usage scenarios may
be investigated. This includes the mapping of AI and
temperature profiles using different material proper-
ties after the print. As in the presented examples, self-
supervised learning may be a good starting point here
as well. Another important aspect is the application of
such a monitoring tool as a trigger for a machine con-
Multi-Modal Artificial Intelligence in Additive Manufacturing: Combining Thermal and Camera Images for 3D-Print Quality Monitoring
545

troller. For example, errors could be minimized, if the
laser power is reduced by the time of a warning, or at
least if an error occurs. This would likely lead to an
improved BP quality and thus should be investigated.
Additionally, machine learning should be used to in-
tegrate more parts of a complete digital twin, such as
geometry optimization and material planning. Sum-
marizing, the presented approach is a vital proof of
concept for the feasibility of moving AI into practice
without too many expenses and labour time.
ACKNOWLEDGEMENTS
All results presented refer to the TWIN project
(https://websites.fraunhofer.de/TWIN), funded by the
Federal Ministry of Education and Research, Ger-
many (02K18D052).
REFERENCES
Akbari, P., Ogoke, F., Kao, N.-Y., Meidani, K., Yeh, C.-Y.,
Lee, W., and Farimani, A. B. (2022). MeltpoolNet:
Melt pool characteristic prediction in metal additive
manufacturing using machine learning. Additive Man-
ufacturing, 55:102817.
Bauer, M., Augenstein, C., Sch
¨
afer, M., and Theile, O.
(2022). Artificial intelligence in laser powder bed fu-
sion procedures – neural networks for live-detection
and forecasting of printing failures. Procedia CIRP,
107:1367–1372. Leading manufacturing systems
transformation – Proceedings of the 55th CIRP Con-
ference on Manufacturing Systems 2022.
Bel-Hadj, Y. and Weijtjens, W. (2023). Anomaly detection
in vibration signals for structural health monitoring
of an offshore wind turbine. In Rizzo, P. and Mi-
lazzo, A., editors, European Workshop on Structural
Health Monitoring, volume 270 of Lecture Notes in
Civil Engineering, pages 348–358. Springer Interna-
tional Publishing, Cham.
Cai, S., Wang, Z., Wang, S., Perdikaris, P., and Karniadakis,
G. E. (2021). Physics-informed neural networks for
heat transfer problems. Journal of Heat Transfer,
143(6).
Deng, J., Dong, W., Socher, R., Li, L.-J., Li, K., and Fei-
Fei, L. (2009). Imagenet: a large-scale hierarchi-
cal image database. In 2009 IEEE conference on com-
puter vision and pattern recognition, pages 248–255.
IEEE.
Gaikwad, A., Giera, B., Guss, G. M., Forien, J.-B.,
Matthews, M. J., and Rao, P. (2020). Heterogeneous
sensing and scientific machine learning for quality as-
surance in laser powder bed fusion – a single-track
study. Additive Manufacturing, 36:101659.
Gaikwad, A., Williams, R. J., de Winton, H., Bevans, B. D.,
Smoqi, Z., Rao, P., and Hooper, P. A. (2022). Multi
phenomena melt pool sensor data fusion for enhanced
process monitoring of laser powder bed fusion addi-
tive manufacturing. Materials & Design, 221:110919.
He, K., Zhang, X., Ren, S., and Sun, J. (2016). Deep resid-
ual learning for image recognition. In 2016 IEEE Con-
ference on Computer Vision and Pattern Recognition
(CVPR). IEEE.
Howard, A. G., Zhu, M., Chen, B., Kalenichenko, D.,
Wang, W., Weyand, T., Andreetto, M., and Adam,
H. (2017). Mobilenets: Efficient convolutional neu-
ral networks for mobile vision applications.
Knaak, C., Masseling, L., Duong, E., Abels, P., and Gill-
ner, A. (2021). Improving build quality in laser pow-
der bed fusion using high dynamic range imaging and
model-based reinforcement learning. IEEE Access,
9:55214–55231.
Kunkel, M. H., Gebhardt, A., Mpofu, K., and Kallweit, S.
(2019). Quality assurance in metal powder bed fusion
via deep-learning-based image classification. Rapid
Prototyping Journal, 26(2):259–266.
Kwon, O., Kim, H. G., Ham, M. J., Kim, W., Kim, G.-H.,
Cho, J.-H., Kim, N. I., and Kim, K. (2018). A deep
neural network for classification of melt-pool images
in metal additive manufacturing. Journal of Intelligent
Manufacturing, 31(2):375–386.
Mukherjee, T., Wei, H. L., De, A., and DebRoy, T. (2018).
Heat and fluid flow in additive manufacturing—part
i: Modeling of powder bed fusion. Computational
Materials Science, 150:304–313.
Ngairangbam, V. S., Spannowsky, M., and Takeuchi, M.
(2022). Anomaly detection in high-energy physics
using a quantum autoencoder. Physical Review D,
105(9).
Praveena, B., Lokesh, N., Abdulrajak, B., Santhosh, N.,
Praveena, B. L., and Vignesh, R. (2022). A compre-
hensive review of emerging additive manufacturing
(3d printing technology): Methods, materials, appli-
cations, challenges, trends and future potential. Mate-
rials Today: Proceedings, 52:1309–1313.
Raissi, M., Perdikaris, P., and Karniadakis, G. E. (2019).
Physics-informed neural networks: A deep learn-
ing framework for solving forward and inverse prob-
lems involving nonlinear partial differential equations.
Journal of Computational Physics, 378:686–707.
Shen, B., Lu, J., Wang, Y., Chen, D., Han, J., Zhang, Y., and
Zhao, Z. (2022). Multimodal-based weld reinforce-
ment monitoring system for wire arc additive manu-
facturing. Journal of Materials Research and Tech-
nology, 20:561–571.
Tan, M. and Le, Q. (2019). EfficientNet: Rethinking model
scaling for convolutional neural networks. In Chaud-
huri, K. and Salakhutdinov, R., editors, Proceedings of
the 36th International Conference on Machine Learn-
ing, volume 97 of Proceedings of Machine Learning
Research, pages 6105–6114. PMLR.
Zhu, Q., Liu, Z., and Yan, J. (2021). Machine learn-
ing for metal additive manufacturing: predicting tem-
perature and melt pool fluid dynamics using physics-
informed neural networks. Computational Mechanics,
67(2):619–635.
ICEIS 2023 - 25th International Conference on Enterprise Information Systems
546
