
From Maps to Models: Computing Velocity Models for Turn
Prediction Using OpenStreetMap Data
Matthias Graichen
1
and Lisa Graichen
2a
1
Independet Researcher, Munich, Germany
2
Institute of Psychology and Ergonomics, Human Machine Systems, Technical University Berlin, Berlin, Germany
Keywords: Driving Behavior, Driving Data, Map Data, GPS Data, Driving Maneuvers, Data Analysis, Data Processing,
Prediction Algorithms.
Abstract: Analyzing and modeling behavioral data from driving studies can be challenging and often entails numerous
steps of data handling, preparation, and aggregation before the final data modeling and extraction of results
can be performed. In research papers, these steps are often described only briefly due to the natural limitation
of words and intended focus on the related research questions. However, for smaller research groups or
individual researchers without IT experts, the engineering of appropriate data processing pipelines for this
type of research can be challenging. To address this issue, this work presents a step-by-step guide on how we
tackled one of these challenges in our recent research activities. Our work focused on the implementation of
a published algorithm for the prediction of turning maneuvers at intersections, which partly relies on map data
for computing path curvature. We describe how we used freely available technologies and which steps were
applied for building a data processing pipeline to enrich the recorded driving data with map data obtained via
the OpenStreetMap platform and API.
1 INTRODUCTION
Analyzing driving behavior is essential in the domain
of traffic or engineering psychology (also referred to
as human factors), especially with regard to the
design of in-vehicle information systems (IVIS) or
advanced driving assistance systems (ADAS).
Driving data is usually recorded in laboratory
settings, such as driving simulators, or in real traffic
(naturalistic) environments using a test vehicle
equipped to record vehicle signals, videos of the
driver, driving scenarios, and GPS information. In
particular, the precise recording of position data plays
an important role in the comparative analysis of
driving behavior between different drivers in similar
traffic environments.
However, storing, (pre-) processing, and
analyzing driving data entails numerous challenges
before interpretation or modeling can be performed.
In M. Graichen et al. (2018), the methodological
issues as well as guidelines to address these
challenges have been outlined. In this work, we
focused on an overall framework for pre-processing
a
https://orcid.org/0000-0001-8634-6843
and analyzing driving data and mentioned the use of
external data sources such as map data to enrich the
driving data. Examples include meta information on
street names, speed limits, and intersection types.
Industry-affiliated research partners might even use
high-precision digital maps data and satellite pictures
to obtain additional information, such as lane
markings or the design of the road infrastructure.
However, in academic domains or non-
industry/public research projects, access to such data
platforms is often not available, prompting
researchers to use alternatives such as Google Maps
(e.g., for satellite images) or OpenStreetMap (OSM).
Smaller research groups or individual human
factors researchers without access to experts from an
IT department or data engineering team may find
themselves in a situation where they need to
implement the required data processing pipelines for
such data. In research papers, these data steps are
often described only briefly due to the natural
limitation of words and intended focus on the related
research questions. Nevertheless, there is some work
which seeks to describe the methodological issues of
Graichen, M. and Graichen, L.
From Maps to Models: Computing Velocity Models for Turn Prediction Using OpenStreetMap Data.
DOI: 10.5220/0011970400003479
In Proceedings of the 9th International Conference on Vehicle Technology and Intelligent Transport Systems (VEHITS 2023), pages 313-320
ISBN: 978-989-758-652-1; ISSN: 2184-495X
Copyright
c
2023 by SCITEPRESS – Science and Technology Publications, Lda. Under CC license (CC BY-NC-ND 4.0)
313

data analysis in the human factors domain (see M.
Graichen et al., 2018, Beggiato, 2015, p. 38; Pereira
et al., 2014).
The present work aims to contribute to this
literature by outlining a data processing framework
for using map data from an open source platform to
enrich naturalistic driving data, which was necessary
to recreate a turn prediction algorithm found in the
literature.
2 OBJECTIVE
The presented framework is linked to research
activities that aimed to extend an algorithm for
predicting turning maneuvers at intersections and is
now also used in studies on HCXAI (human-centered
explainable artificial intelligence; see L. Graichen et
al., 2022). One potential application of this algorithm
is to support drivers before performing a turning
maneuver at intersections by displaying a warning of
potentially crossing road users moving in the same
direction as the driver. However, the warning should
only be displayed in situations where the algorithm
predicts a turning maneuver during the approaching
phase toward the intersection. For example, when the
driver is going straight, no warning is displayed to
avoid undesired effects such as increasing driver
distraction.
The basis for this algorithm was presented by
Liebner et al. (2013) and later extended by M.
Graichen (2019, see also M. Graichen & Nitsch,
2017) to integrate more personal characteristics for
parametrizing the algorithm for individual drivers.
The core of the algorithm is mainly based on so-
called “desired velocity models,” which represent the
anticipated velocity while approaching the
intersection and performing the turn maneuver. One
way to obtain these models is by collecting and
clustering actual driving data. However, this
approach would require a database of typical driving
behaviors at each individual intersection. An
alternative and less costly approach would be to
extract map data and calculate the anticipated path
curvature for possible intersection maneuvers, which
can then eventually be converted into velocity
models.
However, the original article does not describe
from which data platform the map data was extracted
and only vaguely mentions how the path curvature
was calculated. The following sections outline the
framework for implementing our approach for a data
processing pipeline to obtain map data, calculate the
path curvature, and obtain the velocity models used in
the algorithm.
3 IMPLEMENTATION
The following sections describe the required
technologies for implementing the data processing
pipeline followed by an outline of the steps for
processing the map data and driving data.
3.1 Prerequisites and Technologies
Used
Our approach has its origin in experimental driving
studies in real traffic environments. Drivers were
required to take a fixed route through an urban
environment. During these trips, we recorded vehicle
signals via the CAN bus (e.g., driver’s speed, lateral
acceleration or braking activities). In the following
sections, we assume that researchers have already
familiarized themselves with the possible routes
drivers were either required to take in an experimental
setup or took during a more naturalistic study design.
We also assume that sections of driving data can be
easily loaded into the preferred analysis framework.
The presented framework only uses technologies
that are freely available and can be easily installed on
any local machine or central server. However, we
assume that readers are already experienced with
programming and data processing languages such as
R or Python and SQL.
For (pre-) processing and analyzing data, we use
R (R Core Team, 2022; https://cran.r-project.org/)
and RStudio (https://posit.co/products/open-
source/rstudio/). For storing driving and map
information, a PostgreSQL database
(https://www.postgresql.org/) is used. However,
depending on the amount of processed data and the
individual setup, a simple SQLite database
(https://www.sqlite.org/index.html) may suffice if the
researcher is the only person who will work with the
data at one point in time. The installation of the
database is easy for common operating systems, such
as Windows or Mac, but it is recommended to read
the documentation or supplementary material to get
the basic ideas of setting up a database. In this regard,
a SQLite database is easier to apply, as installation is
not necessary. In either variant, the database can
usually be easily connected in R or Python.
For the map information, we obtained freely
available map data from OSM
(https://www.openstreetmap.org/) by using the
Overpass API (https://overpass-api.de/). Relevant
VEHITS 2023 - 9th International Conference on Vehicle Technology and Intelligent Transport Systems
314
GPS positions were analyzed using satellite images
on Google Maps. However, in comparison to Google
Maps, OSM enables users to query information on the
underlying road segments that comprise the map data.
We implemented the presented example using R.
The code and data can be accessed at the following
URL: http://bit.ly/3Fw0xVd.
3.2 Obtaining Map Data
In the following section, we describe the steps for
processing map data from the OSM platform. The
procedure includes the following steps:
Identify representative GPS positions
Identify relevant OSM way segments related to
the identified GPS positions
Download relevant way information for the
identified segments
Download additional attributes (optional)
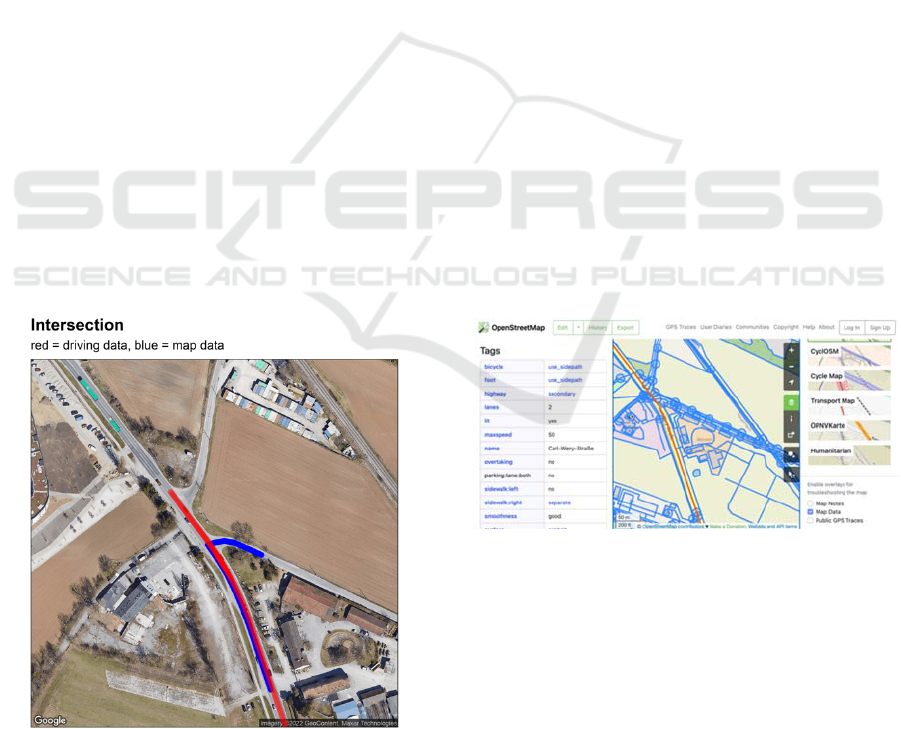
3.2.1 Identifying GPS Reference Positions
In our previous studies, we were interested in driving
behaviors at intersections. For a selection of various
intersections along the route, we identified
representative GPS coordinates for meaningful
reference positions on the road. A meaningful
position could be, for example, the position of a
stopping line or positions where weaker road users,
such as pedestrians or cyclists, would usually cross
the road and thus possibly the trajectory of the driver
during a turning maneuver.
Figure 1: Intersection (satellite view).
The GPS positions were identified using Google
Maps (e.g., by right-clicking the position of interest
to extract the GPS coordinates). For each position, the
GPS coordinates were then stored in the database.
The following sections refer to the intersection shown
in Figure 1.
3.2.2 Identifying Relevant OSM Way
Segments
For each GPS position, the coordinates were then
used in the search field of the OSM platform, which
will show the position on a map, similar to Google
Maps. For the next steps, users are recommended to
increase the zoom level into the map for better
manipulation of the OSM web interface. The
interface displays several options to interact with the
map on the right side of the web interface. The
“Layers” option enables the user to activate a view on
the meta information of the map data by selecting the
“Map Data” option. Next, the user will see the various
lines and layers underlying the OSM map data.
However, each road consists of several smaller way
segments, which can be selected by clicking one of
the lines.
For our analyses, we identified several way
segments related to the approaching phase to the
intersection (e.g., up to 150 m) and way segments of
adjunct crossing roads (e.g., up to 50 m), into which
drivers could potentially turn. For each way segment,
the corresponding way ID was detected using the
meta information provided in the web interface. For
each intersection, we collected several way IDs and
stored them in the database respectively.
Figure 2: OSM web interface.
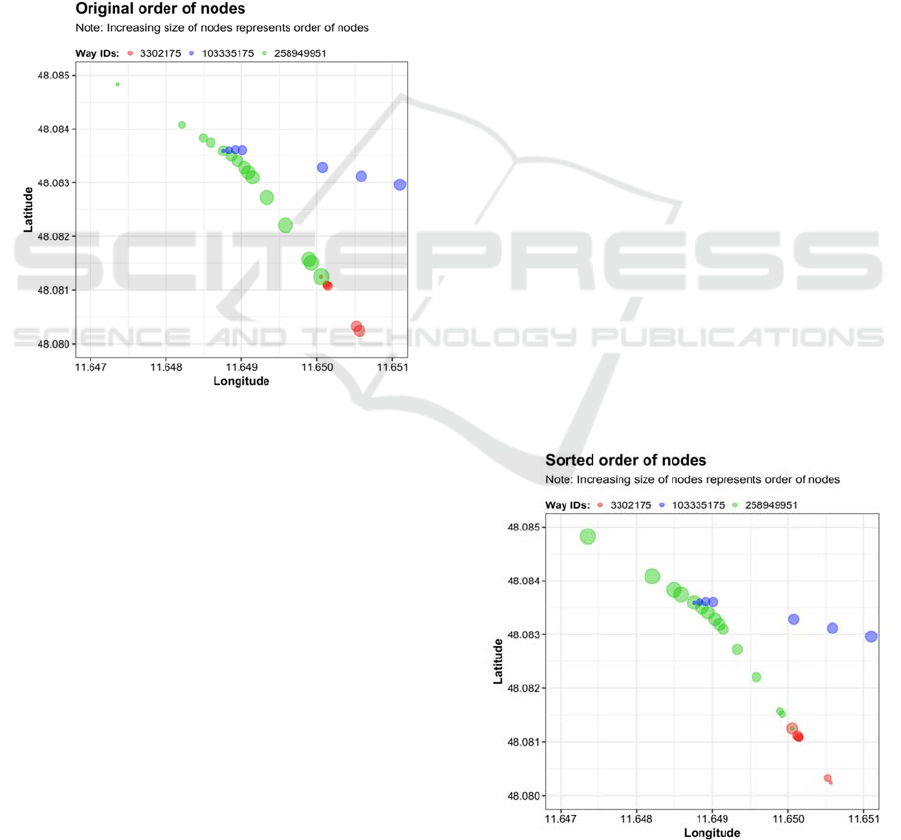
3.2.3 Downloading Way Segment Data
Each way segment consists of two or more nodes,
which are represented by GPS coordinates (see Figure
3). These nodes are not displayed in the OSM but can
be queried using the Overpass API. To obtain the
node data, the query pattern must be designed as
follows:
From Maps to Models: Computing Velocity Models for Turn Prediction Using OpenStreetMap Data
315
https://overpass-
api.de/api/interpreter?data=way(id:
WAY_ID
1
, WAY_ID
n
);out%20geom;
The placeholder WAY_ID should be replaced by
actual way IDs identified in the previous steps.
This pattern can then be used to automatically
create API queries in the analysis framework and
send requests to the Overpass interface (e.g., by using
the R package httr, Wickham, 2022). The request will
return an XML string from which node information
can be extracted (e.g., using the R package xml2,
Wickham et al., 2021). For each way segment, the
node data (e.g., order of nodes, reference IDs, and
GPS coordinates) were stored in the database
respectively.
Figure 3: Original order of nodes.
3.2.4 Downloading Additional Attributes
The way segment data can contain several other
parameters of interest for further analyses, such as
speed limit, number of lanes, or the presence of
dedicated bicycle lanes. This information is also
displayed in the OSM web interface and part of the
request results when using the API.
3.3 Pre-Processing Way Segment Data
Before the way segment data can be used to enrich
further analysis, users are recommended to check and
validate the alignment of the segments. The pre-
processing of the data should include the following
steps:
Correct alignment of way segments
Removal of unneeded nodes
Interpolating and trimming way segment data
Computing a distance to GPS reference point
All these steps should be supported by data
visualization to validate the results of each step.
3.3.1 Correct Alignment of Way Segments
As described above, each way segment consists of
several nodes. Naturally, the order of these nodes will
not always match the route’s direction in the driving
study, for example, when a single way segment
represents both driving directions instead of two
separate way segments for each driving direction. In
our case, it was necessary to connect the different way
segments and the nodes to a single way segment.
However, without applying validation checks and
correction procedures, this can lead to undesired
results, for example, when GPS coordinates between
the nodes need to be interpolated.
To address this issue, the following pattern was
applied to the data. For each pair of succeeding way
segments, check if the first node ID of the second way
segment matches the last node ID of the previous way
segment. If this is not the case, the order of the nodes
of the second way segment needs to be reversed. This
procedure should be applied separately for the very
first and second way segment to ensure the correct
starting direction from the beginning (see Figure 4).
In some cases, such as at intersections, two
succeeding way segments are not adjunct, which
means that the outer nodes of the second segment do
not match any of the nodes of the previous segment.
To ensure that the correction still works, an additional
(dirty) step is applied that looks for the third segment
in a row of segments to find the matching node and
reverts the segment if necessary.
Figure 4: Sorted order of nodes.
VEHITS 2023 - 9th International Conference on Vehicle Technology and Intelligent Transport Systems
316
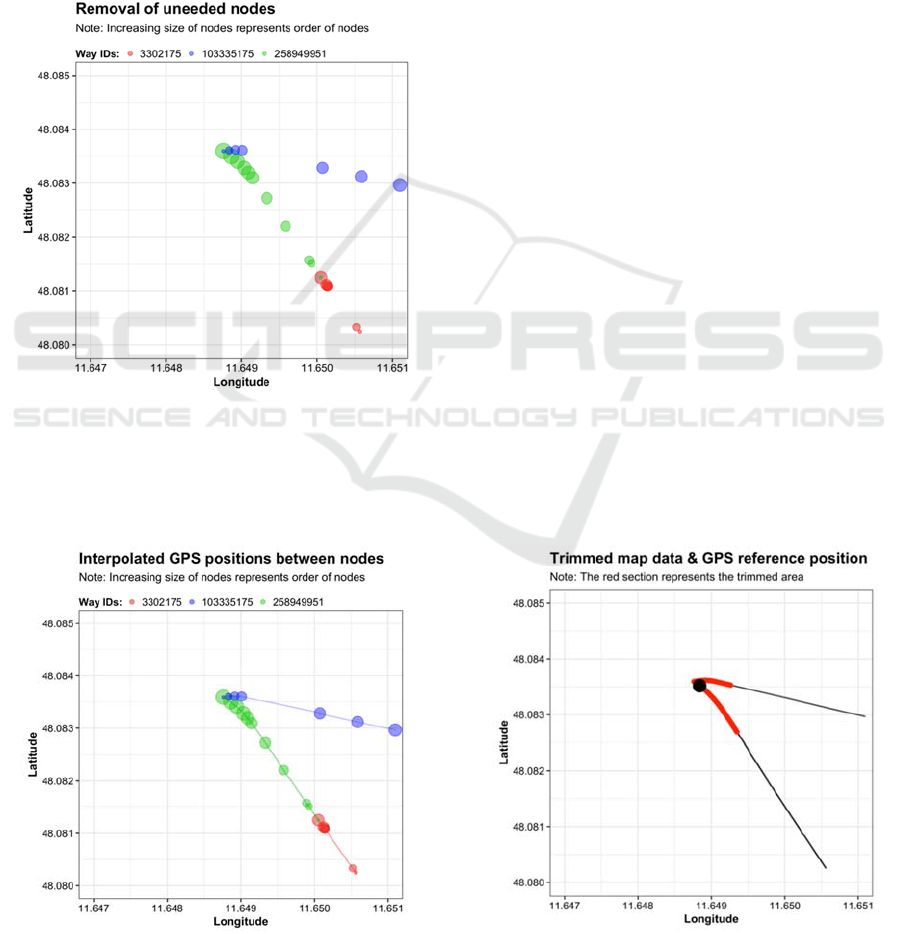
3.3.2 Removal of Unneeded Nodes
In cases of way segments that do share the same outer
nodes (as described in the last part of the previous
section), the unneeded nodes should be removed from
the segment (see Figure 5). For each pair of
succeeding way segments, this can be applied as
follows: For the first way segment, identify the node
ID that represent an interface to the second way
segment (by sharing the same node ID). If this node
is not the last node of the first way segment, all
succeeding nodes can be removed.
Figure 5: Removal of unneeded nodes.
3.3.3 Interpolating the Data
To be able to join the corrected map data with the
actual driving data, both must share the same distance
Figure 6: Interpolated GPS positions between nodes.
criteria between each record. In our analyses, we
interpolated the driving data to a representation of 0.1
m driven distance per record. We applied the same
method to the map data by calculating the distance
between the GPS coordinates of each node and
interpolated the data accordingly (see Figure 6).
3.3.4 Calculating the Distance Criteria to
GPS Reference Point
haring the same equal-distanced data basis is not
sufficient for joining the data, as map data and driving
data do not share the same reference for the distance
measure. In driving data, a driven distance criterion
can usually be calculated, for example, by means of
speed information, starting from the beginning of the
recording. Naturally, this measure does not match the
distance measures we will achieve for the processed
map data, as only a selection of way segments will be
included in the analysis. To address this issue, we
applied the same method to the map data that we
usually apply to the driving data by calculating the
distance between each GPS position of each record to
the GPS reference point. In a second step, we identify
the record that has the minimal distance to the GPS
reference point and set this record to zero. We then
create a distance measure by cumulating (repeatedly
adding or subtracting) the driven distance measure
(e.g., 0.1 m per record) for all records that lie before
and after this record. For a more detailed explanation,
see M. Graichen et al. (2018).
3.3.5 Trimming Way Segment Data
As the cumulative length of the way segments will
likely not match the section of interest for the driving
Figure 7: Trimmed map data and GPS reference position.
From Maps to Models: Computing Velocity Models for Turn Prediction Using OpenStreetMap Data
317
data, map data should be trimmed according to the
required distance measure (e.g., -100 m before and 50
m after passing the GPS reference point; see Figure
7).
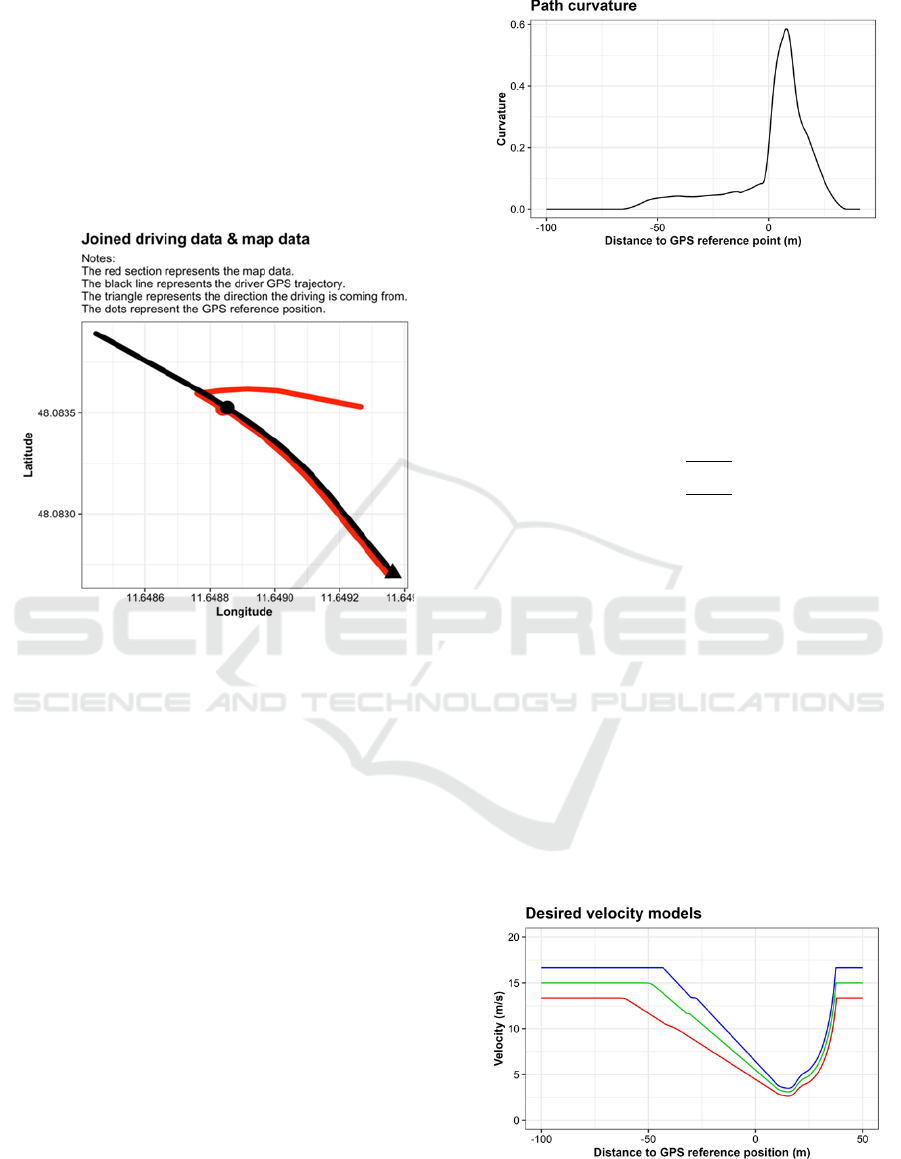
3.3.6 Joining Driving Data and Map Data
After interpolating and trimming the map data, it
should be possible to join the driving data and map
data for further analysis (see Figure 8Figure 9).
Figure 8: Joined driving data and map data.
3.4 Computing the Velocity Model
To compute the velocity model for approaching the
intersection and a potential turning maneuver, the
following steps should be performed:
Compute path curvature
Convert path curvature to velocity
3.4.1 Computing Path Curvature
For calculating the path curvature, we use the radius
of artificial circles calculated for a series of three data
points along the GPS path that were extracted from
the interpolated map data. To solve the equation and
find the center of the circle between these three
points, we applied Gaussian elimination using the R
package matlib (Michael Friendly et al., 2022).
To achieve smoother results, we chose a series of
data points that are 5 m apart from each other.
Additionally, we also applied a k-means smoothing
procedure (see Figure 9).
Figure 9: Path curvature.
3.4.2 Converting Path Curvature to Velocity
To compute the velocity model 𝑣
based on the path
curvature, we followed the method described in
Liebner et al. (2013) using different values for the
maximum lateral acceleration 𝑎
in the formula:
𝑣
𝑠
min
𝑎
𝑘
𝑠
,𝑣
(1
)
with 𝑠 being the distance measure (e.g., the
current driver position or distance to the GPS
reference point), 𝑎
the maximum lateral
acceleration, 𝑘
𝑠
the smoothed path curvature
profile and 𝑣
the maximum velocity for each profile
(e.g., the maximum permitted speed for each
individual road).
To achieve better results, we have limited the
gradient until the minimum speed is reached (see
Figure 10). To adjust for outliers, we also limited the
maximum velocity to the speed limit as provided by
the OSM data for the related way segment. Figure 10
shows three velocity models representing possible
velocity profiles during a turning maneuver at this
particular intersection (see Figure 1).
Figure 10: Desired velocity models.
VEHITS 2023 - 9th International Conference on Vehicle Technology and Intelligent Transport Systems
318

4 CONCLUSION
4.1 Summary
The present work aimed to outline a framework for
using OSM data to enrich driving data recorded in
real traffic environments. Using OSM data requires
several steps, such as identifying relevant way IDs,
downloading way data, and sorting the nodes of the
segment IDs before the data can be joined with the
driving data. Further, the importance of data
visualization has been highlighted for all pre-
processing steps.
We also presented an application scenario by
using the extracted map data for calculating a path
curvature along the way segments and converting it
into a potential velocity model that has been used in
an algorithm for predicting turn maneuvers.
4.2 Discussion
Analyzing and modeling behavioral data from driving
studies can be challenging and often entails numerous
steps of data handling, preparation, and aggregation
before the final data modeling and extraction of
results can be performed. In research papers, these
data steps are typically described only briefly due to
the natural limitation of words and intended focus on
the related research questions. Comparatively,
research papers on modeling behavioral data from
other domains, such as automotive engineering,
summarize these steps using abstract algorithmic
sequences or mathematical formulas. For early career
researchers or experts from other domains with only
limited experience in technical implementations of
complex data processing pipelines or algorithms,
these types of papers can be discouraging and prevent
further investigation.
Being able to (re-)implement these data
processing steps can be a crucial requirement to
reproduce published results, extend previous
research, or reuse analytical models for other research
purposes. Based on previous research activities, this
work presents a step-by-step guide for enriching
driving data by means of public map data and freely
available tools such as databases and open-source
programming languages. The aim of this paper was to
help readers getting started with similar projects,
particularly smaller research groups or individual
human factors researchers without access to experts
from data engineering teams. However, the presented
methods can be used in many areas of human factors
research and are easily accessible. To make the
presented methods even more efficient, future work
could focus on automating the retrieval of way ids and
corresponding map data (node information),
depending on the recorded GPS data of the driver.
REFERENCES
Beggiato, M. (2015). Changes in motivational and higher
level cognitive processes when interacting with in-
vehicle automation [Doctoral dissertation, Technische
Universität Chemnitz, Chemnitz]. WorldCat.
http://nbn-resolving.de/urn:nbn:de:bsz:ch1-qucosa-167
333
Graichen, L., Graichen, M., & Petrosjan, M. (2022). How
to Facilitate Mental Model Building and Mitigate
Overtrust Using HCXAI. In Workshop Human-
Centered Perspectives in Explainable AI. Symposium
conducted at the meeting of ACM, fully virtual.
Graichen, M. (2019). Analyse des Fahrverhaltens bei der
Annäherung an Knotenpunkte und personenspezifsiche
Vorhersage von Abbiegemanövern [Doctoral thesis].
Universität der Bundeswehr München, Neubiberg.
http://athene-forschung.rz.unibw-muenchen.de/129783
Graichen, M., & Nitsch, V. (2017). Effects of driver
characteristics and driver state on predicting turning
maneuvers in urban areas: Is there a need for
individualized parametrization? In N. A. Stanton, S. J.
Landry, G. Di Bucchianico, & A. Vallicelli (Eds.),
Advances in Intelligent Systems and Computing:
volume 484. Advances in human aspects of
transportation: Proceedings of the AHFE 2016
International Conference on Human Factors in
Transportation, July 27-31, 2016, Walt Disney
World®, Florida, USA. Springer.
Graichen, M., Nitsch, V., & Färber, B. (2018). Analysing
behavioural data from on-road driving studies:
Handling the challenges of data processing. In K.
Bengler, J. Drüke, S. Hoffmann, D. Manstetten, & A.
Neukum (Eds.), UR:BAN Human Factors in Traffic.
Approaches for Safe, Efficient and Stressfree Urban
Traffic. Springer. https://doi.org/10.1007/978-3-658-
15418-9_9
Liebner, M., Klanner, F., Baumann, M., Ruhhammer, C.,
& Stiller, C. (2013). Velocity-Based Driver Intent
Inference at Urban Intersections in the Presence of
Preceding Vehicles. IEEE Intelligent Transportation
System Magazine, 5(2), 10–21. https://doi.
org/10.1109/MITS.2013.2246291
Michael Friendly, John Fox, & Phil Chalmers. (2022).
matlib: Matrix Functions for Teaching and Learning
Linear Algebra and Multivariate Statistics.
https://github.com/friendly/matlib
Pereira, M., Lietz, H., & Beggiato, M. (2014).
Development of a database for storage and analysis of
behavioural data. In A. Stevens, C. Brusque, & J.
Krems (Eds.), Driver adaptation to information and
assistance systems (pp. 301–317). The Institution of
Engineering and Technology (IET). https://doi.
org/10.1049/PBSP009E_ch15
From Maps to Models: Computing Velocity Models for Turn Prediction Using OpenStreetMap Data
319

R Core Team. (2022). R: A Language and Environment for
Statistical Computing. https://www.R-project.org/
Wickham, H. (2022). httr: Tools for Working with URLs
and HTTP. https://CRAN.R-project.org/package=httr
Wickham, H., Hester, J., & Ooms, J. (2021). xml2: Parse
XML. https://CRAN.R-project.org/package=xml2.
VEHITS 2023 - 9th International Conference on Vehicle Technology and Intelligent Transport Systems
320
