Biodiversity, Urban Quality Life and Air Quality Indices for Hotspot
Detection of Transformation Opportunities in Cities: A Case Study in
Barcelona
Danielly Garc
´
ıa
1 a
, Mariona Ferrandiz-Rovira
2,3,4 b
, Oriol Serra
2
and M. Eul
`
alia Par
´
es
1 c
1
Centre Tecnol
`
ogic de Telecomunicacions de Catalunya (CTTC/CERCA), Av. Carl Friedrich Gauss 7, Castelldefels, Spain
2
Replantegem. Carrer Creueta 119, B-E, Sabadell, Catalonia, Spain
3
CREAF, Cerdanyola del Vall
`
es, Catalonia, Spain
4
BABVE, Universitat Aut
`
onoma de Barcelona, Cerdanyola del Vall
`
es, Catalonia, Spain
Keywords:
Biodiversity, Urban Life, Air Quality, Indicators.
Abstract:
Half of the world’s population lives in cities, where usually there are few little green space and there are also
high levels of air pollution. Moreover, the traditional urbanization of cities contributes to climate change,
promotes the loss of global biodiversity and induces serious health problems for citizens. Both climate change
and the loss of biodiversity affect negatively to the ecosystems and therefore human health, as they are respon-
sible for providing clean air, food, fresh water, medicines, renewable resources. . . This deterioration increases
significantly the risk of human-borne infectious diseases such as coronavirus or HIV. The ability we have to
re-naturalize anthropogenic spaces and learn to generate spaces for coexistence will be key for the future of
our society. The research presented in this paper aims to do a step forward to achieve that ability by working in
three schools of the city of Barcelona and their surroundings. Among other actions, in this project, a diagnosis
of neighborhood has been carried out. The diagnosis includes the identification and quantification of relevant
indicators regarding neighborhood’s biodiversity and also the quality of daily life and the analysis of pollutants
(NO
2
and PM
10
) near the schools during the 2021-2022 school year. All these information has been merged
in a single geographic data base and relevant hotspots where to act have been identified. The information has
been shared with city council and citizens.
1 INTRODUCTION
In 2020, and as a way to provide response to the crisis
situation caused by covid-19, Barcelona City Council
promoted the Scientific Research Awards for Urban
Challenges in the City of Barcelona 2020. This paper
presents the main scientific outcomes from one of the
projects awarded on that call: the project ”Rethinking
school environments”. The proposal aroused from the
need to provide solutions to the current environmental
and urban planning situation in which Barcelona finds
itself. This is a multidisciplinary project joining biol-
ogy, urban planning, and air quality, among others, to
perform a deep review of the city to make it healthier,
more pleasant, sustainable, and a space for all urban
biodiversity to live together. As a specific objective,
a
https://orcid.org/0000-0002-8191-3308
b
https://orcid.org/0000-0001-8548-2851
c
https://orcid.org/0000-0003-2459-1768
the idea was to learn about school environments in or-
der to renaturalize human spaces and learn to generate
spaces for coexistence, at all levels and for all existing
species. The aim was to provide tools that allow to re-
design cities with a mixture of uses in which a change
in mobility is possible, improve air quality, improve
urban biodiversity and fight the climate emergency.
This is how we will achieve healthier, more sustain-
able, and more pleasant cities. Studies carried out by
(Benedict W Wheeler et al., 2021; Ojala and Camp-
bell, 2020) have shown that the aspects of the city an-
alyzed in the development of this work directly affect
the life and health of the population, especially the
most vulnerable groups.
Our proposal relies on the creation of new indices,
and its join analysis to detect hotspots where to act
first in order to improve citizens quality of life from
a multidisciplinary perspective. To do that, the use
of GIS tools is of foremost importance. In this paper
208
García, D., Ferrandiz-Rovira, M., Serra, O. and Parés, M.
Biodiversity, Urban Quality Life and Air Quality Indices for Hotspot Detection of Transformation Opportunities in Cities: A Case Study in Barcelona.
DOI: 10.5220/0011974100003473
In Proceedings of the 9th International Conference on Geographical Information Systems Theor y, Applications and Management (GISTAM 2023), pages 208-215
ISBN: 978-989-758-649-1; ISSN: 2184-500X
Copyright
c
2023 by SCITEPRESS – Science and Technology Publications, Lda. Under CC license (CC BY-NC-ND 4.0)
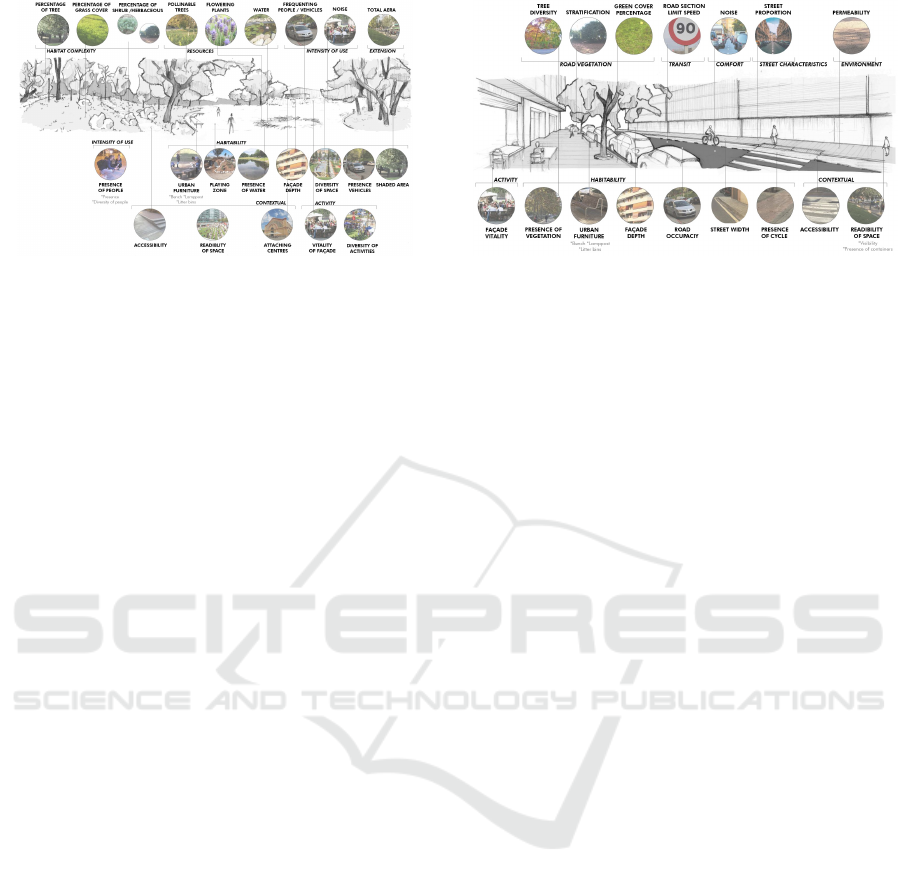
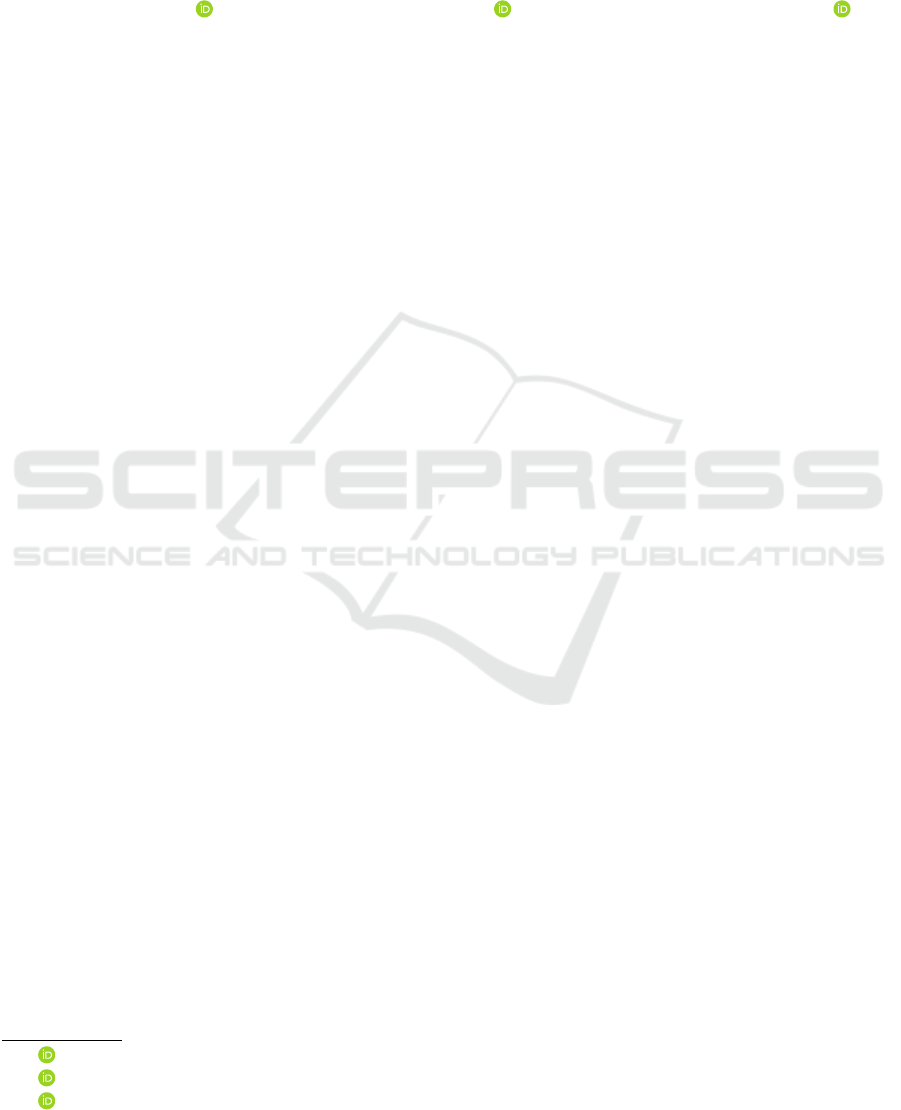
Figure 1: Graphical representation of the items analysed
for the biodiversity squares, at the top, and for the people’s
quality of daily life squares, at the bottom.
we present the methodology proposed, as well as the
analysis done in three neighborhoods of Barcelona.
2 METHODOLOGY
In this project we have defined several indices that al-
low showing citizenship the quality of life in the sur-
roundings of schools. The indices have been designed
to be easy to understand. Separate but analogous in-
dices are created for biodiversity, urban quality life
and air pollution. The joint analysis of them is what
provide information on the areas where actions should
take place.
2.1 Biodiversity
The study of biodiversity in the city distinguish be-
tween two types of infrastructure: (1) Squares; and
(2) Streets. They are considered separately since
the squares usually have an area large enough for
the species to stay there for a certain period of time
(Beninde et al., 2015; Ian MacGregor-Fors, 2011).
Streets, on the other hand, are usually passage areas
for species, although sometimes they can also be stay-
ing areas, especially for vegetation. We evaluate each
neighborhood using relevant indicators for biodiver-
sity: 11 indicators in squares and 9 in streets, see Fig-
ures 1 and 2. All indicators are then used to create an
index ranging from 0 (poor quality) to 100 (optimal
quality) obtained by properly weighting all indicators.
Once the indices are computed, and in order to test
for differences between the studied districts, two lin-
ear models are used, one for the biodiversity squares
index and one for the streets index, with districts (i.e.
different urban designs) as the independent variable.
Figure 2: Graphical representation of the items analysed for
the biodiversity of the streets, at the top, and for the people’s
quality of daily life streets, at the bottom.
2.2 Urban Life
Analogously to the study of biodiversity, we propose
two types of indices for the quality of urban life:
(1) Squares and (2) Streets. We evaluate the peo-
ple’s quality of daily life (i.e. spaces with equity for
all individuals and groups) by using 15 indicators in
squares and 11 in streets (Figures 1 and 2). Again, all
indicators are used to create an index ranging from 0
to 100 obtained by weighting all indicators, and two
linear models are used to test for differences between
the three studied districts.
2.3 Air Quality
To estimate the amount of pollutants in the air two
types of technologies are proposed: (1) Official air
quality measurement stations; (2) Sentinel-5 Precur-
sor satellite data.
2.3.1 Official Air Quality Measurement Stations
To generate the first air quality indicator, data from an
entire academic year are needed. Two pollutants are
considered here: nitrogen dioxide (NO
2
) and particu-
late matter 10 micrometers or less in diameter (PM
10
).
The official air quality reference stations has been se-
lected according to two criteria: (1) the closest to the
schools; (2) with similar environments.
Based on the reference values defined by the
WHO global air quality guidelines of 2021 (WHO,
2021), the air quality indices rely on the 24-hour av-
erage calculated for each of the pollutants and their
annual mean. Table 1 shows the WHO reference val-
ues for these contaminants.
On a first step, the annual average concentration
of pollutants in each station should be calculated to
compare the resulting value with the reference values
defined in the WHO guideline. Later on, graphs has to
Biodiversity, Urban Quality Life and Air Quality Indices for Hotspot Detection of Transformation Opportunities in Cities: A Case Study in
Barcelona
209
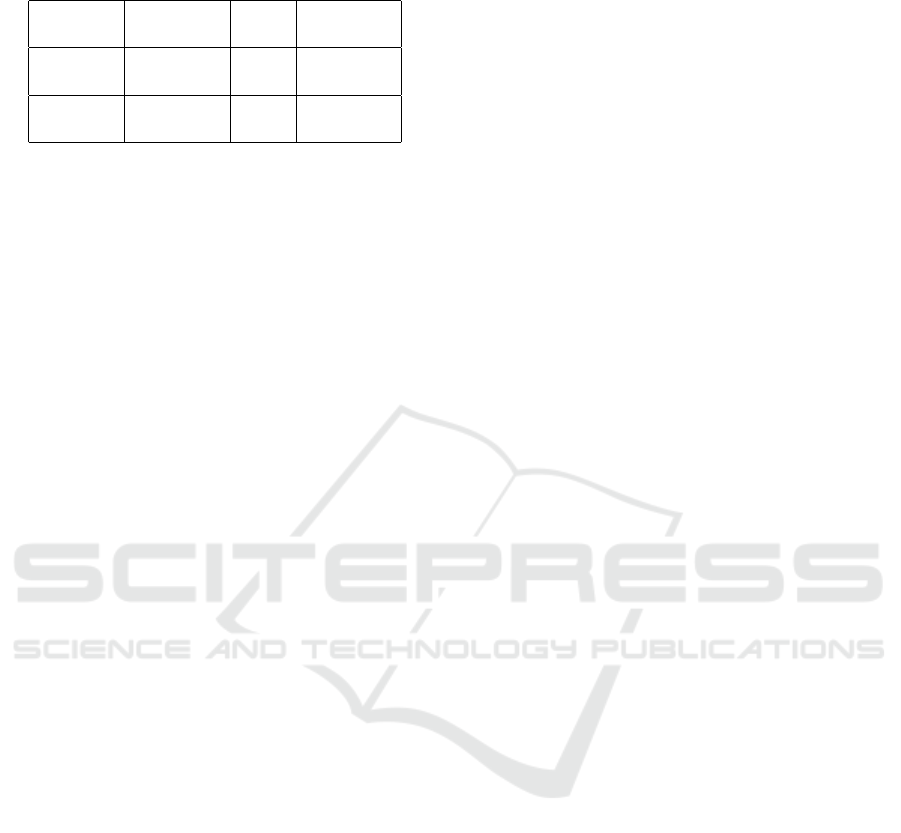
Table 1: Reference values defined in the 2021 WHO guide
for NO
2
and PM
10
pollutants.
Pollutant Averaging AQG Threshold
time level
PM
10
Annual 15 70
µg/m
3
24-hour 45
NO
2
Annual 10 40
µg/m
3
24-hour 25
be generated with the calculated averages of the con-
centration of the pollutants during 24 hours. This in-
formation allows to compare with the maximum limit
defined by the WHO during 24 hours. The indices
ranges from 0 to 100 according to: optimal air quality
for values below the limit value defined by the WHO
guidelines (100) to poor air quality for higher values
that represent more health risk (0).
2.3.2 Sentinel-5 Precursor Satellite
Sentinel-5 Precursor (S5p) is a satellite system that
provides information and services on air quality, cli-
mate and the ozone layer of our atmosphere. The
Sentinel-5p satellite, from the Copernicus Sentinel-5
Percursor mission, offers a spatial resolution of 7x7
km
2
and in Spain we have a new image every day at
approximately 12 noon. Through the Sentinel Hub
plugin installed in the QGIS program, an analysis of
the NO
2
concentration on each day of the academic
year was carried out in a simple way. The first step
is to configure Sentinel Hub according to the data
objective to be displayed in QGIS. The plugin trans-
forms any layer defined in Sentinel Hub configuration
into a QGIS layer, (Sentinel Hub, 2019). Once the
processed satellite images are directly accessed and
with the color representation previously defined in the
configuration, the plugin enables a quick exploration,
customization and image download.
Initially, a first filtering should be carried out on
the data in order to discard the images that do not
have data in the study area. Next, the resulting data
set should be analyzed by week (Monday to Sunday),
with the aim of identifying patterns in the data. The
first pattern we need to identify is whether all the
schools had the same levels of contamination or if the
one located furthest from the urban center had differ-
ent levels of contamination. The second pattern to
identify is if the days with the highest concentration
of NO
2
occur on workdays and the days with the low-
est concentrations are on weekends or holidays.
2.4 Joint Analysis
Once all the indicators are computed, for every street
or square we can analyze separately each indicator
and also we can do it jointly. The joint analysis of
the three indicators will allow us to have a better un-
derstanding of the situation (comfort, biodiversity and
air quality). The analysis of all streets and squares of
a neighborhood will allow us to detect hotspots to im-
prove inside of a neighborhood. And the comparison
of the neighborhoods as a whole, will allow us to de-
termine which neighborhood of the city need more
attention.
3 STUDY AREA AND DATA
3.1 Study Area
The project focus on three neighborhoods of
Barcelona. The selection of the three public schools
was carried out through the Consorci Escoles +
Sostenibles, which is part of a network made up
of organizations committed to environmental, social
and economic sustainability that collectively build a
responsible city with people and the environment,
(Ajuntament de Barcelona, 2022). With the aim of
analyzing the school environment taking into account
different types of urbanization and areas with differ-
ent urban fabrics. The selected schools were, Ferrer i
Gu
`
ardia (Nou Barris district - close to the Collserola
wood), Diputaci
´
o (Eixample district - dense with
wide streets and lot of cars) and Patronat Dom
`
enech
(Gracia district - pedestrian area with narrow streets).
The cartographic data base used in the delimita-
tion of the territory of Barcelona was downloaded
from the Open Data BCN portal.
3.2 Biodiversity and Quality of Urban
Life Data
The data for these indices has been obtained from the
Open Data BCN portal. Fieldwork to check the qual-
ity of the data base was performed in July 2021. The
Barcelona territory layer has been our base layer for
the insertion of the data to be analyzed. In the QGIS
program, an initial edition was made to the territory
layer, with the objective of sectioning each street sec-
tion into a polygon, see Figures 4 and 5, information
treated as urban connectors in the analyzes. Each
street section of the study area was associated with
data such as tree cover, presence of businesses, and el-
ements of interest for wildlife, among others, see Fig-
ures 1 and 2. An example of the analysis performed in
the GIS program to generate all the indexes is the cal-
culation of the percentage of trees per street section
generated from the tree cover data. It is important to
GISTAM 2023 - 9th International Conference on Geographical Information Systems Theory, Applications and Management
210
note that the processing and analysis of the data in
the QGIS program has been carried out jointly with
the WMS resources of the geoservices offered in the
GeoportalBCN.
3.3 Air Quality Data
The air quality analysis has been carried out for the
2021-2022 Barcelona’s school year. From Septem-
ber/2021 to June/2022 and in this study every day of
this period was analysed, both for the data obtained
from the surface reference stations and for the satel-
lite data.
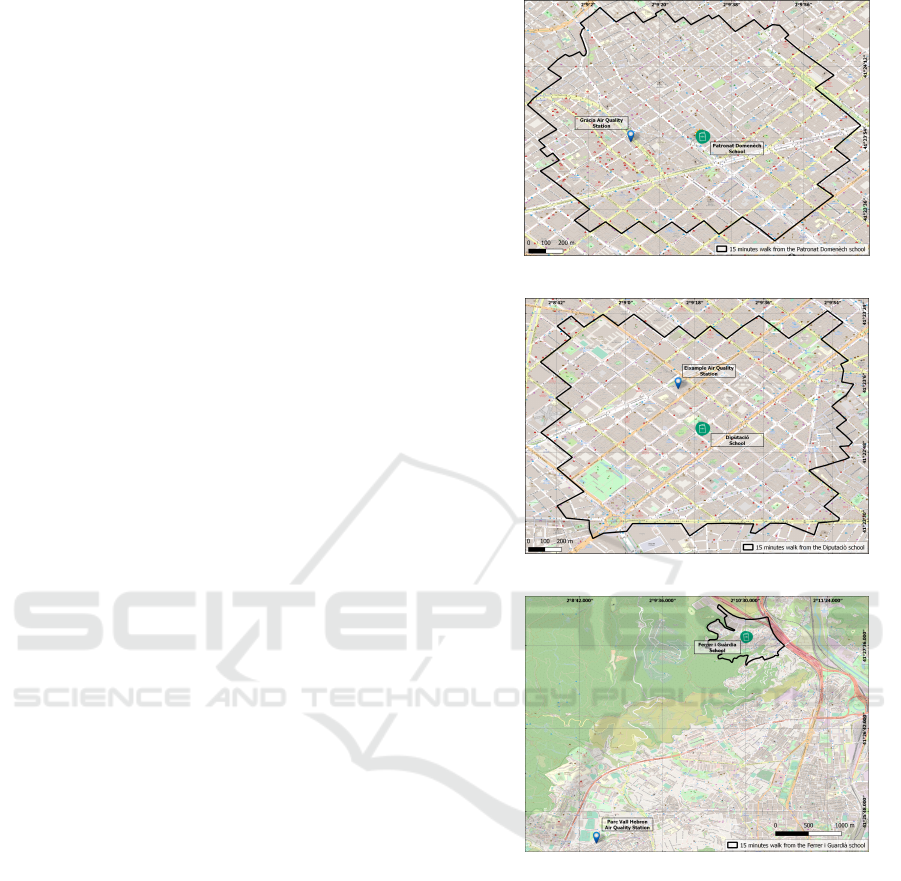
3.3.1 Surface Reference Station
The Generalitat de Catalunya monitors the air qual-
ity of the territory based on the data collected by
the Air Pollution Monitoring and Forecasting Net-
work (XVPCA). The data collected by the stations are
available on the Open Data Portal of Catalonia, with
hourly frequency, (Generalitat de Catalunya, 2014).
To define the air quality around the Diputaci
´
o, Pa-
tronat Dom
`
enech and Ferrer i Gu
`
ardia schools, daily
data on NO
2
and PM
10
pollutants have been used
for the 2021-2022 academic year from the Eixample,
Gracia and Parc Vall Hebron stations, respectively.
See Figures 3b, 3a, 3c. The Parc Vall Hebron sta-
tion is not close to Nou Barris district, however, this
is the closest station that meets the second require-
ment of having an environment similar to the school
zones studied.
3.3.2 Satellite Data
In this study, an analysis of 302 Sentinel-5p images
was performed, all corresponding to the 2021-2022
academic year. The first data filtering was done to dis-
card the images that had no information in the study
area, 206 images were discarded. The objective of
defining patterns in the data was carried out based on
the analysis of 96 images of the study area, which
would allow us to compare the results obtained with
the air quality data measured on the surface with the
patterns found based on satellite data. It is very im-
portant to note that the data from the surface stations
are measured at a height close to the pollutant emis-
sion source. Whereas, the satellite data is from the
entire air column, from the surface to the troposphere
and there is a dispersion time of the air in the column.
Thus, the values to create the indices from one sensor
and the other will never be the same.
(a) Gracia Air Quality Station.
(b) Eixample Air Quality Station.
(c) Parc Vall Hebron Air Quality Station.
Figure 3: Air Quality Stations.
4 RESULTS
This section presents the calculated indices of bio-
diversity and quality of urban life. Based on these
values, in the QGIS program, the edited layer of the
Barcelona territory was used to generate a graphical
representation of these indices, (Figures 4 and 5). For
the air quality index, the calculated averages are pre-
sented, the values measured at each station by means
of a graph (Figures 6, 7 and 8), and finally, a map of
the NO
2
concentration measured by the Sentinel-5p
satellite (Figure 9).
Biodiversity, Urban Quality Life and Air Quality Indices for Hotspot Detection of Transformation Opportunities in Cities: A Case Study in
Barcelona
211
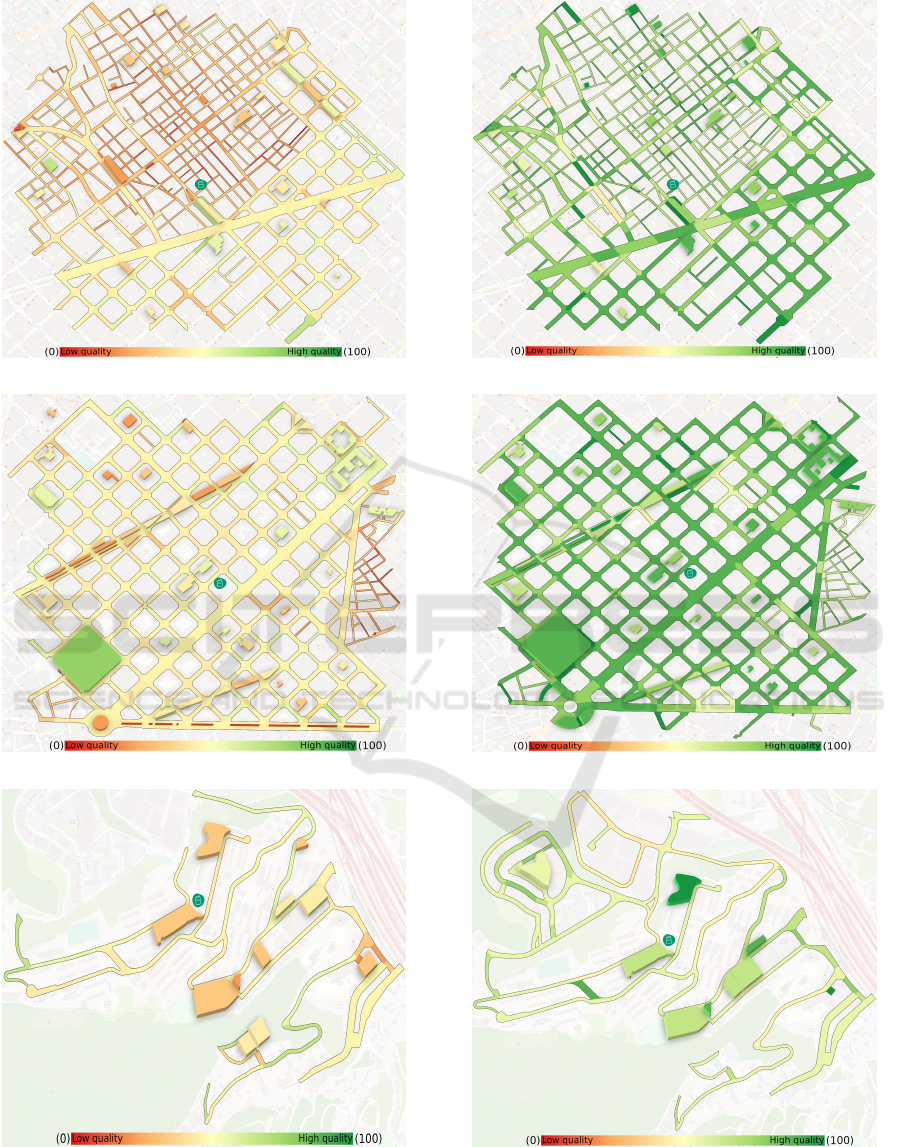
(a) Gracia.
(b) Eixample.
(c) Nou Barris.
Figure 4: Biodiversity quality of squares and streets in three
districts of Barcelona.
(a) Gracia.
(b) Eixample.
(c) Nou Barris.
Figure 5: Urban Life quality of squares and streets in three
districts of Barcelona.
GISTAM 2023 - 9th International Conference on Geographical Information Systems Theory, Applications and Management
212
4.1 Biodiversity
Regarding the biodiversity square index, a mean of
38.16 for the three neighborhoods was obtained (SD:
11.45, range: 13-72) (see Table 2 for extended details
and Figure 4). Using the analysis of variance (Girden,
1992), surprisingly, no significant differences were
found between the three districts studied (Gracia’s Es-
timate ± SE, p: -6.03 ± 2.96, 0.045; Nou Barris -4.18
± 3.62, 0.69; ANOVA p= 0.10; N = 78). In the case of
streets, a mean of 38.52 for the three neighborhoods
was obtained (SD: 12.09, range: 6-69) (see Table 3
and Figure 4). As expected, significant differences
were found between districts (Gracia’s Estimate ± SE,
p: 9.65 ± 4.98, 0.053; Nou Barris 64.03 ± 7.51, <
0.0001; ANOVA p < 0.0001; N= 1,196).
Table 2: Biodiversity indices for squares.
Gracia Eixample Nou Barris
Items analysed 19 60 13
Min index val 13 13 29
Max index val 63 72 47
Mean index val 35.26 39.17 37.6
Table 3: Biodiversity indices for streets.
Gracia Eixample Nou Barris
Items analysed 590 589 75
Min index val 6 7 26
Max index val 63 67 69
Mean index val 30.46 45.50 45.50
4.2 Quality of Urban Life
Regarding the quality of people’s daily life indices,
a mean of 78.7 for the three neighborhoods was ob-
tained (SD: 11.83, range: 51-99) (see Table 4 for ex-
tended details and Figure 5) in the case of squares and
a mean of 75.08 (SD: 9.91, range: 36-94) (see Ta-
ble 5 for extended details and Figure 5) in the case of
streets. The obtained results were higher in both cases
than the results obtained for the biodiversity squares
and streets indices. Surprisingly, no significant dif-
ferences were found for the quality of people’s daily
life squares (Gracia’s Estimate ± SE, p: 3.40 ± 3.41,
0.32; Nou Barris -0.40 ± 4.20, 0.92; ANOVA p= 0.58;
N= 82), while significant differences were found for
the streets (Gracia’s Estimate ± SE, p: -6.57 ± 0.50, <
Table 4: Urban life indices for squares.
Gracia Eixample Nou Barris
Items analysed 17 52 13
Min index val 57 55 60
Max index val 91 97 97
Mean index val 78.47 75.73 75.70
Table 5: Urban life indices for streets.
Gracia Eixample Nou Barris
Items analysed 590 589 75
Min index val 49 47 40
Max index val 100 98 92
Mean index val 78.53 84.13 62.05
0.0001; Nou Barris -19.98 ± 1.04, < 0.0001; ANOVA
p < 0.0001; N= 1254).
4.3 Air Quality
According to the analyzes carried out, the environ-
ments of the three schools have poor air quality. This
indicator was defined based on surface and satellite
air quality data.
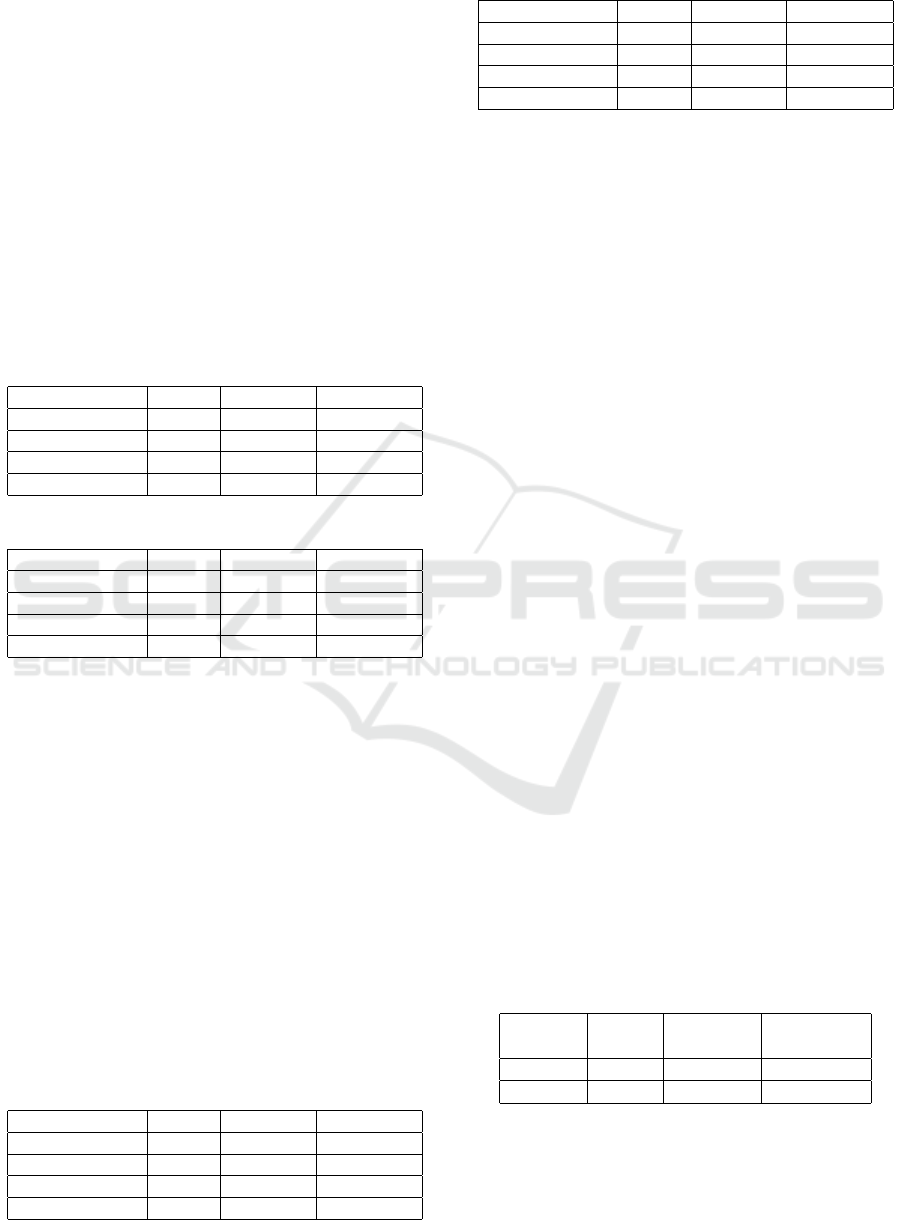
4.3.1 Official Air Quality Measurement Stations
Firstly, it has been verified that during the week, the
day with the highest concentration of polluting gases
is predominantly a workdays, while the days with the
lowest concentrations take place on weekends or holi-
days. Second, the time series for the three study areas
have been generated from the calculation of the daily
average of pollution and compared with the maximum
daily proposed levels defined by the WHO in the 2021
guide, presented in Table 1. Annual mean is also com-
puted (Table 6) and can be compared against refer-
ence values (Table 1). The values are clearly above
the ideal ones.
In the three neighborhoods during the 2021-2022
scholar course (Eixample and Gracia: almost all
days; Nou Barris: half of the days) the NO
2
Daily
thresholds (25 µg/m
3
) have been exceed (see Fig-
ures 6a, 7a and 8a). The NO
2
annual means are also
above WHO recommendations. Special attention to
the Eixample station, which exceeds not only the
recommended value but also the maximum threshold.
Regarding PM
10
, daily thresholds (45 µg/m
3
) have
been exceed in two neighborhoods during the 2021-
2022 scholar course (Eixample: 10 days; Gracia: 1
day; Nou Barris: 0 days)(see Figures 6b, 7b and 8b).
Table 6: Average air quality in the 2021-2022 academic
year.
Annual Gracia Eixample Nou Barris
(µg/m
3
)
NO
2
36.35 45.15 24.32
PM
10
21.78 30.80 17.05
4.3.2 Sentinel-5 Percursor Satellite Data
Analyzing the Sentinel-5p satellite images of the en-
tire study period, it has been possible to verify that the
Biodiversity, Urban Quality Life and Air Quality Indices for Hotspot Detection of Transformation Opportunities in Cities: A Case Study in
Barcelona
213
(a) NO
2
. (b) PM
10
.
Figure 6: Graphs of NO
2
and PM
10
at Gracia station during the period from September/2021 to June/2022.
(a) NO
2
. (b) PM
10
.
Figure 7: Graphs of NO
2
and PM
10
at Eixample station during the period from September/2021 to June/2022.
(a) NO
2
. (b) PM
10
.
Figure 8: Graphs of NO
2
and PM
10
at Parc Vall Hebron station during the period from September/2021 to June/2022.
(a) Workday - Thursday. (b) Weekend - Sunday.
Figure 9: Comparison between two images from the S5p satellite, from a weekday and from a weekend of the same week.
GISTAM 2023 - 9th International Conference on Geographical Information Systems Theory, Applications and Management
214

same pattern is seen as with the data from the official
surface stations. Separating the data as weekly sets
(Monday to Sunday), predominantly, the day with
the highest NO
2
concentration occurs on workdays
and the days with the lowest concentrations occur on
weekends or holidays. Figure 9 shows a comparison
between two images from the S5p satellite, Figure 9a
from a workday and Figure 9b from a weekend day of
the same week. In the comparison presented in Fig-
ure 9, it is easy to see that, in the same week, the con-
centration of NO
2
changes significantly according to
the activities carried out by the majority of the city’s
inhabitants.
4.4 Joint Discussion
This study highlights the poor quality of green infras-
tructure and air quality in three districts of Barcelona.
This may be because squares and streets are designed
for humans and vehicles rather than for biodiversity
and health. In fact, considerably better results have
been obtained for human daily quality of life than for
biodiversity and health. Regarding street usages, the
ones with more traffic (Eixample) are the ones pol-
luted and with less biodiversity.
5 CONCLUSIONS
The proposed joint approach enable us to detect
hotspots where transformations to enhance biodiver-
sity, people’s quality of daily life as a whole and
health are needed. Regarding the biodiversity and
urban life methodologies the indices generated are a
promising tool, specially for urban planning in this
sustainability context. Next steps on this area will be
to compare the results with citizens perceptions and to
improve indices calculations taking into account this
issue. Regarding the air quality proposed methodol-
ogy, it is important to note that the way we use Sen-
tinel data is not the most suitable for a complete anal-
ysis of air quality data from satellites. However, when
considering the processing time and the volume that
these data can reach, it is a recommendable methodol-
ogy for initial analysis, for more visual than quantita-
tive representations and to easily and accurately filter
the images that can be used in the study. Concerning
the location of air measurement stations, this model
does not allow to evaluate the air quality in different
streets of a neighborhood, a useful assessment to de-
termine, for example, how the implementation of a
pedestrian street reduces the emission of pollutants in
this Street.
ACKNOWLEDGEMENTS
This study was co-funded by the Barcelona City
Council’s “Fons COVID” scientific research awards
given to Mariona Ferrandiz-Rovira and AGAUR,
Generalitat de Catalunya, through the Consolidated
Research Group “Geomatics” (Ref: 2021-SGR-
00536). We warmly thank Jordi Noya and Dani
Rodr
´
ıguez for their fieldwork and processing data as
well as Laia Llonch, Marc Deu and Cristina Terraza
for their helpful discussions about the project.
REFERENCES
Ajuntament de Barcelona (2022). Memoria escoles +
sostenibles curs 2021-22. https://www.barcelona.cat/
barcelonasostenible/sites/default/files/memoria\textu
nderscore21\textunderscore22\textunderscorees.pdf.
Accessed: 2023-01-17.
Benedict W Wheeler, Becca Lovell, L. E. F., Emma Bland,
M. B., and Netanyahu, S. (2021). Nature, biodiversity
and health: An overview of interconnections. Tech-
nical Report CC BY-NC-SA 3.0 IGO, WHO Regional
Office for Europe, Copenhagen, Denmark.
Beninde, J., Veith, M., and Hochkirch, A. (2015). Biodiver-
sity in cities needs space: a meta-analysis of factors
determining intra-urban biodiversity variation. Ecol-
ogy Letters, 18(6):581–592.
Generalitat de Catalunya (2014). Xarxa de vigil
`
ancia i pre-
visi
´
o de la contaminaci
´
o atmosf
`
erica (xvpca). https:
//mediambient.gencat.cat/ca/05\textunderscoreambit
s\textunderscoredactuacio/atmosfera/qualitat\ textu
nderscorede\textunderscorelaire/avaluacio/xarxa\te
xtunderscorede\textunderscorevigilan-cia\textunder
scorei\textunderscoreprevisio\textunderscorede\tex
tunderscorela\textunderscorecontaminacio\textund
erscoreatmosferica\textunderscorexvpca/. Accessed:
2023-01-18.
Girden, E. R. (1992). ANOVA: Repeated measures. Num-
ber 84. Sage.
Ian MacGregor-Fors, J. E. S. (2011). Gray vs. green ur-
banization: Relative importance of urban features for
urban bird communities. Basic and Applied Ecology,
12(4):572–381.
Ojala, T. and Campbell, I. (2020). Nature, biodiversity and
health: An overview of interconnections. Technical
report, Sweco Urban Insight, Stockholm, Sweden.
Sentinel Hub (2019). Cloud api for satellite imagery get
started. https://www.sentinel-hub.com/docs/Sentinel
\textunderscoreHUB\textunderscoreBrochure\text
underscore2019\textunderscoreNEW.pdf. Accessed:
2023-01-17.
WHO (2021). Who global air quality guidelines. particu-
late matter (pm2.5 and pm10), ozone, nitrogen diox-
ide, sulfur dioxide and carbon monoxide. Technical
Report CC BY-NC-SA 3.0 IGO, World Health Orga-
nization, Geneva, Switzerland.
Biodiversity, Urban Quality Life and Air Quality Indices for Hotspot Detection of Transformation Opportunities in Cities: A Case Study in
Barcelona
215
