
Using Deep Learning and Radar Backscatter for Mapping River
Water Surface
Diana Orlandi
1
, Federico A. Galatolo
1
, Mario C. G. A. Cimino
1
, Carolina Pagli
2
, Nicola Perilli
3
,
Joao A. Pompeu
4
and Itxaso Ruiz
4
1
Dept. of Information Engineering, University of Pisa, Italy
2
Dept. of Earth Science, University of Pisa, Italy
3
Dept. of Civil and Industrial Engineering, University of Pisa, Italy
4
BC3, Basque Centre for Climate Change, Leioa, Spain
{itxaso.ruiz, joao.pompeu}@bc3research.org
Keywords: Hydrological Remote Sensing, River Water Surface Mapping, Radar Backscatter, Convolutional Neural
Network, Attention.
Abstract: In the last decades, the effects of global warming combined with growing anthropogenic activities have caused
a mismatch in the water supply-demand, resulting in a negative impact on numerous Mediterranean rivers
regime and on the functionality of related ecosystem services. Thus, for water management and mitigation of
the potential hazards, it is fundamental to efficiently map areal extents of river water surface. Synthetic
Aperture Radar (SAR) is one of the satellite technologies applied for hydrological studies, but it has a spatial
resolution which is limited for the study of rivers. On the other side, deep learning technology exhibits a high
modelling potential with low spatial resolution data. In this paper, a method based on convolutional neural
networks is applied to the SAR backscatter coefficient for detecting river water surface. Our experimental
study focuses on the lower reach of Mijares river (Eastern Spain), covering a period from Apr 2019 to Sept
2022. Results suggest that radar backscattering has high potential in modelling water river trends, contributing
to the monitoring of the effects of climate change and impacts on related ecosystem services. To assess the
effectiveness of the method, the output has been validated with the Normalized Difference Water Index
(NDWI).
1 INTRODUCTION
In hydrology, the ability to regularly assess the river
water surface is of utmost importance for several
purposes: water accountability, water allocation,
flooding mitigation, and the reinforcement of the
ecosystem services. In the literature, satellite based
remote sensing has been used to monitor the areal
extent of surface water bodies (Frappart et al., 2021;
Botha et al., 2020). Most of the research focuses on
studying flooding events (Carreño-Conde et al.,
2019; Quiròs and Gagnon, 2022; Tran et al., 2022),
while the monitoring of the areal extent of river water
surface is a more complex task, with fewer studies
(Filippucci et al., 2022). Specifically, remote sensing
data include different technologies, ranging from
radar to multispectral. Radar data is not affected by
weather conditions (e.g. clouds) while it is by
vegetation. In particular, this is relevant for the
monitoring of the extents of water in narrow river,
given the limited number of water pixels. In contrast,
the spatial resolution provided by multispectral
satellites, especially for optical bands (such as
Sentinel-2 used in this study), is higher than
resolution of Sentinel-1 SAR data. For this reason, the
Synthetic Aperture Radar (SAR) is less used to map
the extent of river water surface respect to the optical
data.
On the other hand, there is a high potential in deep
learning technology for its capabilities of mapping
and image features identification (Ronneberger et al.,
2015), also applied to SAR data under low resolution
conditions (Jiang et al., 2022; Orlandi et al., 2022).
Specifically, the U-Net convolutional neural network
has been recently experimented for the mapping of
the extent of lake water surface. U-Net carries out the
semantic segmentation task, partitioning the image
into different regions, for corresponding classes (e.g.
216
Orlandi, D., Galatolo, F., Cimino, M., Pagli, C., Perilli, N., Pompeu, J. and Ruiz, I.
Using Deep Learning and Radar Backscatter for Mapping River Water Surface.
DOI: 10.5220/0011975000003473
In Proceedings of the 9th International Conference on Geographical Information Systems Theory, Applications and Management (GISTAM 2023), pages 216-221
ISBN: 978-989-758-649-1; ISSN: 2184-500X
Copyright
c
2023 by SCITEPRESS – Science and Technology Publications, Lda. Under CC license (CC BY-NC-ND 4.0)

surface water, vegetation, and so on) (Ronneberger et
al., 2015). In the context of image segmentation, U-
Net is equipped with a spatial attention mechanism,
to highlight only the relevant parts of the image
during training. As a result, the computational
resources on the irrelevant part of the image are low,
with better generalisation capability.
In this paper, a U-Net architecture is used on the
radar backscatter coefficient with the purpose of
efficiently identifying and mapping areal extents of
river water surface. Satellite multispectral data are
used for validating the method. The paper is
structured as follows. Section 2 discusses the case
study, i.e., the area and the data sets achieved. Section
3 covers the overall methods in terms of Multispectral
data pre-processing, SAR data pre-processing, and U-
Net segmentation. Experimental results are discussed
in Section 4. Finally, Section 4 draws also the
conclusions.
2 CASE STUDY
2.1 Study Area
The study area (Figure 1) focuses on the last 20 km of
the Mijares river in Eastern Spain (Pompeu et al.,
2021). Along the river path there are the Arenoso (93
Mm
3
), Sichar (49 Mm
3
) and Maria Cristina (18.4
hm
3
) reservoirs, which support the agricultural needs
and guarantee the water supply to the Sichar dam (0.2
Mm
3
) downstream (Macian-Sorribes et al., 2015). In
the lower reach of the Mijares river (Figure 1), the
alluvial plain is characterized by meandering
sequence of fine to coarse sediments, which grade to
deltaic successions in the Almazora and Buriana
plains. In the last decades, the region has experienced
hotter seasons, a concentration of the total annual
rainfall (MedECC, 2020), and an overall decrease of
precipitation in the period 1980-2012 with respect to
the period 1940-2012 in 3-7%. Overall, the area has
available water resources of 335.7 hm
3
/year and a
water demands of 268.23 hm
3
/year (Confederación
Hidrográfica del Júcar, 2019). There are records
historically significant torrential floods that could not
be correctly gauged, which are only expected to rise
given the increasingly unstable weather patterns
forecasted for the watershed (Masson-Delmotte et al.,
2021).
2.2 Datasets
Our data sets consist of images acquired by Sentinel-
2 and Sentinel-1A satellites, provided by the
European Space Agency (ESA). Sentinel-2 is a
Multispectral satellite, acquiring images in 13 bands.
For this work, we used 36 Level-1C images (Table 1)
covering a period from October 2019 to August 2022,
considering all the 13 bands but also selecting
particular bands, such as B3 and B8 (visible and near-
infrared, respectively) to build a river mask. Sentinel-
1A is a SAR satellite operating in the C-band. We
used 104 Single Look Complex (SLC) images,
acquired in Descending orbit and in Interferometric
Wide swath beam mode (Table 1), covering the time
period from April 2019 to September 2022.
Table 1: SAR and Multispectral datasets.
Satellite Sentinel-1A Sentinel-2
Product Level Single Look
Complex (SLC)
Multispectral
Instrument (MSI) -
Level-1C
Tiles - T31TBE, T30TY
K
Spatial
Resolution
(
m
)
20 × 20 10 × 10
Orbit Descending (path
8, frame 458
)
-
Acquisition
mode
Interferometric
Wide swath (IW)
-
Revisit time 12 days -
Polarization VV -
3 METHODS
3.1 Multispectral Images
Pre-Processing
To identify the areal extent of the river water surface
the NDWI is computed, i.e., a satellite-derived index
utilizing visible and near-infrared wavelengths not
affected by meteorological conditions (e.g. Tran et
al., 2022). Specifically, NDWI has been computed on
36 Sentinel-2 images, using band 3 (visible) and 8
(near-infrared) through the following formula:
𝑁𝐷𝑊𝐼 =
𝐵3 − 𝐵8
𝐵3 + 𝐵8
(1
)
Then, based on the NDWI, a polygon of the areal
extent of the water has been created for each image.
This process has been also validated by comparing
each polygon to all the 13 bands in the image. Thus,
the final Water Surface Mask (WSM) has been
created by comparing the 36 different water polygons
generated. As a final step, in order to give to the U-
Net architecture some validation multispectral maps
to train the network, the 36 different NDWI maps
have been translated into binary images. Each pixel
Using Deep Learning and Radar Backscatter for Mapping River Water Surface
217

Figure 1: Study area (red rectangle) and river drainage network.
of a binary image is set to 0 outside the WSM, and 1
to mark the presence of water within the final WSM,
where the selection of the threshold water/non-water
set to -0.1 (Figure 2) has been validated comparing
with all the bands of the Multispectral images. The
column on the right in Figure 2 shows the flow chart.
Figure 2: SAR (left) and Multispectral (right) data pre-
processing.
3.2 SAR Images Pre-processing
A series of 104 SAR images have been processed to
obtain the backscatter coefficient from the raw radar
images. Figure 2 left shows the workflow. First, the
thermal noise removal has been applied, choosing the
VV (Vertical-Vertical) polarization. This option was
preferred, instead of VH polarization. Indeed,
differently from other works focused on floodings
events (Carreño-Conde et al., 2019; Tran et al.,
2022), in this research the general scarce presence of
water requires a stronger backscatter value provided
by VV polarization. The following step was the
radiometric calibration. To achieve a radiometrically
calibrated backscatter, σ is set to 0, from the
amplitudes stored in the SLC image. Subsequently,
the azimuth debursting is carried out to merge all
bursts using the TOPSAR-Deburst method, followed
by the Multilook step with a window size of 1×1 in
Range and Azimuth, respectively. Figure 3 shows
three different filters that have been tested to remove
the remaining speckle: Lee, IDAN and Lee Sigma.
Differently from other works (e.g. Carreño-Conde et
al., 2019), in this study, in terms of accuracy and
better visual estimation of the presence of water, the
Lee Sigma filter gives the best results, compared to
both Lee which appears noisier and to IDAN that
provides less details. Then, the image is projected
from Slant Range onto Ground Range (SRGR).
Finally, the Terrain-Correction geocoding has been
applied using the Digital Elevation Model of the
NASA Shuttle Radar Topography Mission 1 arcsec of
30 m spatial resolution.
3.3 SAR Image Semantic Segmentation
Overall, the task of detecting the river water surface
GISTAM 2023 - 9th International Conference on Geographical Information Systems Theory, Applications and Management
218
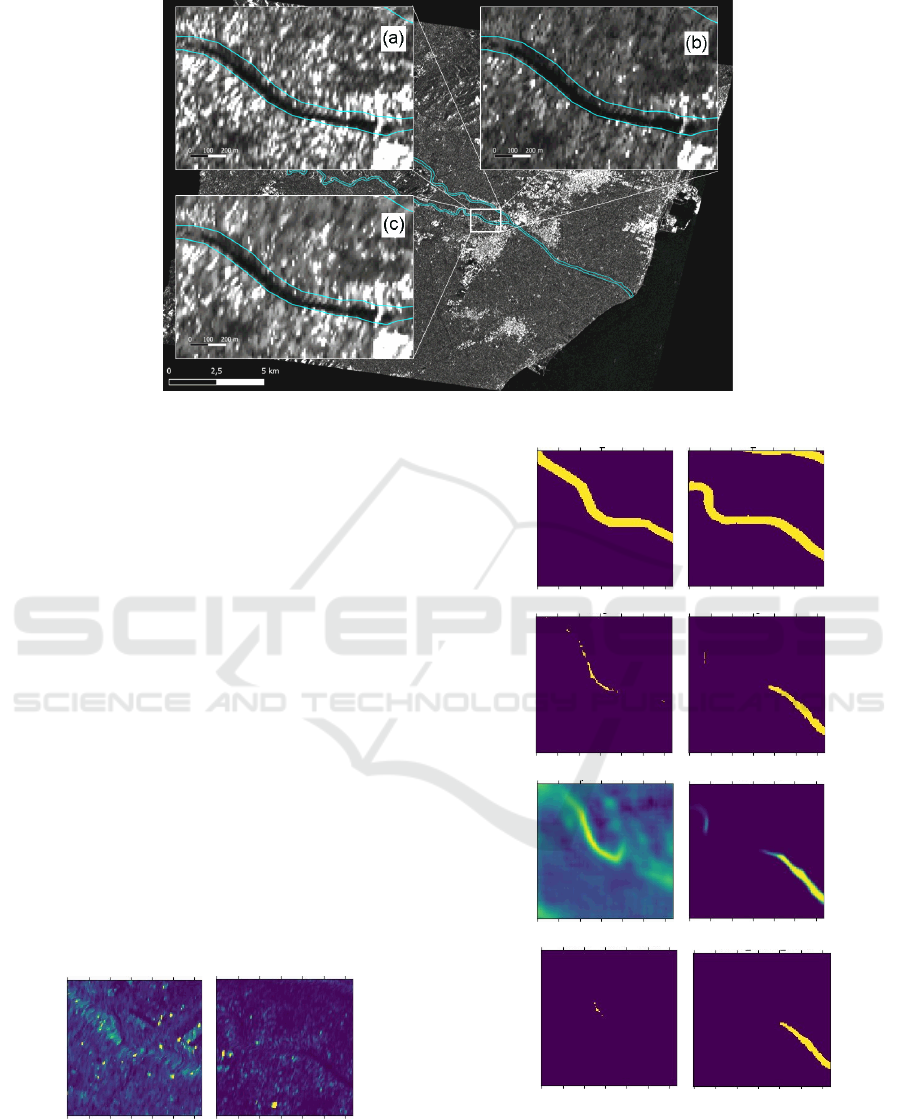
Figure 3: Speckle-Filters, Lee (a), IDAN (b), Lee Sigma (c).
is tackled as a SAR image segmentation task.
Specifically, a 128×128-pixel SAR image is
considered as an input. A particular Convolutional
Neural Network, known as U-Net (Ronneberger et
al., 2015) is used for the SAR image segmentation
task. A U-Net consists of a contracting and an
expanding path, to capture context and precise
localization, respectively. A U-Net can be trained
from very few images, outperforming the other
approaches (Qin et al., 2020).
Figure 4 shows two examples of image
segmentation, after 100 training iterations (images a-
e), and after 30,000 training iterations (f-j) of the U-
Net. Specifically, image (a) and (f) are two examples
of raw input. Second, the known WSM has been used
to filter the initial raw input (b and g). Third, the
reference truth data (c) and (h) are derived from the
Multispectral images. Fourth, images (d) and (i) show
the output provided by the U-Net. Finally, images (e)
and (j) represent the binarized water/non-water
outputs: pixel values larger or equal than 0.5 are set
to 1, otherwise they are set to 0.
(a) (f)
(b) (g)
(c) (h)
(d) (i)
(e) (j)
Figure 4: Samples after 100 training iterations (a-e), and
after 30,000 training iterations (f-j); raw input (a,f); water
surface mask (b,g); multispectral bands (c,h); raw output
(d,i); discretized output (e,j).
Using Deep Learning and Radar Backscatter for Mapping River Water Surface
219
4 RESULTS AND DISCUSSION
To carry out the proposed research, we have used an
open-source implementation of the U-Net (Wang,
2023). The generated source code has been made
publicly available (Galatolo, 2023). Table 2 shows
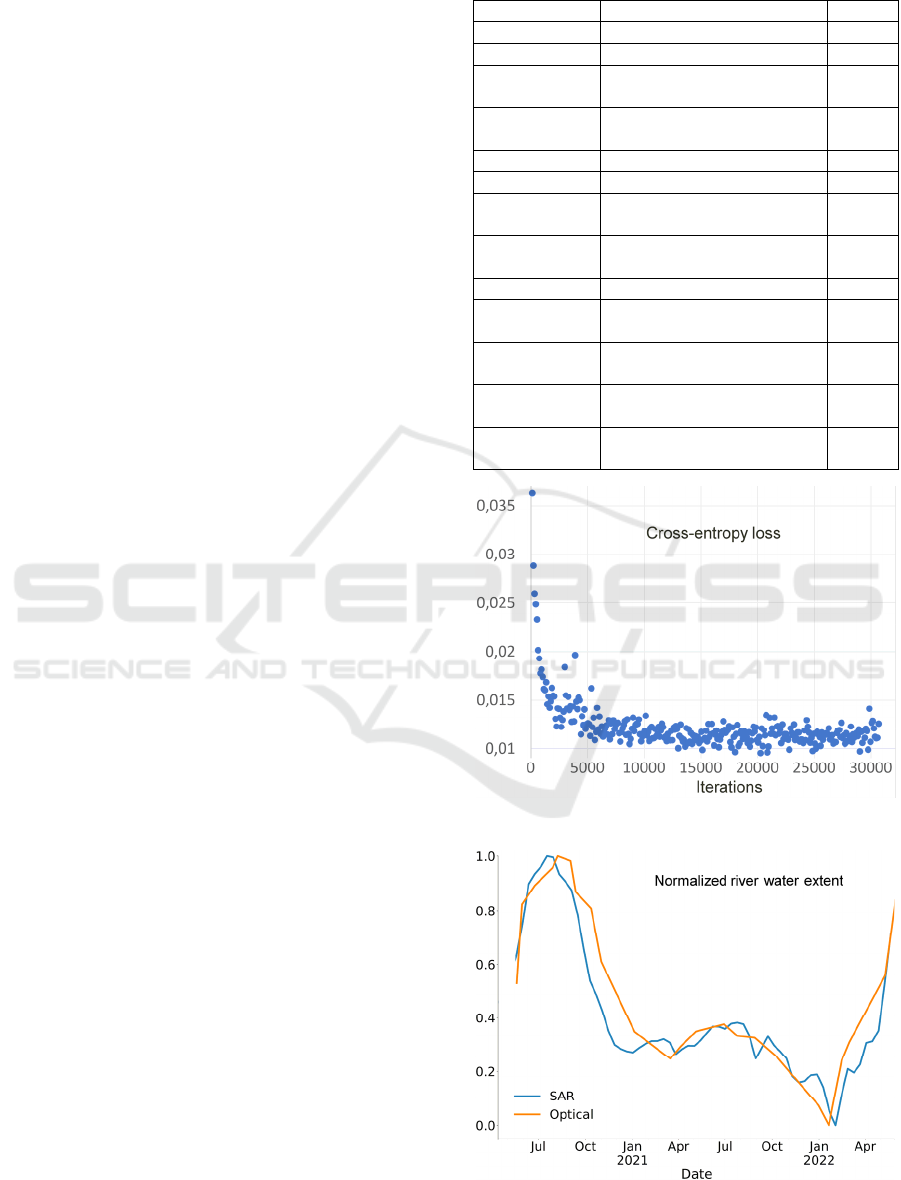
the U-Net hyperparameters settings, achieved via grid
search. Figure 5 shows the cross-entropy loss against
the iterations. In this image, it can be read that after
computing 6000 iterations the system achieves good
performances, about 0.013. Figure 6 shows the
outputs of the U-Net, one performed on the SAR
images and the other one obtained with Multispectral
images, both representing the area in the image
covered by the water, hereafter called as the
“Normalized River Water Extent (NRWE)”. The
results obtained using SAR and optical images are
promising. Indeed, there is a good similarity between
SAR outputs and Optical water masks (Figure 4).
Moreover, it can also be appreciated a similar
seasonal trend in the NRWE over time. Finally, the
Mean Absolute Error (MAE) between the SAR-based
NRWE and Optical- based NRWE is 0.072.
5 CONCLUSIONS
In this paper we analysed the Mijares river (Eastern
Spain) from April 2019 to September 2022. In
particular, we focused on its lower reach that can be
considered a challenging task given that this area is
often drought prone and it has little detectable water
for the most part of the year, yet it registers recurring
floods. Differently from the majority of case studies
in the literature using remote sensing to map flooding,
wide rivers and large water surfaces, here we used a
Convolutional Neural Network for detecting river
water surfaces from SAR data, using Multispectral
data as a ground truth. Specifically, a data pipeline for
satellite data pre-processing is first presented, and
then the U-Net architecture is parameterized and
trained. The adopted approach, which provided
promising early experimental results in the river
water surfaces detection through radar backscatter,
can be considered as a first step to further investigate
the same satellite data sets over a longer period, with
the final aim of monitoring the temporal variations
and the effects of the climate change in a fragile
ecosystem such as rivers. Lastly, to encourage
scientific collaborations, the source code used for this
work has been made publicly available (Galatolo,
2023).
Table 2: U-Net hyperparameters settings.
Paramete
r
Descri
p
tion Value
(
s
)
di
m
no. initial channels 8
dim mults no. channels multi
p
liers [1, 2, 4]
blocks per stage no. convolutional
o
p
erations
p
er sta
g
e
[2, 2, 2]
self-attentions
p
er stage
no. self-attention blocks per
stage
[0, 0, 1]
channels input channels 1
resnet
g
rou
p
s no. normalization
g
rou
p
s 2
consolidate
upsample fmaps
feature maps consolidation true
weight
standardize
weight standardization false
attention heads no. attention heads 2
attention dim
hea
d
size of attention head 16
training
window size
window size of training
sam
p
les
128
training batch
size
no. of samples per iteration 32
learning rate amount of weight change in
res
p
onse to the erro
r
0.001
Figure 5: Cross-entropy loss against iterations.
Figure 6: Normalized River Water Extent.
GISTAM 2023 - 9th International Conference on Geographical Information Systems Theory, Applications and Management
220

ACKNOWLEDGEMENTS
This work has been partially supported by: (i) the
National Center for Sustainable Mobility
MOST/Spoke10, funded by the Italian Ministry of
University and Research, in the framework of the
National Recovery and Resilience Plan; (ii) the
PRA_2022_101 project “Decision Support Systems
for territorial networks for managing ecosystem
services”, funded by the University of Pisa; (iii) the
Ministry of University and Research (MUR) as part
of the PON 2014-2020 “Research and Innovation"
resources – Green/Innovation Action – DM MUR
1061/2022"; (iv) the Italian Ministry of University
and Research (MUR), in the framework of the
"Reasoning" project, PRIN 2020 LS Programme,
Project number 2493 04-11-2021; (v) the Italian
Ministry of Education and Research (MIUR) in the
framework of the FoReLab project (Departments of
Excellence).
REFERENCES
Botha, E. J., Anstee, J. M., Sagar, S., Lehmann, E.,
Medeiros, T. A. (2020). Classification of Australian
waterbodies across a wide range of optical water types.
Remote Sensing, 12(18), 3018.
Carreño-Conde, F., & De Mata Muñoz, M. (2019). Flood
monitoring based on the study of Sentinel-1 SAR
images: The Ebro River case study. Water, 11(12),
2454.
Confederación Hidrográfica del Júcar. (2019). Plan
Hidrológico de la Demarcación Hidrográfica del Júcar.
Revisión de tercer ciclo (2021-2027). https://www.chj.
es/es-es/medioambiente/planificacionhidrologica/Pagi
nas/ PHC-2021-2027-Indice.aspx
Filippucci, P., Brocca, L., Bonafoni, S., Saltalippi, C.,
Wagner, W., & Tarpanelli, A. (2022). Sentinel-2 high-
resolution data for river discharge monitoring. Remote
Sensing of Environment, 281, 113255.
Frappart, F., Zeiger, P., Betbeder, J., Gond, V., Bellot, R.,
Baghdadi, N., et al. (2021). Automatic detection of
inland water bodies along altimetry tracks for
estimating surface water storage variations in the
Congo Basin. Remote Sensing, 13(19), 3804.
Galatolo F. (2023), GitHub repository, Gistam203,
https://github.com/galatolofederico/gistam2023.
Jiang, C., Zhang, H., Wang, C., Ge, J., & Wu, F. (2022).
Water Surface Mapping from Sentinel-1 Imagery
Based on Attention-UNet3+: A Case Study of Poyang
Lake Region. Remote Sensing, 14(19), 4708.
Macian-Sorribes H., Pulido-Velazquez M., and Tilmant A.
(2015) Definition of efficient scarcity-based water
pricing policies through stochastic programming.
Hydrol. Earth Syst. Sci., 19, 3925–3935, 2015
www.hydrol-earth-syst-sci.net/19/3925/2015
doi:10.5194/hess-19-3925-2015
Masson-Delmotte, V., Zhai, P., Chen, Y., Goldfarb, L.,
Gomis, M. I., Matthews, J. B. R., Berger, S., Huang,
M., Yelekçi, O., Yu, R., Zhou, B., Lonnoy, E.,
Maycock, T. K., Waterfield, T., Leitzell, K., and Caud,
N. (2021). Summary for Policymakers. In Climate
Change 2021: The Physical Science Basis. Contribution
of Working Group I to the Sixth Assessment Report of
the Intergovernmental Panel on Climate Change. In
Press. www.ipcc.ch
MedECC (2020). Climate and Environmental Change in the
Mediterranean Basin – Current Situation and Risks for
the Future. First Mediterranean Assessment Report,
Cramer, W., Guiot, J., Marini, K. eds., Union for the
Mediterranean, Plan Bleu , UNEP/MAP, Marseille,
France, 632 pp. ISBN: 978-2-95774146-0-1. DOI
10.5281/zenodo.4768833.
Orlandi, D., Galatolo, F. A., Cimino, M. G., La Rosa, A.,
Pagli, C., Perilli, N. (2022). Enhancing land subsidence
awareness via InSAR data and Deep Transformers. In
2022 IEEE Conference on Cognitive and Computational
Aspects of Situation Management (CogSIMA) (pp. 98-
103). IEEE.
Pompeu J., I. Ruiz, A. Ruano, H. Bendini and M.J. Sanz
(2021) Land use and land cover databases for
Mediterranean landscape analysis at the watershed
scale. BC3 Working Paper Series 2021-01. Basque
Centre for Climate Change (BC3). Leioa, Spain.
Qin, X., Zhang, Z., Huang, C., Dehghan, M., Zaiane, O. R.,
& Jagersand, M. (2020). U2-Net: Going deeper with
nested U-structure for salient object detection. Pattern
recognition, 106, 107404.
Quirós, E., & Gagnon, A. S. (2020). Validation of flood risk
maps using open source optical and radar satellite
imagery. Transactions in GIS, 24(5), 1208-1226.
Ronneberger, O., Fischer, P., & Brox, T. (2015). U-net:
Convolutional networks for biomedical image
segmentation. In International Conference on Medical
image computing and computer-assisted intervention
(pp. 234-241). Springer, Cham.
Tran, K. H., Menenti, M., Jia, L. (2022). Surface Water
Mapping and Flood Monitoring in the Mekong Delta
Using Sentinel-1 SAR Time Series and Otsu Threshold.
Remote Sensing, 14(22), 5721.
Wang P. (2023), GitHub repository, Implementation of a U-
net complete with efficient attention as well as the latest
research findings, https://github.com/lucidrains/x-unet.
Using Deep Learning and Radar Backscatter for Mapping River Water Surface
221
