
Towards a Business-Oriented Approach to Visualization-Supported
Interpretability of Prediction Results in Process Mining
Ana Roc
´
ıo C
´
ardenas Maita
1 a
, Marcelo Fantinato
1 b
, Sarajane Marques Peres
1 c
and Fabrizio Maria Maggi
2 d
1
School of Arts, Science and Humanities, University of Sao Paulo, Rua Arlindo Bettio 1000, Sao Paulo, Brazil
2
Faculty of Computer Science, Free University of Bozen-Bolzano, Bozen-Bolzan, Italy
Keywords:
Process Mining, Event Logs, Explainable Machine Learning, XAI, Interpretable Machine Learning, Predictive
Process Mining.
Abstract:
The majority of the state-of-the-art predictive process monitoring approaches are based on machine learning
techniques. However, many machine learning techniques do not inherently provide explanations to business
process analysts to interpret the results of the predictions provided about the outcome of a process case and to
understand the rationale behind such predictions. In this paper, we introduce a business-oriented approach to
visually support the interpretability of the results in predictive process monitoring. We take as input the results
produced by the SP-LIME interpreter and we project them onto a process model. The resulting enriched model
shows which features contribute to what degree to the predicted result. We exemplify the proposed approach
by visually interpreting the results of a classifier to predict the output of a claim management process, whose
claims can be accepted or rejected.
1 INTRODUCTION
Operational dashboards in business process manage-
ment (BPM) are traditionally used to monitor the per-
formance of ongoing or recently completed process
cases (or instances). Business process monitoring
dashboards allow process domain experts to intervene
to fix or redirect the running instance or plan future
interventions to optimize or improve the process (Du-
mas et al., 2018). Process experts need to make de-
cisions during process monitoring aiming at optimiz-
ing the outcome of running cases or achieving a more
general business goal. As a result, these decisions
may significantly affect the outcome of cases (Aalst,
2016). In this context, the status of running processes
cases or statistical performance information, usually
available in current BPM systems, may not be suffi-
cient to support decision making.
For this reason, recent research in process min-
ing (Aalst, 2016) has sought to apply machine learn-
ing techniques to predict, from historical process data,
a
https://orcid.org/0000-0001-9879-3229
b
https://orcid.org/0000-0001-6261-1497
c
https://orcid.org/0000-0003-3551-6480
d
https://orcid.org/0000-0002-9089-6896
the evolution of running process cases, thus sup-
porting process analysts in decision making during
process monitoring (M
´
arquez-Chamorro et al., 2017;
Mehdiyev and Fettke, 2021). These machine learn-
ing techniques can be used to predict, e.g., the posi-
tive or negative outcome of a case, the time remain-
ing to complete a case, the next activity to be per-
formed, or the resources to be used to perform an ac-
tivity (Kim et al., 2022; Verenich et al., 2019b; Polato
et al., 2018; Teinemaa et al., 2019; Maggi et al., 2014;
Mehdiyev and Fettke, 2021). However, as in other ar-
eas of machine learning application, many of the tech-
niques used do not inherently provide conditions for
business analysts to interpret the prediction results in
a way to understand the reasons for the predictions
made (Belle and Papantonis, 2021; Holzinger, 2018;
M
´
arquez-Chamorro et al., 2017).
In fact, many machine learning techniques that
solve complex problems provide opaque decision
models (Barredo Arrieta et al., 2020), whose decision
strategy is encoded in complex nonlinear functions
associated with a large parametric space. Such predic-
tive models are commonly applied as black box mod-
els. In a predictive model used as a black box, users
do not understand its internal mechanisms and cannot
extract knowledge about the decision process by look-
Maita, A., Fantinato, M., Peres, S. and Maggi, F.
Towards a Business-Oriented Approach to Visualization-Supported Interpretability of Prediction Results in Process Mining.
DOI: 10.5220/0011976000003467
In Proceedings of the 25th International Conference on Enterprise Information Systems (ICEIS 2023) - Volume 1, pages 395-406
ISBN: 978-989-758-648-4; ISSN: 2184-4992
Copyright
c
2023 by SCITEPRESS – Science and Technology Publications, Lda. Under CC license (CC BY-NC-ND 4.0)
395
ing only at its input parameters and outcomes (Belle
and Papantonis, 2021; Ribeiro et al., 2016). However,
in many real-world scenarios, e.g., healthcare and fi-
nance, explanations of why a model gives certain pre-
dictions are sorely needed, while in other domains
they would be at least useful (Holzinger, 2018).
As for predictive process monitoring (PPM),
knowing, e.g., which activities of a running process
case determine whether its final outcome will be pos-
itive or negative may be crucial to apply corrective ac-
tions to that case or to ensure that such events do not
reoccur. Thus, having information about why a ma-
chine learning technique is predicting a certain out-
come for a process case may be more beneficial than
just getting high-accuracy predictions. However, few
studies on PPM have addressed interpretability (or ex-
plainability) for prediction results aided by machine
learning techniques. Some recent studies on this topic
are presented by Warmuth and Leopold (2022); Wick-
ramanayake et al. (2022); Rizzi et al. (2020); Galanti
et al. (2020) and Weinzierl et al. (2020).
LIME (Local Interpretable Model-agnostic Expla-
nations) (Ribeiro et al., 2016) is one of the best-
known techniques for interpreting machine learning
results. Despite being easily implemented and widely
used, we claim LIME is primarily designed for data
scientists. As a result, LIME produces and presents
interpretability data in a way that does not make it
easy for business experts to understand that data and
hence to interpret the prediction results. Process do-
main experts would hardly be able to directly under-
stand LIME results to then interpret prediction results
produced by machine learning-supported PPM.
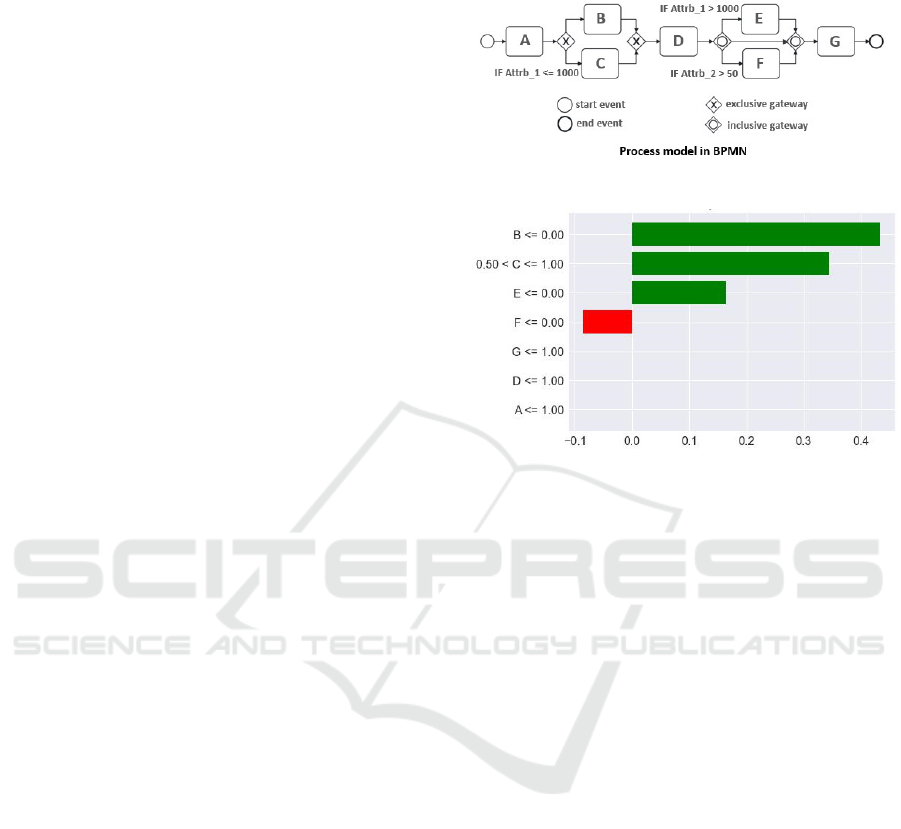
For example, consider the illustrative process
model shown in Figure 1. Assume that a predictor
was created to predict the outcome of a new process
instance, whose output can be positive or negative,
considering the path the instance takes through the
process, i.e., the instance trace. LIME could be run
to explain why the prediction results for certain in-
stances are being performed considering the activi-
ties that were performed by the process instance under
analysis. The result produced by LIME would seems
like the one shown in Figure 2. This standard out-
put of the LIME method is generic for any type of
predictor, for any application domain. Note that the
information presented in Figure 2, especially the way
it is presented on the Y axis, is not easy, straightfor-
ward to interpret for a process domain expert. For ex-
ample, per Figure 2, the non-execution of activity E
contributes positively to the prediction of the positive
result for that instance, while the execution of activ-
ity B contributes positively. Ideally, this information
should be presented in a specific way for that applica-
tion domain, i.e., on the business process model itself.
Figure 1: Illustrative example of a business process model.
Figure 2: Illustrative example of LIME result for a positive-
case outcome.
In this work, we introduce VisInter4PPM – a
business-oriented approach to visually support the in-
terpretability of PPM results. VisInter4PPM relies on
the SP-LIME (Ribeiro et al., 2016), which is derived
from LIME. We propose to graphically represent,
through the activities in the process model, which fea-
tures contribute to what degree to a predicted result.
This graphic representation must be based on the re-
sults produced by SP-LIME. Data to support the in-
terpretation of prediction results can be viewed per
case, using the LIME outcome directly, or globally,
building a combined interpretation of multiple SP-
LIME outcomes through post-processing. We exem-
plify this approach by visually interpreting the results
of a classifier to predict the outcome of a claim man-
agement process, whose claims can be accepted or re-
jected. To the best of our knowledge, our work pro-
vides a novel manner to view interpretability data in
machine learning-supported PPM by combining the
post-processing of the outcome of an interpretability
method with data expressed graphically in a process
model.
The remainder of this paper is organized as fol-
lows: Section 2 presents the theoretical background.
Section 3 details our proposed approach, whereas
Section 4 reports the conducted experiment. Section
5 discusses related work. Finally, Section 6 concludes
the paper and spells out directions for future work.
ICEIS 2023 - 25th International Conference on Enterprise Information Systems
396

2 THEORETICAL BACKGROUND
We introduce here our theoretical background, which
includes an overview of process mining and PPM, and
the concept of interpretable predictive models.
2.1 Process Mining and PPM
Process mining (Aalst, 2016) is a bridge between
data science and process science, which, among other
things, enables organizations to effectively use infor-
mation on process executions from event logs to mon-
itor and optimize processes across the BPM lifecycle.
The different solvable tasks in process mining
consider an event log from one or more of four per-
spectives (Aalst, 2016): (1) control flow, which as-
sumes as a source of information the process logic
represented by the trace associated with each case; (2)
performance, which allows discovering knowledge
regarding the execution time of activities and cases;
(3) resource, which provides an organizational and so-
ciometric analysis that relates resources and how they
are distributed within the work logic associated with
the process; and (4) case, which considers the proper-
ties of the case providing contextualized analysis on
the business underlying the process under analysis.
As summarized by de Sousa et al. (2021), follow-
ing Aalst (2016)’s definitions, process mining work
relies primarily on the concepts of event, case, trace,
log, and attribute. An event e is the occurrence of a
business process activity at a given time, performed
by a given resource, at a given cost. A case c cor-
responds to a process instance and comprises events
such that each event relates exactly to a case. A trace
ς is a mandatory attribute of a case and corresponds
to a finite sequence of events such that each event ap-
pears only once. An event log L is a set of cases such
that each event appears only once in the entire event
log. Each event in the event log comprises a set of
attributes such as identifier, timestamp, activity, re-
source, and cost. Cases can also have non-mandatory
attributes, often related to domain-specific data.
This work is particularly interested in the analysis
from a flow-of-control perspective. For this perspec-
tive, the notions of simple trace and simple event log
can be used. According to Aalst (2016), a simple trace
σ is a finite sequence of activity names A, i.e. σ ∈ A
∗
,
and a simple event log l is a multi-set of simple traces
over A
∗
. Thus, an event log L, as illustrated in Figure
3, is represented as a simple event log l = [hA, B, D,
E, Gi
70
, hA, B, D, E, F, Gi
201
, hA, B, D, F, E, Gi
50
,
hA, C, D, Gi
47
, hA, C, D, F, Gi
132
].
Predictive process monitoring (PPM) aims to pre-
dict the behavior, performance, and results of business
Figure 3: Illustrative example of an event log snippet with
respect to the business process model in Figure 1.
process at runtime. PPM triggers alerts on the execu-
tion of running cases, provides early advice so users
can guide ongoing process executions towards achiev-
ing business goals (Maggi et al., 2014). There are two
most common types of PPM, depending on the type of
target variable: regression problems (such as estimat-
ing the time to complete a case) for continuous vari-
ables, and classification problems (such as predicting
the next event or the case outcome) for discrete vari-
ables (Mehdiyev et al., 2020). PPM can help deter-
mine the performance of a given process execution (a
so-called process case, e.g., an order, a purchase re-
quest, or a claim) against its performance measures
and performance goals (Dumas et al., 2018).
PPM can support process analysts in various con-
texts. For instance, Robeer (2018) proposed results-
oriented PPM, which refers to classifying each on-
going case of a process according to a certain set of
possible categorical outcomes, to predict the remain-
ing incomplete case processing time and satisfy a cer-
tain customer delivery. Maggi et al. (2014), in turn,
proposed a compliance monitoring approach in which
predictions and recommendations are made based on
what activities to perform and what input data val-
ues to provide to minimize the likelihood of violating
business constraints.
PPM seeks to provide process analysts with mean-
ingful information about what they are interested in
analyzing to make the best decision in order to meet
business goals, in terms of key performance indica-
tors, service level agreements, and satisfactory deliv-
erables. Although the results produced by the ma-
chine learning-based predictive models currently used
have a satisfactory accuracy, the origin and reasoning
Towards a Business-Oriented Approach to Visualization-Supported Interpretability of Prediction Results in Process Mining
397

of these results cannot be easily interpreted by pro-
cess analysts (M
´
arquez-Chamorro et al., 2017). Thus,
the process analyst should simply rely on a predic-
tive model with high accuracy and follow the algo-
rithm’s suggestion without knowing the details of how
the prediction was performed. Mainly in high-risk
processes, e.g., healthcare processes, or processes for
which execution time is a critical factor, e.g., finan-
cial processes, the process analyst should always be
provided with as much information as possible con-
sidering the details about the decision made by the
algorithm used for predictions.
2.2 Interpretable Predictive Models
An interpretable machine learning system is capable
of explaining its decisions in such a way that humans
can understand the full logic behind those decisions
(Roscher et al., 2020; Sagi and Rokach, 2020). We
are here especially interested in a class of machine
learning models – the predictive models.
A criterion used to classify interpretability meth-
ods refers to the way in which the predictive model
outcome is obtained. According to this criterion, the
interpretability method can be local, if it explains the
behavior of the predictive model for a given instance,
or global, if it seeks to do it for the model as a whole
(Belle and Papantonis, 2021). A local interpretation
method explains individual predictions (Ribeiro et al.,
2016). A sensitivity analysis can be used to inspect
how the outcome of a model locally depends on dif-
ferent input parameters (Roscher et al., 2020). For ex-
ample, suppose there is a black box predictive model
where you can enter data points and get the model’s
predictions. Changes to parameters can be made as
many times as necessary to understand why the model
made a prediction for a given piece of data.
Ribeiro et al. (2016) proposed the Local Inter-
pretable Model-agnostic Explanations (LIME) algo-
rithm designed to faithfully and locally approximate
an interpretable model over the interpretable repre-
sentation
1
. The LIME procedure is split into the fol-
lowing steps:
1. Selecting an instance x for which an explanation
of the prediction provided by the original predic-
tive model f (seen as a black box) is desired, and
creating x
0
by mapping x to the interpretable rep-
resentation space.
2. Randomly and uniformly perturbing instances in
the neighborhood of x
0
resulting in the dataset Z
0
,
1
An interpretable representation is one that can be un-
derstood by humans, regardless of the actual features used
by the prediction model (Ribeiro et al., 2016), and that ex-
plains the predictions of any classifier or regressor.
and weighting the new instances in Z
0
according
to their similarity to x
0
.
3. Retrieving the weighted instance dataset Z by
mapping Z
0
to the original representation space,
and getting the predictions from f for Z.
4. Training the local interpretable predictive model
g over Z
0
using the labeling obtained for Z.
5. Explaining the prediction of x
0
using the local in-
terpretable predictive model g.
While LIME works locally on specific instances,
submodular pick LIME (SP-LIME) (Ribeiro et al.,
2016) works globally to evaluate and assess the pre-
dictive model as a whole. SP-LIME aims to provide
a global understanding of the predictive model by ex-
plaining a set of individual instances. Its purpose is to
select a set of diverse, representative instances from
the dataset and apply LIME to them to provide in-
terpretations. Representative records are chosen non-
redundantly aiming to cover as many relevant features
as possible; features that explain many different in-
stances have higher importance scores.
3 PROPOSED APPROACH
VisInter4PPM (visual interpretability for PPM) is a
business-oriented approach designed to visually sup-
port the interpretability of results in PPM.
The approach is split into two parts. The first con-
cerns the creation of the non-interpretable predictive
model and the application of SP-LIME in that model
to create the local approximate predictive model (cf.
Figure 4). The second refers to the visual projection
of SP-LIME explanations onto the process model,
which can be applied locally, to explain the prediction
at the instance (or case) level, or globally, to provide
a global explanation of the learning achieved by the
predictive model f (cf. Figure 5).
From the flow shown in Figure 4, the approach re-
quires (i) filtering the event log L from the analysis
of the perspectives of interest, (ii) creating the pre-
dictor, and (iii) applying SP-LIME (cf. Section 2.2).
In the current version of the proposed approach, only
the control flow perspective is being addressed. Af-
ter obtaining the explanations from SP-LIME, the ex-
planations produced must be adequate to enable the
analysis of a business analyst, according to the flow
proposed in Figure 5.
According to Figure 5, SP-LIME explanations for
a given instance are projected onto the process model
by coloring the activities in the model
2
. Each dimen-
sion of the SP-LIME interpretable feature space refers
2
Color graphical projection onto the process model is
ICEIS 2023 - 25th International Conference on Enterprise Information Systems
398
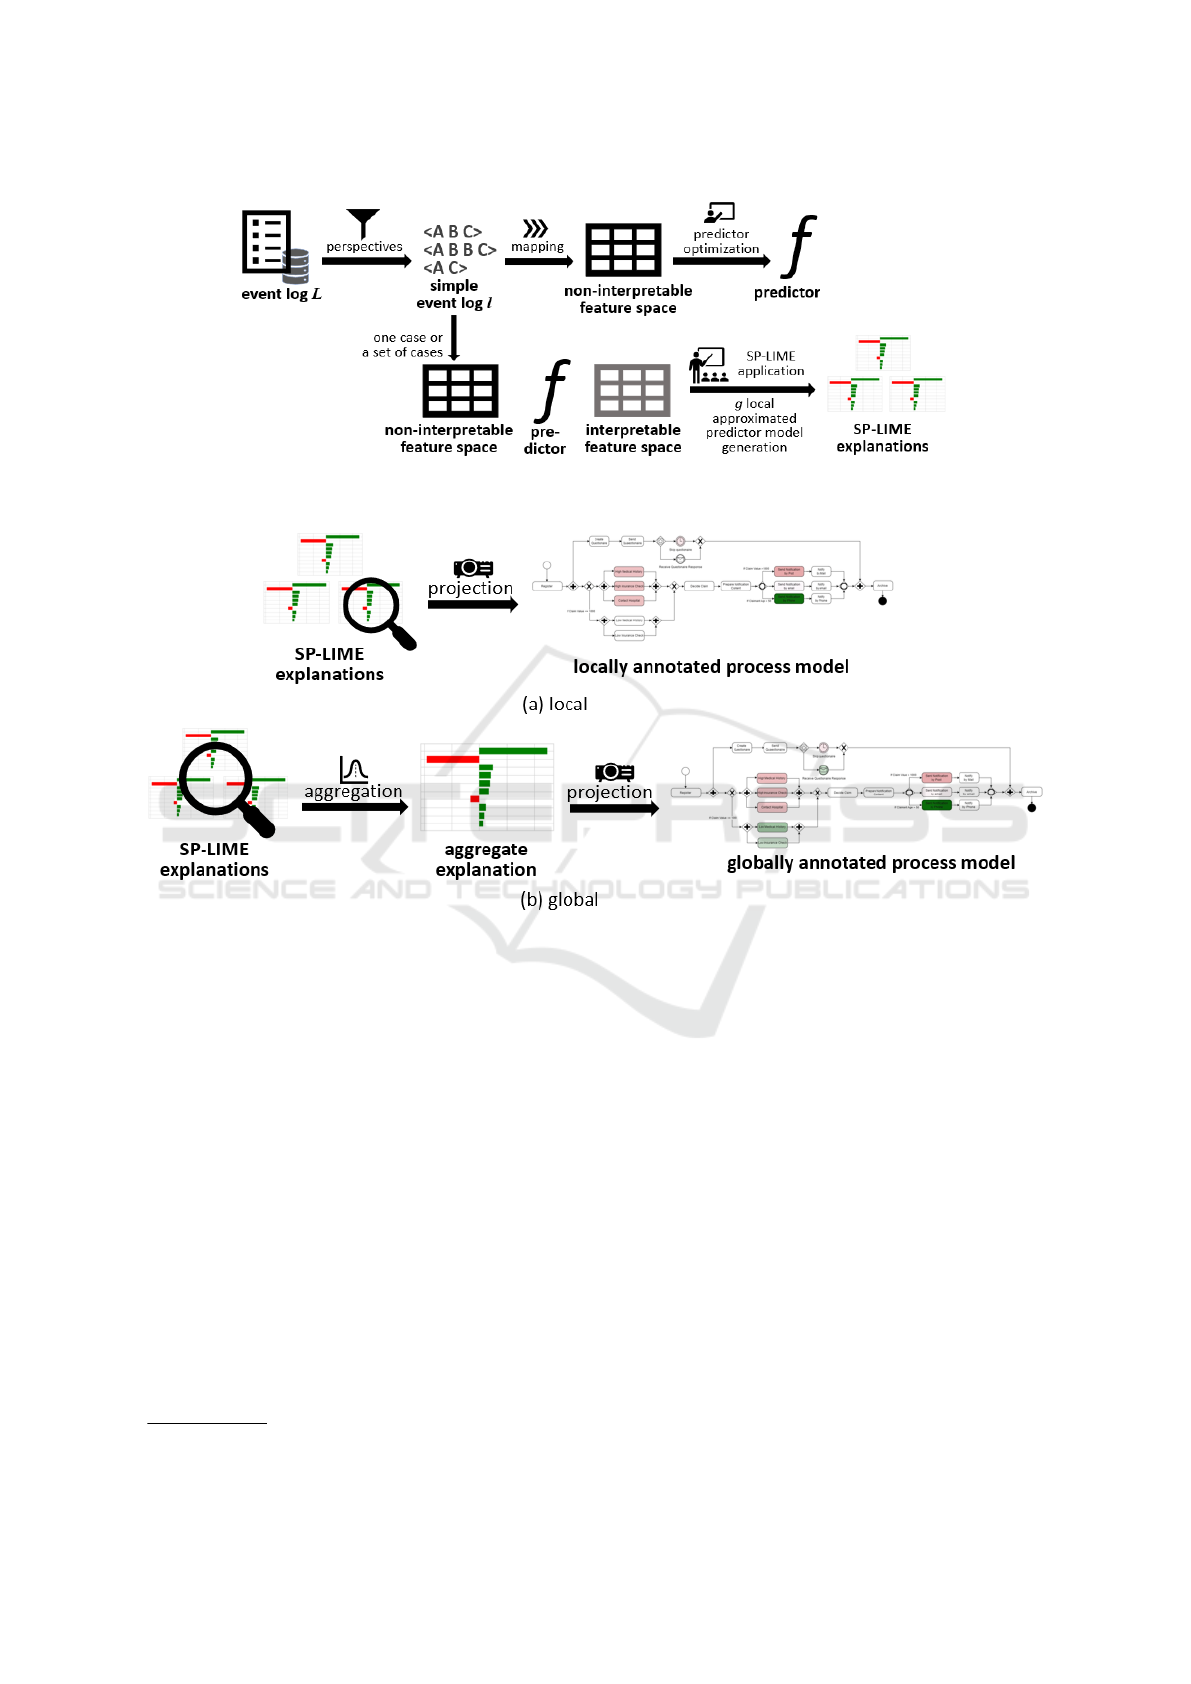
Figure 4: VisInter4PPM – creating SP-LIME explanations.
Figure 5: VisInter4PPM – projecting explanation onto process model.
to an activity of the process model, and the occurrence
or not of the activity values the corresponding dimen-
sion as 1 or 0, respectively. Explanations about the
occurrence of an activity are projected onto the pro-
cess model in intensities of red and green, where red
means a negative influence on the predictor’s decision
and green means a positive influence on the predic-
tor’s decision. The intensity of the influence of the
activity’s occurrence on the predictor’s decision (ac-
cording to the weight assigned by SP-LIME to the
corresponding feature) determines the intensity of the
color used to color the activities in the process model.
The darker the color, the greater the influence. Ex-
planations about the non-occurrence of an activity are
disregarded, as the interpretation of a prediction can
be focused only on the positive or negative influence
that an activity exerts when it is performed.
Figure 5 highlights two possibilities for applying
the interpretable predictive model. For the local in-
not yet automated.
terpretation (cf. Figure 5(a)), the user can choose
specific instances, among those offered by SP-LIME,
for which they want to view and analyze the individ-
ual explanations. As for the global interpretation (cf.
Figure 5(b)), an aggregation of explanations is pro-
jected onto the process model, providing a general ex-
planation for all instances offered by SP-LIME. Ag-
gregation is performed through the average calculated
on the weights assigned by SP-LIME to each dimen-
sion of the interpretable space. The average repre-
sents the common behavior captured from several in-
stances, which can highlight different features, in or-
der to unify the representativeness of each instance.
4 EXPERIMENTAL STUDY
We report here the application of the proposed ap-
proach in an example scenario through an experimen-
tal study. We present the business process and event
Towards a Business-Oriented Approach to Visualization-Supported Interpretability of Prediction Results in Process Mining
399

log used, the settings and execution of the experiment,
the results achieved, and the respective analysis.
4.1 Business Process and Event Log
The event log refers to an illustrative health insur-
ance claim management process in a travel agency
that has been used in process mining studies (Maisen-
bacher and Weidlich, 2017; Rizzi et al., 2020). We
adapted the process model to merge the alternative
activities Accept claim and Reject claim into only one
activity Decide claim, as the occurrence of that origi-
nal activities is correlated with the outcome target for
the predictive model. The resulting business process
comprises 19 activities (including two intermediate
events). Figure 6 shows the adapted process modeled
in business process model and notation (BPMN).
The business process begins with the claim regis-
tration. Then, alternative activities are carried out to
analyze the registered claim, depending on the claim
value. After analysis, a decision is made on the claim
and the claimant is notified. Notification may be by
post, email, or telephone, depending on the claim
value and claimant age. In parallel, a questionnaire
is sent to the claimant, who has a deadline to respond
to it. Finally, the claim is archived. The synthetic
event log created comprises 35,358 events and 3,200
cases with a maximum case length of 16 events.
4.2 Preprocessing
In this experiment, we assume the travel agency wants
to predict whether a claim will be accepted (positive-
case outcome) or rejected (negative-case outcome) for
a running process case. Thus, we have a categorical
prediction problem (a classification problem) to solve.
To train the classification model, we labeled the
event log as reported in Table 1. As a result, the event
log has 1,326 accepted cases and 1,874 rejected cases.
In this event log, there are six variants of simple traces
associated to accepted cases, and ten variants of sim-
ple traces associated to rejected cases.
The following pre-processing steps were carried
out before training the classifier:
1. The original event log
3
was filtered according to
the attribute Activity to support the control-flow
analysis; and a simple event log l was created as a
multiset of simple traces.
2. An alternate simple event log l
0
was created on
top of l considering one occurrence of each sim-
ple trace variant (disregarding data about the fre-
3
Event logs and codes are available at
https://github.com/double-blind.
Table 1: Rules for labeling the event log.
ID Constraint Label
1 claim value > 1000 AND
(claimant age ≤ 50 OR
receive questionnaire response = false)
rejected
(false)
2 claim value > 1000 AND
(claimant age > 50 AND
receive questionnaire response = true)
accepted
(true)
3 claim value ≤ 1000 AND
skip questionnaire = false
accepted
(true)
4 claim value ≤ 1000 AND
skip questionnaire = true
rejected
(false)
quency of simple traces in l), resulting in a simple
event log with 16 simple traces.
3. A frequency-based encoding was applied into the
simple event log, following the procedure sug-
gested by Rizzi et al. (2020); i.e., each trace was
represented as a feature vector in which each fea-
ture represents an activity and is valued with the
number of occurrences of that specific activity in
the trace. As there is no loop in the process model
under analysis, the result was a binary encoding.
4. To apply SP-LIME independently to each predic-
tion class existing in l
0
, two subsets of instances
were created: l
r
0
, referring to the subset of in-
stances associated with the target rejected; and l
a
0
,
referring to the subset of instances associated with
the target accepted.
4.3 Experiment Setup
The experiment aimed to apply the proposed ap-
proach to visually project onto the process model
which activities most influence the prediction of the
case outcome as provided by the classifier model.
Following the strategy depicted in Figure 4 and
Figure 5, the following steps were performed:
1. Construction of the classifier using the k-NN al-
gorithm and the event log l
0
. k-NN was chosen
due to its low parameterization and training com-
plexity, as the goal of this experiment focuses on
the explanation visualization. k-NN was run us-
ing the Euclidean distance with k = 3 (value cho-
sen via tests with k ranging in [2, 15]). The event
log l
0
was chosen aiming to isolate trace frequency
bias on classifier decisions
4
. The classifier was
4
The event log l could be used alternatively. However,
k-NN should be properly adapted to deal with unbalanced
ICEIS 2023 - 25th International Conference on Enterprise Information Systems
400

Figure 6: Health insurance claim management process in a travel agency, adapted from (Rizzi et al., 2020).
built overfitted over the full event log l
0
to create
a global environment for viewing explanations of
the process under analysis in this experiment.
2. Application of SP-LIME to generate explanations
for the decisions of the k-NN classifier. SP-LIME
receives as input the previously trained classifier,
the set of instances for which explanations must
be obtained (l
r
0
or l
a
0
), the number of features to
be considered in the explanations (# f ), and the
number of explanation instances to be produced
(#r). These following values were chosen: # f =
total number of activities existing in l
0
, to allow
the explainer to explore the entire interpretable
representation space, and #r = 5 for each applica-
tion scenario (l
r
0
e l
a
0
), which is an arbitrary value
chosen for purposes of exploratory study.
3. Implementation of the interaction explanations
with the explanations provided by SP-LIME, con-
sidering the visual projection of the explanations
applied locally or globally. For the former, the
business analyst must choose an instance x for
which they want a visualization is desired, i.e., let
x = user pick(l
r
0
) or user pick(l
a
0
). Explanations
for a set of instances X are aggregated (via the ag-
gregation function mean), where X comprises all
instances x of l
r
0
or all instances x of l
a
0
, for which
the business analyst is interested in the interpreta-
tion of the prediction.
4.4 Results and Discussion
Since the k-NN classifier is overfitted on l
0
, the way
to assess its quality is via resubstitution error ε. Ac-
cording to Han et al. (2012),
“(...) if we were to use the training set (in-
stead of a test set) to estimate the error rate of
neighborhoods resulting from the inheritance of weights in
the datapoints, resulting from the unbalance of l.
a model, this quantity is known as the resubsti-
tution error. This error estimate is optimistic
of the true error rate because the model is not
tested on any samples that it has not already
seen.”
Thus, the error value does not reflect a general-
ization measure, but only shows the upper limit for
the learning effectiveness achieved by k-NN over l
0
.
In this experiment, ε = 1 − FScore = 0.0625. The
classifier was unable to perfectly approximate the de-
cision surface to l
0
, making a classification error for
the following simple trace:
σ = h Register, Create Questionnaire, Send Ques-
tionnaire, Receive Questionnaire Response, High
Medical History, High Insurance Check, Contact
Hospital, Decide Claim, Prepare Notification Con-
tent, Send Notification by Post, Notify by Post, Send
Notification by Phone, Notify by Phone, Archive i
True label: TRUE; k-NN prediction: FALSE.
Figure 7 shows the result of post-processing the
SP-LIME outcomes. The first block refers to the neg-
ative class (rejected claims), while the second block
refers to the positive class (accepted claims). For each
block, there are the five instances for which local ex-
planations were created, followed by the aggregation
(via mean) of those five explanations, feature by fea-
ture. The colors are applied proportionally, that is, the
intensity of the color is proportional to the weight as-
sumed by the feature in the SP-LIME explanation; the
darkest tone refers to the highest absolute value.
As illustrative example, Figure 8 and Figure 9
show two representative instances (from Figure 7) in
the original LIME format. These two instances are
highlighted in Figure 7 surrounded by dashed lines.
These examples show the potential difficulty for one
to understand this data in order to interpret the clas-
sifier outcomes. On the left side of the chart, there
are the relevant features chosen by LIME. The feature
name is accompanied by the range of values it must
take to have the relevance associated with that predic-
Towards a Business-Oriented Approach to Visualization-Supported Interpretability of Prediction Results in Process Mining
401
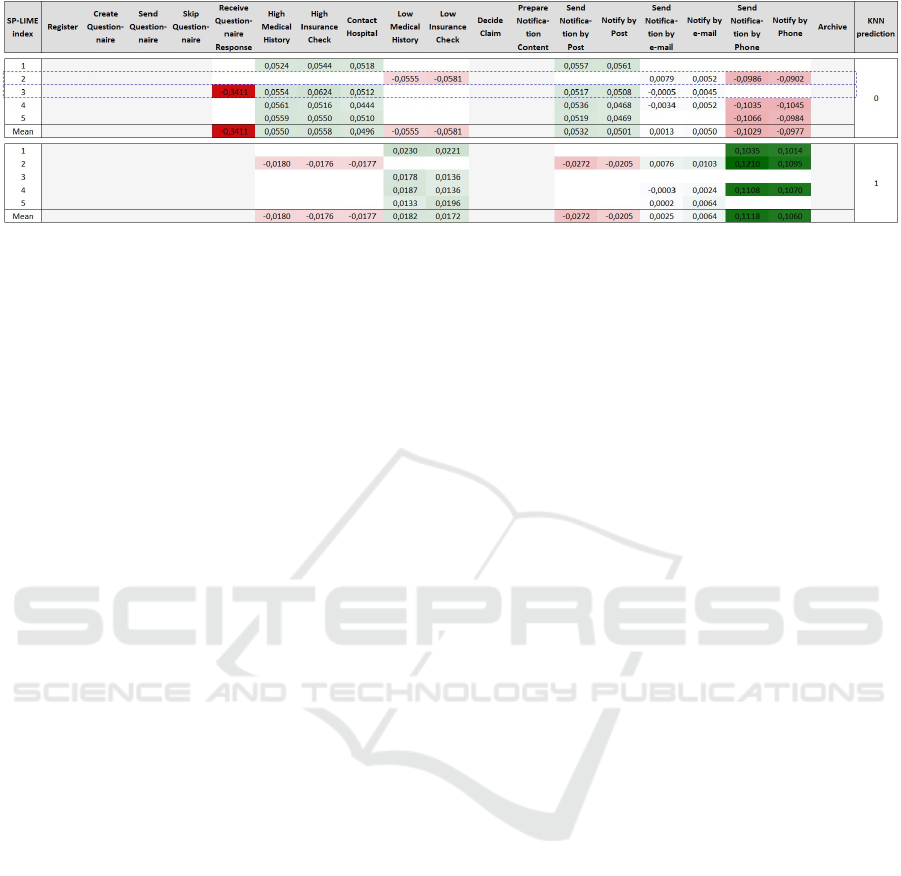
Figure 7: Result of post-processing the SP-LIME outcomes (considering only feature values = 1).
tion explanation. In this experiment, there are only
two options for values to be assumed by the features
– 0 (which means that the activity is not executed) or
1 (which means that the activity is executed). Fea-
tures accompanied by “<= 1.00” or “> 0” refer to
executed activities (i.e., the corresponding activity is
present in the simple trace under analysis), while the
others refer to those not executed. As for the right side
of the chart, the size of the green and red bars repre-
sent the influence that the corresponding feature had
on the predicted result. Green bars refer to positive
influence, while red bars refer to negative influence.
Both Figure 8 and Figure 9 present interpretability
values for the negative class, i.e., the green bars re-
fer to the positive influence of a given feature (repre-
senting either the execution or the non-execution of an
activity) for the prediction of a rejected claim. Only
features referring to activities executed (i.e., whose
value = 1) are mapped with the data in Figure 7.
Figure 10 and Figure 11 show the locally anno-
tated process models corresponding to both instances
presented in Figure 8 and Figure 9, respectively.
These annotated process models were created by vi-
sually projecting the values in Figure 7 in the original
process model (cf. Figure 6). The exact same color
intensity scale is used. Understanding this visual in-
formation is easier for a business analyst. Figure 10,
e.g., shows the influence of the execution of activities
for the rejection of the claim associated with instance
SP-LIME index = 2. One can observe that, for this in-
stance, there are four activities whose execution neg-
atively influenced this rejection, as they are colored
in red, while there are two activities whose execution
positively influenced, as they are colored in green.
Again, color intensity represents a greater or lesser
influence, whether positive or negative. Colorless ac-
tivities either were not carried out or did not exert any
influence, whether positive or negative. In Figure 11,
one can observe seven activity occurrences positively
influencing the rejection, while only one negatively
influencing rejection.
As each analyzed instance can offer different
points of view on the influence of each process activ-
ity, a global view can be more useful for the business
analyst. Figure 12 shows the globally annotated pro-
cess model resulting from the aggregation of the in-
terpretability values for each model feature, by avera-
ging the feature values for the five most representative
instances chosen by SP-LIME. One can see that, over-
all, the occurrence of Receive questionnaire response
has the greatest negative influence for a claim to be
rejected; i.e., when this event occurs, the claim will
likely not be rejected. Moreover, when Low medical
history and Low insurance check are carried out, as
well as when Send notification by phone and Notify
by phone are carried out, the claim is also likely not
to be rejected, although less likely. On the other hand,
when High medical history, High insurance check,
and Contact hospital are carried out, as well as Send
notification by post and Notify by post, the claim is
also likely to be rejected. In addition, when Send no-
tification by email and Notify by email are carried out,
there is a chance, albeit small, that the claim will be
rejected.
Similarly, Figure 13 shows the overview for pre-
dicting positive cases, i.e., accepting claims. The
globally annotated process models in Figure 12 and
Figure 13 are partially complementary, as one rep-
resents the positive cases and the other the negative
ones. However, the classification is not fully binary;
for example, the existence of an OR gateway adds
complexity to decisions. For Figure 13, the occur-
rences Send notification by phone and Notify by phone
are those that most increase the chance of the request
being accepted.
5 RELATED WORK
In 2017, M
´
arquez-Chamorro et al. (2017) presented
a survey to understanding the state-of-the-art in pre-
dictive monitoring of business processes. The authors
reported that, until that time, few initiatives were con-
cerned with the interpretability of the predictive mod-
ICEIS 2023 - 25th International Conference on Enterprise Information Systems
402
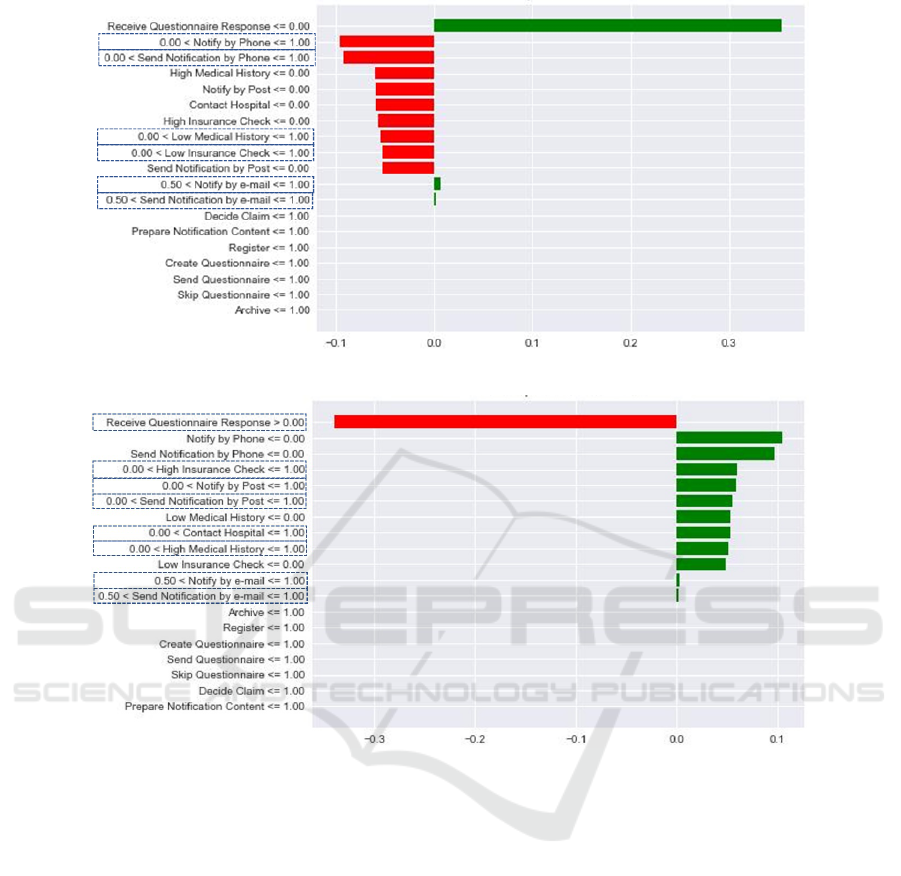
Figure 8: A representative instance in the original LIME format (SP-LIME index = 2 for negative class).
Figure 9: A representative instance in the original LIME format (SP-LIME index = 3 for negative class).
els. Among the 41 studies analyzed, three explic-
itly mention the concern with proposing interpretable
predictors. The authors point out most works focus-
ing on classification tasks do not deal with process-
conscious methods, which prevents them from di-
rectly bringing useful interpretations and explanations
to a business analysis. Finally, these authors warn that
“little attention has been given to providing recom-
mendations and explaining the prediction values to
the users so that they can determine the best way to
act upon”. However, from 2017 to nowadays, this re-
search gap has been filled. Through an exploratory
study, we identified recent initiatives dealing with the
interpretability in business process monitoring.
Frameworks to discover the set of attributes that
most influence a predictor is studied in Galanti et al.
(2020); Mehdiyev and Fettke (2021); Weinzierl et al.
(2020). These works differ in the approach used to
obtain the explanations, the prediction tasks involved,
and the way the explanations are returned to a user:
Galanti et al. (2020) use game theory (Shapley Val-
ues) to get explanations to the prediction model, in-
stantiate their framework for predicting the remain-
ing time, activity occurrences and case costs, and of-
fer explanations formatted as tables and heatmaps re-
lated to characteristic’s values and weights; Mehdiyev
and Fettke (2021) apply surrogate decision trees to ex-
plain the decision of neural network-based predictors
applied for predicting next activity, outcome cases,
and service level agreement violations, and return the
explanations using the hierarchical tree structure and
IF-THEN rules; Weinzierl et al. (2020) use a layer-
wise relevance propagation method on predictors built
with long short-term memory neural networks, apply
the approach to the next task prediction problem, and
provide the results as heatmaps to show the relevance
of the input activities.
The proposition of white-box predictors is also re-
Towards a Business-Oriented Approach to Visualization-Supported Interpretability of Prediction Results in Process Mining
403
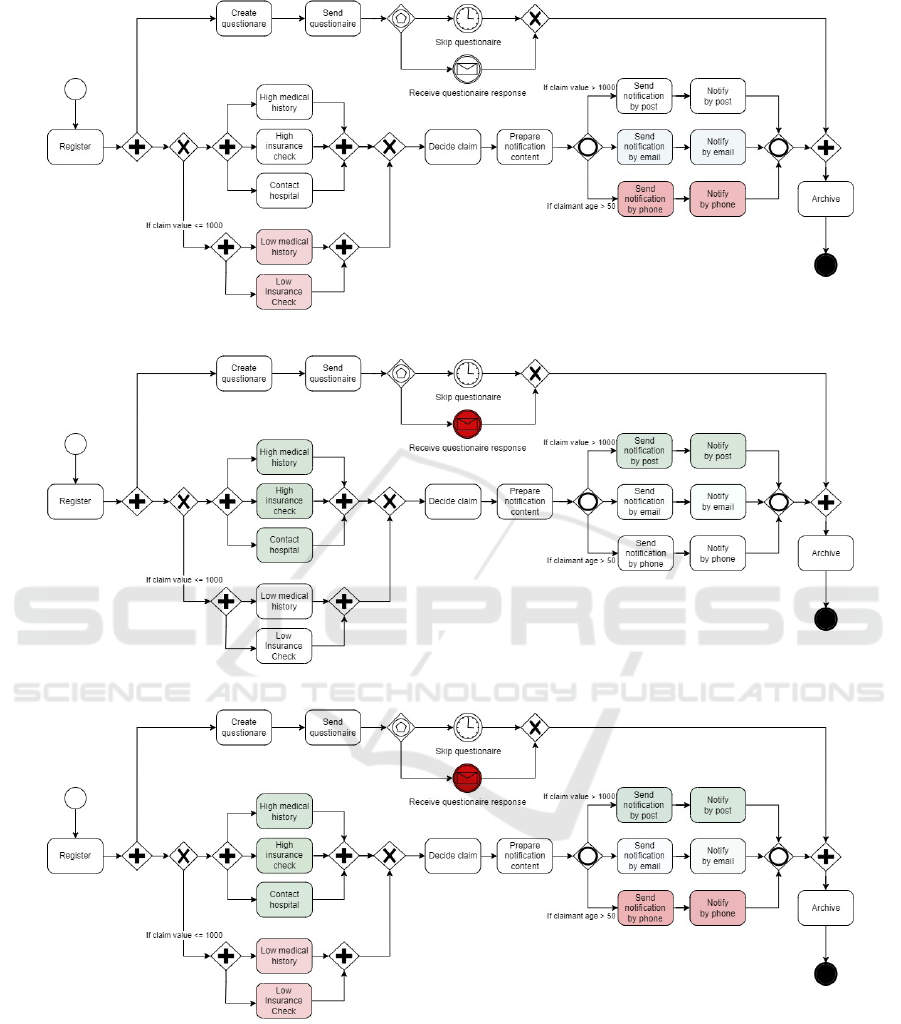
Figure 10: Example of locally annotated process model (SP-LIME index = 2 for negative class).
Figure 11: Example of locally annotated process model (SP-LIME index = 3 for negative class).
Figure 12: Globally annotated process model (negative class).
ceiving attention from the predictive process monitor-
ing area. The framework presented by Verenich et al.
(2019a) first predicts a performance indicator at the
level of activities and then aggregates these predic-
tions at the level of a process instance through flow
analysis techniques. Wickramanayake et al. (2022), in
turn, introduce two new interpretable attention-based
models, as they incorporate interpretability straight
into the structure of a process predictive model. In
this sense, the predictors themselves can inform what
the resulting prediction is and why it was got.
Different lines of study are presented by Rizzi
et al. (2020) and Warmuth and Leopold (2022).
In Rizzi et al. (2020), the authors apply the clas-
ICEIS 2023 - 25th International Conference on Enterprise Information Systems
404
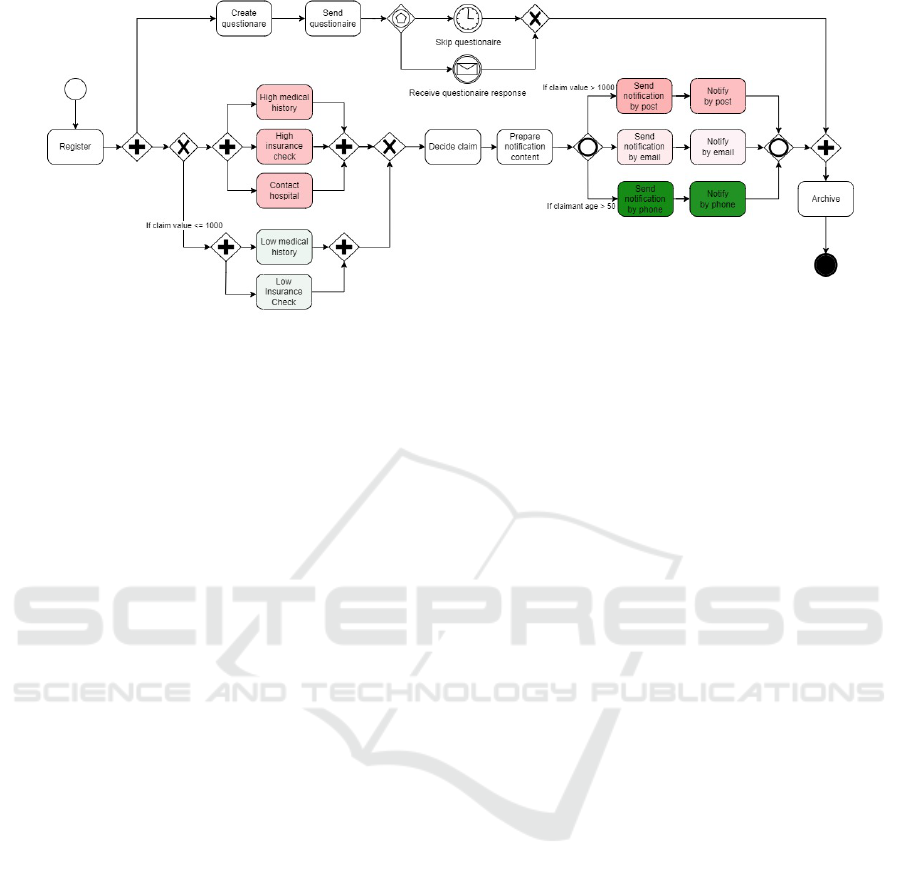
Figure 13: Globally annotated process model (positive class).
sic interpretability approach using approximate inter-
pretable models (LIME and SHARP) to explain unin-
terpretable models. The differential of this work is the
interpretations are employed to enhance the training
of the original predictor. They identify the most com-
mon features that induce the predictor to make mis-
takes. Then, they alter such features to reduce their
impact on the result, thereby improving the predictor
accuracy. Finally, Warmuth and Leopold (2022) use
textual information combined with non-textual data
as a basis for constructing explanations. As a result,
besides returning explanations based on the influence
of features for decision making, the authors can also
highlight such influence within a textual description
of the context associated to the business process.
The studies presented here motivate the use
of interpretability techniques or white-box models,
emphasizing the need to provide value-added and
business-oriented information, endowing a business
analyst to make robust and justifiable decisions in pre-
dictive process monitoring field. However, none of
them present the visualization of explanations at the
top of the process model associated with the business,
positioning the approach discussed herein as a possi-
bility to fill a gap in the process mining practice.
6 CONCLUSION
In this paper, we introduce a business-oriented ap-
proach to visualization of explanations derived from
the use of SP-LIME over a classification model.
When SP-LIME results are projected onto the pro-
cess model, a business analyst can quickly identify
the activities that directly intervened, and to what ex-
tent, in the decision provided by a predictive model.
By making information accessible to the business an-
alyst, process mining approaches help to avoid unfair
and inaccurate actions within the organizational con-
text, and promote the transparency of the decision-
making process.
The VisInter4PPM approach was introduced in
this paper and instantiated in an experiment consider-
ing a synthetic event log, the control flow perspective
of analysis, and the SP-LIME method. The next steps
in the development of VisInter4PPM include the in-
corporation of visualization elements enabling other
perspectives of analysis (performance, resource and
case), commonly used in the process mining field, the
use of other methods for explaining predictors, and
the experimentation with real-world event logs.
REFERENCES
Aalst, W. M. P. (2016). Process Mining – Data Science in
Action. Springer.
Barredo Arrieta, A., D
´
ıaz-Rodr
´
ıguez, N., Del Ser, J., Ben-
netot, A., Tabik, S., Barbado, A., Garcia, S., Gil-
Lopez, S., Molina, D., Benjamins, R., Chatila, R., and
Herrera, F. (2020). Explainable artificial intelligence
(xai): Concepts, taxonomies, opportunities and chal-
lenges toward responsible ai. Inf. Fusion, 58:82 – 115.
Belle, V. and Papantonis, I. (2021). Principles and prac-
tice of explainable machine learning. Front. Big Data,
page 39.
de Sousa, R. G., Peres, S. M., Fantinato, M., and Reijers,
H. A. (2021). Concept drift detection and localiza-
tion in process mining: An integrated and efficient ap-
proach enabled by trace clustering. In Proc. of the 36th
Annual ACM Symp. Appl. Comput, page 364–373.
Dumas, M., Rosa, M. L., Mendling, J., and Reijers, H.
(2018). Fundamentals of Business Process Manage-
ment. Springer, 2nd edition.
Galanti, R., Coma-Puig, B., de Leoni, M., Carmona, J., and
Navarin, N. (2020). Explainable predictive process
monitoring. In Proceedings of the 2nd International
Conference on Process Mining, pages 1–8.
Towards a Business-Oriented Approach to Visualization-Supported Interpretability of Prediction Results in Process Mining
405

Han, J., Kamber, M., and Pei, J. (2012). Data mining con-
cepts and techniques, third edition. Morgan Kauf-
mann Publishers, 3rd edition.
Holzinger, A. (2018). From machine learning to explainable
ai. In Proc. of 2018 World Symp. on Digital Intell.
Syst. Mach., pages 55–66.
Kim, J., Comuzzi, M., Dumas, M., Maggi, F. M., and Teine-
maa, I. (2022). Encoding resource experience for
predictive process monitoring. Decis. Support Syst,
153:113669.
Maggi, F. M., Francescomarino, C. D., Dumas, M., and
Ghidini, C. (2014). Predictive monitoring of busi-
ness processes. In Int. Conf. Adv. Inf. Syst. Eng., pages
457–472.
Maisenbacher, M. and Weidlich, M. (2017). Handling con-
cept drift in predictive process monitoring. In Proc. of
2017 IEEE Int. Conf. Serv. Comput., pages 1–8.
M
´
arquez-Chamorro, A. E., Resinas, M., and Ruiz-Cort
´
es,
A. (2017). Predictive monitoring of business pro-
cesses: A survey. IEEE Trans. Serv. Comput.,
11(6):962–977.
Mehdiyev, N., Evermann, J., and Fettke, P. (2020). A novel
business process prediction model using a deep learn-
ing method. Bus. & Inf. Syst. Eng., 62(2):143–157.
Mehdiyev, N. and Fettke, P. (2021). Explainable artificial
intelligence for process mining: A general overview
and application of a novel local explanation approach
for predictive process monitoring. In Proc. of Inter-
pretable Artif. Intell.: A Perspective of Granular Com-
put., pages 1–28.
Polato, M., Sperduti, A., Burattin, A., and de Leoni, M.
(2018). Time and activity sequence prediction of busi-
ness process instances. Comput., 100(9):1005–1031.
Ribeiro, M. T., Singh, S., and Guestrin, C. (2016). “why
should i trust you?” explaining the predictions of any
classifier. In Proc. of the 22nd ACM SIGKDD Int.
Conf. Knowl. Discovery Data Min., pages 1135–1144.
Rizzi, W., Di Francescomarino, C., and Maggi, F. M.
(2020). Explainability in predictive process monitor-
ing: When understanding helps improving. In Proc.
of the Bus. Process Manage. Forum, pages 141–158.
Robeer, M. J. (2018). Contrastive explanation for machine
learning. Master’s thesis, Utrecht University.
Roscher, R., Bohn, B., Duarte, M. F., and Garcke, J. (2020).
Explainable machine learning for scientific insights
and discoveries. IEEE Access, 8:42200–42216.
Sagi, O. and Rokach, L. (2020). Explainable decision
forest: Transforming a decision forest into an inter-
pretable tree. Inf. Fusion, 61:124–138.
Teinemaa, I., Dumas, M., Rosa, M. L., and Maggi, F. M.
(2019). Outcome-oriented predictive process moni-
toring: Review and benchmark. ACM Trans. Knowl.
Discovery Data, 13(2):1–57.
Verenich, I., Dumas, M., La Rosa, M., and Nguyen, H.
(2019a). Predicting process performance: A white-
box approach based on process models. J. of Software:
Evol. Process, 31(6).
Verenich, I., Dumas, M., Rosa, M. L., Maggi, F. M., and
Teinemaa, I. (2019b). Survey and cross-benchmark
comparison of remaining time prediction methods in
business process monitoring. ACM Transactions on
Intelligent Systems and Technology, 10(4).
Warmuth, C. and Leopold, H. (2022). On the potential of
textual data for explainable predictive process moni-
toring. In Proc. of 3rd Int. Workshop on Leveraging
Mach. Learn. in Process Min., pages 1–12.
Weinzierl, S., Zilker, S., Brunk, J., Revoredo, K., Matzner,
M., and Becker, J. (2020). Xnap: Making lstm-based
next activity predictions explainable by using lrp. In
Proc. of Workshop on Artif. Intell. Bus. Process Man-
age., pages 129–141.
Wickramanayake, B., He, Z., Ouyang, C., Moreira, C., Xu,
Y., and Sindhgatta, R. (2022). Building interpretable
models for business process prediction using shared
and specialised attention mechanisms. Knowledge-
Based Syst., 248.
ICEIS 2023 - 25th International Conference on Enterprise Information Systems
406
