
An Analysis of Twitter Communities Related to the 2022 War in Ukraine
Karolina Sliwa
1 a
, Ema Ku
ˇ
sen
2 b
and Mark Strembeck
1,3,4 c
1
Vienna University of Economics and Business (WU), Vienna, Austria
2
University of Vienna, Faculty of Informatics, Austria
3
Secure Business Austria (SBA), Austria
4
Complexity Science Hub (CSH), Austria
Keywords:
Community Detection, Emotion Analysis, InfoMap, LIWC, Twitter, Ukraine War.
Abstract:
In this paper, we analyze a dataset including more than 189 million tweets related to the first month of the
2022 war in Ukraine. Our analysis especially focuses on communities of Twitter users and their collective be-
havior. In particular, we applied the InfoMap community detection algorithm and found on average 44079.63
communities of Twitter users per day. Our behavioral analysis especially focuses on the five largest daily
communities (i.e. the communities that have been detected for each day during the first month of the war).
We found that: 1) hashtags played an essential role in framing conversations, 2) communities often publicly
called on international organizations or offices such as @potus, @NATO, or @UN to aid in conflict resolution,
3) anger was the dominant emotion in all communities and 4) negative tweets spread wider than the positive
ones.
1 INTRODUCTION
People use online social media platforms to dissem-
inate messages throughout various natural and man-
made disasters. Data collected during such events
have the potential to reveal large-scale opinions and
stances towards the crisis (Ku
ˇ
sen and Strembeck,
2019; Stieglitz et al., 2017).
Social media users often form communities or
groups who interact with each other more frequently
than with the out-group members. As documented in
(Bedi and Sharma, 2016), community members will
often exhibit similar opinions, attitudes, and prefer-
ences. From the sociological point of view, such a
similarity stems from various behavioral, sociodemo-
graphic, and intra-personal characteristics. In gen-
eral, people tend to connect with the others who
are perceived as similar to themselves (“similarity
breads connection”), thereby forming homogeneous
networks (McPherson et al., 2001). A subgraph C is
said to be a community if each node of the subgraph
has more connections within its own community than
with the rest of the nodes in the corresponding net-
a
https://orcid.org/0009-0006-3271-0199
b
https://orcid.org/0000-0003-1145-6778
c
https://orcid.org/0000-0003-1680-9296
work (Flake et al., 2002).
Community detection has revealed hidden net-
work structures (Javed et al., 2018) and brought valu-
able insights into human behavior – from characteriz-
ing follower-followee structures in online social net-
works (Bedi and Sharma, 2016) to detecting social
botnets on Twitter based on the behavioral similarity
(Lingam et al., 2020a).
This paper presents an analysis of the tweets sent
during the first month of the 2022 War in Ukraine. In
particular, we aim to detect communities of interact-
ing users and characterize their behavior with respect
to the topics they predominantly talked about, asso-
ciated sentiments, and analyze their influence on the
Twitter discourse. Our findings indicate that in the
early weeks of the war, Twitter helped to frame the
conflict as an international crisis, negative emotions
were tweeted more frequently, with anger being the
most prominent emotion, and communities frequently
contacted foreign organizations for assistance in con-
flict resolution.
The remainder of this paper is structured as fol-
lows. In Section 2, we give an overview of com-
munity detection methods and emotions during man-
made crises. We then describe the research procedure
in Section 3.2. In Section 4, we report and discuss our
findings, before we conclude our paper in Section 5.
Sliwa, K., Kušen, E. and Strembeck, M.
An Analysis of Twitter Communities Related to the 2022 War in Ukraine.
DOI: 10.5220/0011980700003485
In Proceedings of the 8th International Conference on Complexity, Future Information Systems and Risk (COMPLEXIS 2023), pages 27-36
ISBN: 978-989-758-644-6; ISSN: 2184-5034
Copyright
c
2023 by SCITEPRESS – Science and Technology Publications, Lda. Under CC license (CC BY-NC-ND 4.0)
27

2 RELATED WORK
Community detection in large-scale online social net-
works is a prominent social network research area.
Given the increasing availability of large-scale net-
work data-sets, it has received much scientific atten-
tion, allowing us to discover latent communities and
their structures (Schaeffer, 2007). A social network’s
communities of users can be identified using graph
clustering algorithms. Commonly, divisions are made
to reduce connections across clusters while maximiz-
ing the number of connections (edges) within a cluster
(Schaeffer, 2007).
Recently, community detection has shown to
be quite beneficial in understanding the spread of
COVID-19 (Xueting Liao, 2021). Moreover, by mon-
itoring online social networks and virtual communi-
ties, it is possible to better understand and foresee
potential threats from extremist organizations (R
´
ıos
and Mu
˜
noz, 2012). Another use of community de-
tection might be found in identifying social botnet
communities on Twitter based on behavioral similar-
ity scores associated with the respective user accounts
(Lingam et al., 2020b). In addition, community de-
tection may also be utilized to enhance Bitcoin’s au-
ditability through de-anonymization (Xueshuo et al.,
2021).
Some of the most commonly used community de-
tection algorithms include the Louvain method, In-
fomap, Girvan-Newman algorithm, Label Propaga-
tion Algorithm, and HAC (Hierarchical Agglomera-
tive Clustering). The Louvain method was first pro-
posed by (Blondel et al., 2008). For example, it has
been used to identify communities in the political
sphere, such as in (S
´
anchez et al., 2016) where the
authors applied the algorithm on a sample of tweets
and users to identify similar political preferences. In
(Fani et al., 2016), identified users with comparable
temporal tendencies in their topics of interest. The
Girvan-Newman algorithm was first proposed by Gir-
van and Newman (Girvan and Newman, 2002). For
example, it was applied to identify and analyze com-
munities from a set of users who posted messages
on Twitter during three significant crisis events in
2011 (Gupta et al., 2012). The Label Propagation
Algorithm is based on the idea of propagating la-
bels through the network and grouping nodes with the
same label into communities (Raghavan et al., 2007).
HAC (Hierarchical Agglomerative Clustering) is an
unsupervised method that starts with each node as a
separate cluster and then groups them based on simi-
larity. The Infomap algorithm was proposed by (Ros-
vall and Bergstrom, 2008) and has also been applied
to detect Twitter communities, e.g. in a study of opin-
ions about human papillomavirus (HPV) vaccines.
3 RESEARCH APPROACH
The goal of this paper is to explore the communities
that emerged on Twitter during the early stage of the
2022 war in Ukraine. In particular, we analyze the
first month of the war (24 February 2022 until 25
March 2022).
3.1 Research Questions
Our analysis is guided by the following research ques-
tions.
RQ 1: Which Communities of Users Emerged in the
First Month of the War?
By applying a community detection algorithm
(see Section 3.2), we identify Twitter communities on
a daily basis for the first month of the war.
RQ 2: Which Narratives Are Dominant for Each
Community Over Time?
For each community, we explore the dominant
narratives. To detect narratives, we use the hash-
tags posted in each community. Moreover, we use
the count of original tweets posted by the community
members as a measure of the intensity of the contri-
bution to the Twitter discourse.
RQ 3: Which Emotions Dominate in Each Commu-
nity Over Time?
We explore the dominant emotions (anger, anx-
iety, sadness, as well as positive emotions) in each
community over time.
RQ 4: How Influential Are the Communities Over
Time?
For the purposes of this paper, we define influence
by the number of likes and retweets a tweet receives.
Both likes and retweets have the potential to boost the
visibility (and reach) of a tweet on the Twitter net-
work.
3.2 Procedure
Our research procedure is organized into the follow-
ing phases.
Phase 1: Data Extraction. To extract the data re-
lated to the war, we used the following list of hash-
tags and key terms
1
that were selected after monitor-
ing the discourse about the war on Twitter. Our data
1
#sanctionsrussia, #westandwithukraine, #clos-
ethesky, #closetheskyukraine, ”slavaukraini”, #Rus-
siaUkraineConflict, #StopWarRussia, #UkraineUn-
COMPLEXIS 2023 - 8th International Conference on Complexity, Future Information Systems and Risk
28

extraction resulted in 193,948,858 tweets in the En-
glish language.
Phase 2: Data Pre-Processing.
Next, we removed duplicate entries, resulting in a
dataset consisting of 189,854,201 unique tweets. We
then processed all unique tweets using the Linguis-
tic Inquiry and Word Count tool (LIWC) to detect
the presence of three emotions (sadness, anxiety, and
anger), as well as the intensity of positive and nega-
tive tones in each tweet.
Phase 3: Derivation of the Communication Net-
work. To derive the communication network, we
followed the @-mentioning traces in tweets and
recorded the following information: source (screen-
name of a user who authored a tweet that contains
an @mention), target (screenname of a user being
mentioned), dominant emotion, dominant emotional
tone, and time stamp. Our network is directed and
weighted, where the weight represents the number of
messages exchanged between a pair of nodes. In to-
tal, our network for the first month of the war consists
of 4,333,571 nodes and 50,544,405 edges.
Phase 4: Community Detection. To detect com-
munities, we used the Python implementation of In-
fomap
2
. Infomap (Rosvall and Bergstrom, 2008) is a
clustering algorithm that is based on the map equation
(Rosvall et al., 2009).
Infomap was applied to our daily communica-
tion networks. In each iteration of the algorithm, we
recorded a community identifier (a numeric label),
a list of nodes belonging to each community, and a
tweet ID corresponding to the author node assigned
to each community.
4 RESULTS
The daily volume of English-language tweets in the
first month of the war is shown in Figure 1, with an av-
erage of about 560K tweets per day. We assume that
users will be less engaged and the number of tweets
will decline the longer the war continues. Our find-
ings support this assumption.
derAttack, #UkraineCrisis, #RusyaUkrayna, #Russi-
aUkraine, #ukraine russia, #PrayForUkraine, Ukraine,
putin, @KremlinRussia E, #standwithukraine, @Ze-
lenskyyUa, Ukrainian, #russianinvasion, #StopRus-
sianAggression, #StopRussia, #PrayingForUkraine, Kyiv,
#stopputinnow, #ukrainerussianwar , #putinswar, zelenskiy,
#ukrainerefugees, #ukraineinvasion, #fightforukraine,
#ukrainewillresist, #supportrussia, #proxywar, #Russian-
Army, #ukrainazi, #istandwithrussia, #NoWarWithUkraine,
#WarinUkraine, #UkraineRussiaWar, #UkraineWar
2
https://mapequation.github.io/infomap/python/
The first peak in the volume of tweets is shown
at the beginning of the war between February 24 and
February 26 where the average number exceeds 1 mil-
lion tweets per day. A second peak around March
1 (again reaching over 1 million tweets) corresponds
to requests to exclude Russia from the UN Security
Council and mobilize military and humanitarian aid
for Ukraine. A Russian attack on the Maternity Hos-
pital in Mariupol on March 10 coincides with the third
peak. Since March 17, the daily average number of
tweets stabilized at 286K (see Figure 1).
Figure 1: Frequency of English-language tweets.
Similar trends are also observable in a volume of
@mentioning tweets. Figure 2 shows the daily num-
ber of nodes (including tweet authors and those being
mentioned in a tweet) as well as edges (number of
messages sent).
28-02 07-03 14-03 21-03
28-02 07-03 14-03 21-03
DATE
DATE
NODES
EDGES
(in million)
750K
500K
250K
4
3
2
1
Figure 2: Nodes and Edges in daily networks.
Given that the users are exchanging informa-
tion/opinion and expressing support, a direct engage-
ment is anticipated (see, e.g., the attack on the West-
gate mall in Kenya in 2013 (Simon et al., 2014) or the
2011 Norway terrorist attack(Steensen, 2018)).
An Analysis of Twitter Communities Related to the 2022 War in Ukraine
29
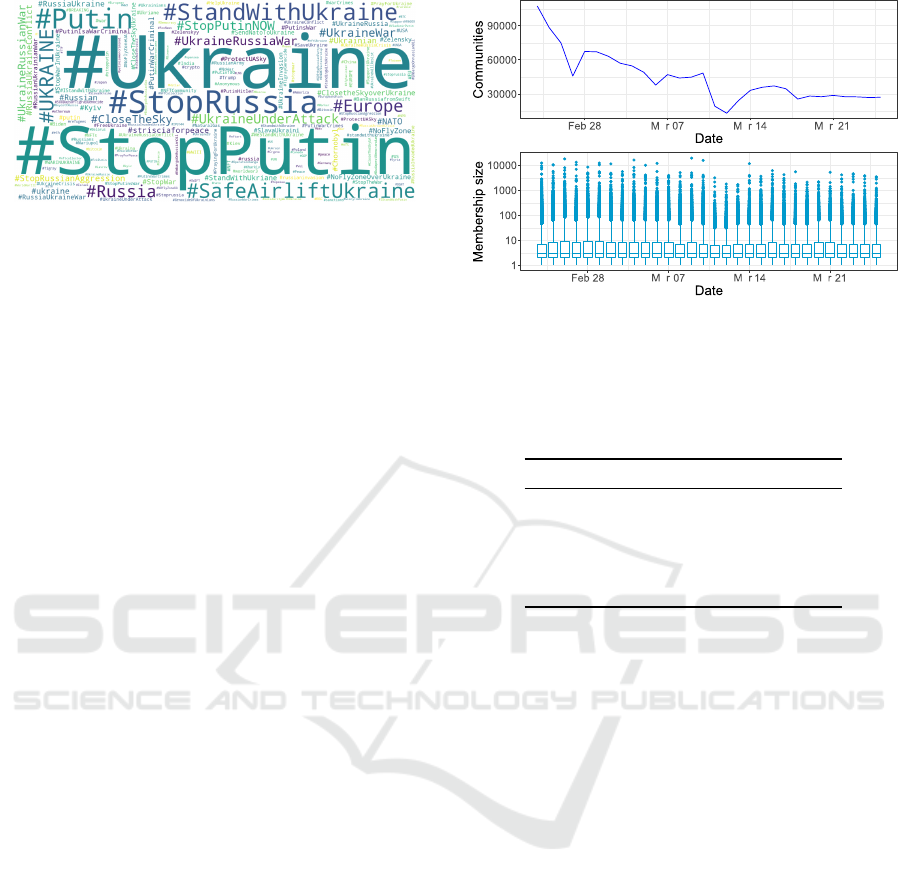
Figure 3: Hashtag cloud of the most frequently used hash-
tags among all communities based on their occurrence.
4.1 Emergence of Communities Over
the 4-Week Period (RQ1)
In total, we identified 1,313,143 Twitter communities
over the entire 4-week observation period, with on av-
erage µ=43771.43, sd=21386.3 communities emerg-
ing per day. Figure 4 shows the daily community
count and membership size. On initial inspection, it
is evident that the number of communities decreases
over time, while the average membership size per
community does not follow this trend. For exam-
ple, on the first day of the war, there were on aver-
age 8.93 (sd=70.9, median=3) members per commu-
nity and 107,364 unique communities. The member-
ship size increased to 9.60 (sd=68.3, median=3) and
10.6 (sd=89.9, median=3) on the second and third day
of the war, while the community count dropped to
88,408 and 74,910, respectively.
An increase in the membership size (yet, a de-
crease in the number of communities) is observable
for the entire 14-day period since the start of the
war. In the remaining observation period, commu-
nity membership only slightly decreased to an av-
erage of 8.59 (sd=43.21, median=3) on the 25
t
h of
March 2022.
In addition, we also observed an increase in the
membership size of the largest communities over the
first two weeks (e.g., max(members)
day1
= 12,286;
max(members)
day3
= 17,882, max(members)
day9
=
16,198; max(members)
day14
= 19,260), while the
remaining two weeks showed communities with a
smaller membership size.
The Twitter communities quickly adopted an in-
ternational perspective, framing the issue as one of
global significance. Even though the war is between
Ukraine and Russia, the dominant hashtags were writ-
ten in English. The word cloud in Figure 3 was
created using tweets from all communities. Table 1
refers to the hierarchy of the most used hashtags. The
most prominent hashtags include #StopPutin, #Sto-
pRussia, and #Putin. The image also shows the pres-
ence of hashtags oriented towards geographical loca-
tion such as #Ukraine with 8,9% occurrence and a
a a a
a a a
Figure 4: Daily community count and membership size.
hashtag showing social support #StandWithUkraine
with 3,11%.
Table 1: The most frequently used hashtags among all com-
munities based on their percentage occurrence.
Hashtags (#) # count %
#Ukraine 4 483 479 8.87
#StopPutin 4 125 594 8.25
#StopRussia 3 182 749 6.36
#Putin 2 348 161 4.69
#StandWithUkraine 1 559 353 3.11
4.2 Dominant Narratives of
Communities (RQ2)
In this section, we focus our analysis on the five
largest communities (based on their membership size)
on each day during our observation period (5 x 28
days = 140 communities). It is important to note
that community labels do not match across days, e.g.,
community 1 on day 1 is not the same as community
1 on day 2. This is due to the community detection
procedure that was ran separately for each observa-
tion day. We address this issues in Section 4.5.
To gain a better understanding of what each of the
140 communities tweeted about, we compiled a list
of the most frequently used hashtags for each com-
munity. Figure 6 depicts the most prevalent hash-
tag within each group, scaled by the frequency at
which they occur. When we look at the most com-
monly used hashtags in tweets during the first four
weeks of the war, we can observe that #Ukraine is
the most popular. Next, we can identify a group
of hashtags related to supporting Ukraine, such as
#IStandWithUkraine, #SolidarityWithUkraine, along
with #HelpUkrainianRefugees at the beginning of the
war, and #YouTubeKyiv, that urged the Ukrainian
branch of YouTube to relocate its headquarters from
COMPLEXIS 2023 - 8th International Conference on Complexity, Future Information Systems and Risk
30
24-02
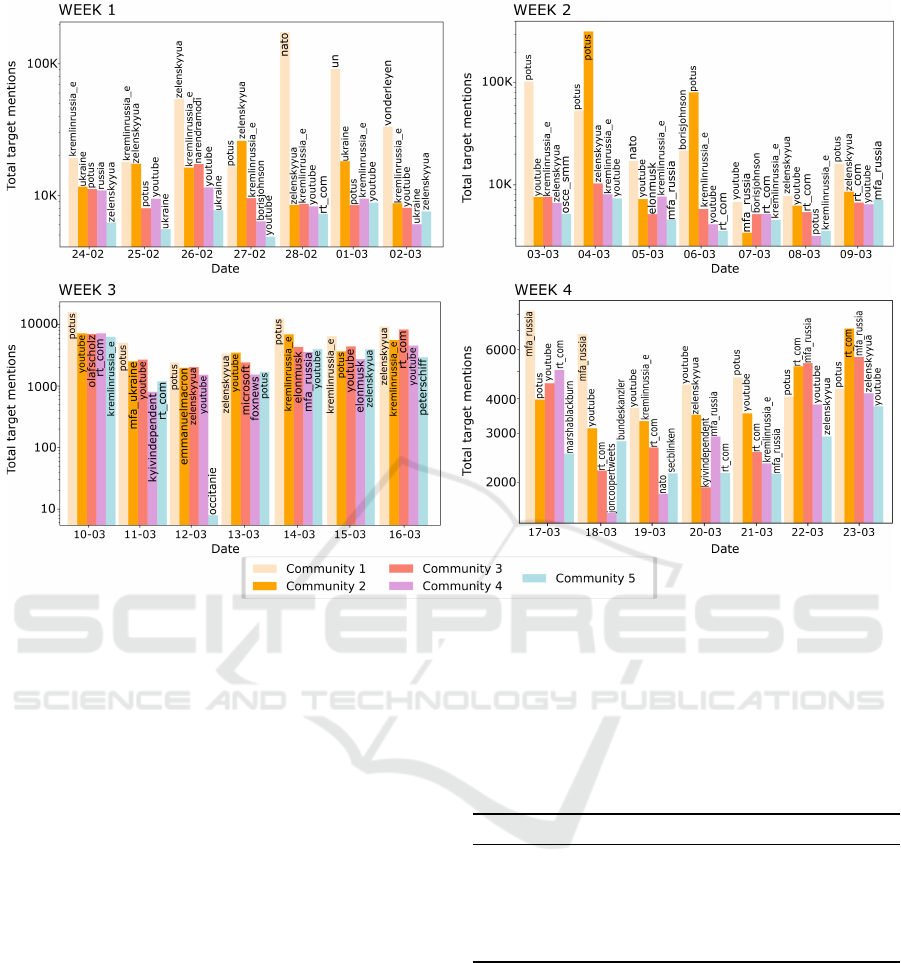
Figure 5: Top Target Mentions per Community.
Moscow to another city.
Another set of hashtags with similar narratives
relates to several anti-war and anti-Putin actions:
#StopPutin, #Putin,#StopRussia, #PutinIsaWarCrim-
inal, #StopWar, #EmbargoOnrussianOil.
Another useful piece of information we may ex-
tract from the data-set are the tagged users in tweets
(via @username). The accounts who are mentioned
most frequently by each community are displayed in
Figure 5. The majority of references concern organi-
zations and offices including the POTUS (President of
the United States), NATO, UN, Ursula von der Leyen
(@vonderleyen), and Boris Johnson (@borisjohn-
son). The most tagged account during the first 4
weeks of the war is @potus (see Table 2).
Messages referring to European or US politicians
typically stress the Ukraine’s need for weapons and
humanitarian aid, as in the following tweet: Ukraine
needs weapons and humanitarian assistance to de-
fend against #Putin. Stop innocent civilian deaths.
@POTUS , provide #SafeAirliftUkraine #StopPutin.
Tagging @rtcom (Russia Today, a Russian state-
affiliated media outlet) is mainly associated with re-
stricting ”Russia Today” accounts in major European
nations. Accounts mentioning @zelenskyyua fre-
quently express their respect, support, and prayers for
the Ukrainian president. For instance, @ZelenskyyUa
i admire your bravery your honor President Zelenzky
you stand still and never surrender nappy salute to
you or @ZelenskyyUa The world is with you. Russia
is a terrorist state..
Table 2: Top five most mentioned targets.
Date Target Mentions Hashtag (#) # count
04-03 @potus 319,043 #Putin 659,464
28-02 @nato 174,087 #StopPutin 646,721
03-03 @potus 102,935 #StopPutin 206,164
01-03 @un 91,318 #StopPutin 449,382
06-03 @potus 80,777 #Putin 159,874
4.3 Dominant Emotions in
Communities Over Time (RQ3)
In this section, we investigate the emotional tone of
the tweets in the top five communities using the Lin-
guistic Inquiry and a Word Count tool (LIWC) (Pen-
nebaker et al., 2007). Figure 7 represents a heatmap of
the average tone of each community. LIWC emotion
scores less than 50 indicate a more negative emotional
tone. For comparison, reference values for each mea-
sure can be accessed on LIWC’s website ((Cohn et al.,
An Analysis of Twitter Communities Related to the 2022 War in Ukraine
31
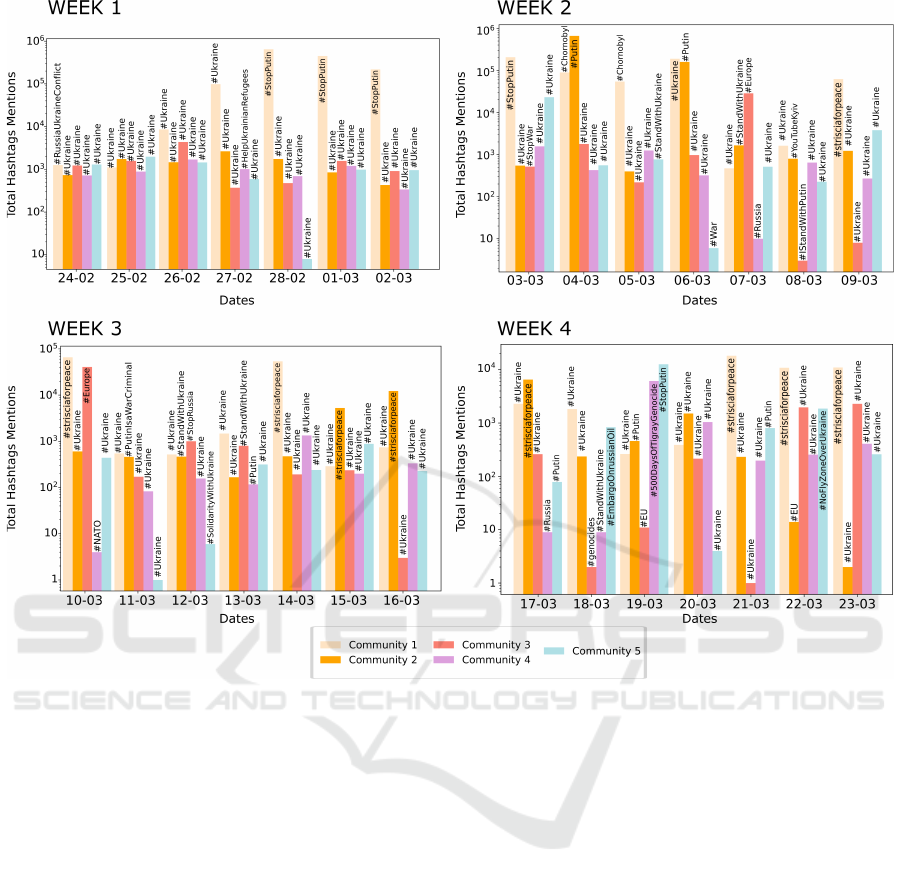
Figure 6: Hashtag mentions per community in the course of 4 weeks of the war.
2004), (Pennebaker et al., 2003)). It is evident that
throughout the first four weeks of the conflict, there
was a noticeable presence of negative emotions. The
average emotional tone over all communities is 34.94.
The most negatively-inclined communities
use hashtags and mentions affiliated with Rus-
sia (e.g. #StopRussia), #Putin, and #StopPutin,
e.g.,@UN@POTUS@NATO the more you wait, the
more of our people die. Everyday. SO CLOSE
THE SKY OVER UKRAINE! WE NEED ACTIONS
NOW! #ClosetheSkyoverUkraine #ClosetheSky
#StandWithUkraine #StopRussia #NoFlyZoneUA
#StopRussianAggression #StopBelarusianAggres-
sion. In contrast, there are only a few communities
that showed a slightly positive tone during the first
four weeks. An example can be seen on February
27, when the most frequently mentioned target and
hashtag were @potus and #Ukraine, respectively.
Other positive communities are mostly associated
with @potus, e.g., @POTUS @USDoDGov It’s sim-
ple. Get them planes and rockets, and Ukraine will
handle the rest. They have pilots. #PlanesforUkraine
#RocketsForUkraine #StandwithUkraine.
Following the dominant negative tone in the
largest communities, we further examined how nega-
tive emotions such as anxiety, anger, and sadness were
distributed throughout selected communities over the
first four weeks of the war. Table 3 displays three neg-
ative emotions as well as their mean value. The mean
value of each emotion was derived by taking into ac-
count all of the expressed sentiment scores for each
emotion. The consolidated mean reveals that anger
was the emotion expressed most often over the entire
observation period. Anger had a consolidated mean
of 1.9945%, which was more than 6 times higher as
compared to any other emotion. This suggests that
during the start of the Ukraine war, communities dis-
played more anger on social media than anxiety or
sadness. This observation is in line with other events
of extreme violence, such as the 9/11 terrorist attack
(Lee et al., 2015) or the Boston Marathon bombing
(Back et al., 2010).
COMPLEXIS 2023 - 8th International Conference on Complexity, Future Information Systems and Risk
32

17-03 18-03 19-03 20-03 21-03 22-03 23-03
1
2
3
4
5
1
2
3
4
5
1
2
3
4
5
1
2
3
4
5
WEEK 1
WEEK 3
WEEK 2
WEEK 4
24-02 25-02 26-02 27-02 28-02 01-03 02-03
08-0303-03 04-03 05-03 06-03 07-03 09-03
10-03 11-03 12-03 13-03 14-03 15-03 16-03
Figure 7: Heatmap of tone per community in the course of 4 weeks of the war.
Table 3: Mean results of selected communities in 4 weeks.
Week Anxiety Anger Sadness
W1 0.2815 1.8178 0.2896
W2 0.2863 2.6099 0.2527
W3 0.3079 1.7724 0.2917
W4 0.2863 1.7782 0.2885
4.4 Influence of Communities Over
Time (RQ4)
To investigate the impact of the communities, we as-
sessed the total number of likes and retweets to the
number of messages posted by community members.
Figure 8 shows the results of this analysis. In most
communities, the number of likes outnumbers the
number of retweets. Few communities, though, dis-
play a significant disproportion in the number of likes
and retweets. The first example is from February 28,
when tweets within a community received fewer likes
but more retweets. A similar pattern can be observed
when Russian Today is the target of a tweet. In addi-
tion, the most frequently retweeted content was as-
sociated with a negative tone. Table 4 shows the
emotional tone and number of retweets for the most
retweeted messages.
For example, more than 8 million people have
retweeted a message asking European countries to
block Russia Today. On February 26, the community
that received the most likes was community number 1.
The most influential member within this community
was @zelenskyyua, who had a 6,390,407 followers
and received around 250K likes for a message which
read: Had a phone conversation with @BorisJohn-
son. Grateful to the British Prime Minister for his
position, new decisions to enhance the combat ca-
pabilities of the Ukrainian army. Agreed on further
joint steps to counter the aggressor.. This message
expresses gratitude towards the British Prime Min-
ister for his support of Ukraine and mentions new
decisions to boost the military capabilities of the
Ukrainian army.
Table 4: Most retweeted messages.
Date Target Tone Retweets Likes
23-03 @rt com 25,80 8,654,223 41
09-03 @rt com 25,87 6,455,412 183
16-03 @rt com 25,81 5,485,776 65
10-03 @rt com 25,85 5,478,833 123
The link between the emotional tone of a tweet’s
content and its chance of getting retweeted on Twitter
An Analysis of Twitter Communities Related to the 2022 War in Ukraine
33

WEEK 1
Total number of likes
Total number of retweets
Date Date
WEEK 3
Total number of likes
Total number of retweets
Date
Total number of likes
Total number of retweets
Date
Total number of likes
Total number of retweets
WEEK 2
WEEK 4
Figure 8: Likes and retweet count per community.
has been the subject of several studies. For example,
a recent study by (Sch
¨
one et al., 2021) explored the
spread of emotions on Twitter in the aftermath of pos-
itive and negative political situations and discovered
that negative emotions were more likely to be shared
and disseminated among users, supporting our find-
ings.
Table 5 shows that the sum of retweets for nega-
tive messages is substantially higher than for positive.
Table 5: Number of positive and negative messages (excl.
neutral messages) and the sum of retweets for both.
Week Positive Retweets
W1 5,753,639 6,038,874
W2 4,026,927 3,401,901
W3 2,069,306 1,882,124
W4 1,869,300 1,733,706
Week Negative Retweets
W1 6,125,831 23,530,321
W2 6,064,396 18,372,479
W3 2,632,016 9,041,539
W4 2,455,817 9,467,937
4.5 Limitations
Although community detection in Twitter data is an
important approach for analyzing the structure and
behavior in online social networks, it does have cer-
tain limitations. One of our study’s limitations is that
the data is restricted to English-language tweets. This
makes detecting underrepresented communities (ev-
eryone who does not send English language tweets)
in the data challenging to impossible. Furthermore,
hashtag sampling might reveal insightful perspectives
into certain cultural and sociopolitical discussions.
However, it introduces its own set of biases (Tufekci,
2014) and is a key constraint of our study.
5 CONCLUSION
In this paper, we analyzed communities that emerged
during the first month of the 2022 war in Ukraine. The
findings underscore the importance of Twitter as a
medium for communication among communities dur-
ing the early stages of the war in Ukraine. The use
of hashtags was pivotal in structuring conversations,
with generic hashtags such as #StopPutin and #IS-
tandwithUkraine effectively portraying the conflict as
COMPLEXIS 2023 - 8th International Conference on Complexity, Future Information Systems and Risk
34

a global crisis. We found that communities using
hashtags in relation to anti-war and anti-Putin senti-
ments tend to exhibit a more negative tone than those
communities associated with expressions of support
for Ukraine. Additionally, the study revealed that
there was a concentration of communities around spe-
cific targets. International organizations and offices
such as @potus, @NATO, and @UN were frequently
mentioned by users and were typically addressed as
potential facilitators of a potential conflict resolution.
Moreover, our findings indicate that the reac-
tions within the top 5 communities were predomi-
nantly characterized by negative emotions, particu-
larly anger, and tend to spread more quickly and more
widely on Twitter than positive emotions. In our fu-
ture work, we plan to extend this study by applying
a temporal community detection algorithm to identify
the dynamics evolution of network communities and
also provide a more fine-grained analysis of related
user behavior.
REFERENCES
Back, M. D., K
¨
ufner, A. C., and Egloff, B. (2010). The emo-
tional timeline of september 11, 2001. Psychological
Science, 21(10):1417–1419.
Bedi, P. and Sharma, C. (2016). Community detection in
social networks. WIREs Data Mining and Knowledge
Discovery, 6(3):115–135.
Blondel, V. D., Guillaume, J.-L., Lambiotte, R., and Lefeb-
vre, E. (2008). Fast unfolding of communities in large
networks. Journal of statistical mechanics: theory
and experiment, 2008(10):P10008.
Cohn, M. A., Mehl, M. R., and Pennebaker, J. W. (2004).
Linguistic markers of psychological change surround-
ing september 11, 2001. Psychological science,
15(10):687–693.
Fani, H., Zarrinkalam, F., Bagheri, E., and Du, W. (2016).
Time-sensitive topic-based communities on twitter. In
Canadian conference on artificial intelligence, pages
192–204. Springer.
Flake, G. W., Lawrence, S., Giles, C. L., and Coetzee, F. M.
(2002). Self-organization and identification of web
communities. Computer, 35(3):66–70.
Girvan, M. and Newman, M. E. (2002). Community struc-
ture in social and biological networks. Proceedings of
the national academy of sciences, 99(12):7821–7826.
Gupta, A., Joshi, A., and Kumaraguru, P. (2012). Identi-
fying and characterizing user communities on twitter
during crisis events. In Proceedings of the 2012 work-
shop on Data-driven user behavioral modelling and
mining from social media, pages 23–26.
Javed, M. A., Younis, M. S., Latif, S., Qadir, J., and Baig,
A. (2018). Community detection in networks: A mul-
tidisciplinary review. Journal of Network and Com-
puter Applications, 108:87–111.
Ku
ˇ
sen, E. and Strembeck, M. (2019). An analysis of
emotion-exchange motifs in multiplex networks dur-
ing emergency events. Applied Network Science, 4.
Lee, J., Rehman, B. A., Agrawal, M., and Rao, H. R. (2015).
Sentiment analysis of twitter users over time: the case
of the boston bombing tragedy. In Workshop on E-
Business, pages 1–14. Springer.
Lingam, G., Rout, R. R., Somayajulu, D., and Das, S. K.
(2020a). Social botnet community detection: A novel
approach based on behavioral similarity in twitter net-
work using deep learning. In Proceedings of the 15th
ACM Asia Conference on Computer and Communica-
tions Security, ASIA CCS ’20, page 708–718, New
York, NY, USA. Association for Computing Machin-
ery.
Lingam, G., Rout, R. R., Somayajulu, D., and Das, S. K.
(2020b). Social botnet community detection: A novel
approach based on behavioral similarity in twitter net-
work using deep learning. In Proceedings of the 15th
ACM Asia Conference on Computer and Communica-
tions Security, ASIA CCS ’20, page 708–718, New
York, NY, USA. Association for Computing Machin-
ery.
McPherson, M., Smith-Lovin, L., and Cook, J. M. (2001).
Birds of a feather: Homophily in social networks. An-
nual review of sociology, pages 415–444.
Pennebaker, J. W., Booth, R. J., and Francis, M. E. (2007).
Linguistic inquiry and word count: Liwc [computer
software]. Austin, TX: liwc. net, 135.
Pennebaker, J. W., Mehl, M. R., and Niederhoffer, K. G.
(2003). Psychological aspects of natural language use:
Our words, our selves. Annual review of psychology,
54(1):547–577.
Raghavan, U. N., Albert, R., and Kumara, S. (2007).
Near linear time algorithm to detect community struc-
tures in large-scale networks. Physical review E,
76(3):036106.
R
´
ıos, S. A. and Mu
˜
noz, R. (2012). Dark web portal overlap-
ping community detection based on topic models. In
Proceedings of the ACM SIGKDD Workshop on Intel-
ligence and Security Informatics, ISI-KDD ’12, New
York, NY, USA. Association for Computing Machin-
ery.
Rosvall, M., Axelsson, D., and Bergstrom, C. (2009). The
map equation. Eur. Phys. J. Spec. Top., 178:13–23.
Rosvall, M. and Bergstrom, C. T. (2008). Maps of random
walks on complex networks reveal community struc-
ture. Proceedings of the national academy of sciences,
105(4):1118–1123.
S
´
anchez, D. L., Revuelta, J., Prieta, F. D. l., Gil-Gonz
´
alez,
A. B., and Dang, C. (2016). Twitter user clustering
based on their preferences and the louvain algorithm.
In International Conference on Practical Applications
of Agents and Multi-Agent Systems, pages 349–356.
Springer.
Schaeffer, S. E. (2007). Graph clustering. Computer Sci-
ence Review, 1(1):27–64.
Sch
¨
one, J. P., Parkinson, B., and Goldenberg, A. (2021).
Negativity spreads more than positivity on twitter af-
An Analysis of Twitter Communities Related to the 2022 War in Ukraine
35

ter both positive and negative political situations. Af-
fective Science, 2(4):379–390.
Simon, T., Goldberg, A., Aharonson-Daniel, L., Leykin, D.,
and Adini, B. (2014). Twitter in the cross fire—the
use of social media in the westgate mall terror attack
in kenya. PloS one, 9(8):e104136.
Steensen, S. (2018). Tweeting terror: An analysis of the
norwegian twitter-sphere during and in the aftermath
of the 22 july 2011 terrorist attack. In Social media use
in crisis and risk communication. Emerald Publishing
Limited.
Stieglitz, S., Bunker, D., Mirbabaie, M., and Ehnis, C.
(2017). Sense-making in social media during extreme
events. Journal of Contingencies and Crisis Manage-
ment, 26.
Tufekci, Z. (2014). Big questions for social media big data:
Representativeness, validity and other methodological
pitfalls. In Eighth international AAAI conference on
weblogs and social media.
Xueshuo, X., Jiming, W., Junyi, Y., Yaozheng, F., Ye, L.,
Tao, L., and Guiling, W. (2021). Awap: Adaptive
weighted attribute propagation enhanced community
detection model for bitcoin de-anonymization. Ap-
plied Soft Computing, 109:107507.
Xueting Liao, Danyang Zheng, X. C. (2021). Coronavirus
pandemic analysis through tripartite graph clustering
in online social networks. Big Data Mining and Ana-
lytics, 4(4):10.
COMPLEXIS 2023 - 8th International Conference on Complexity, Future Information Systems and Risk
36
