
Reducing IoT Big Data for Efficient Storage and Processing
Eleftheria Katsarou and Stathes Hadjiefthymiades
a
Department of Informatics and Telecommunications, National and Kapodistrian University of Athens,
Panepistimioupolis, Athens, Greece
Keywords: Content Distribution Networks, Internet of Things.
Abstract: We focus on the very important problem of managing IoT data. We consider the data gathering process that
yields big data intended for CDN/cloud storage. We aim to reduce big data into small data to efficiently exploit
available storage without compromising their usability and interpretation. This reduction process is to be
performed at the edge of the infrastructure (IoT edge devices, CDN edge servers) in a computationally
acceptable way. Therefore, we employ reservoir sampling, a method that stochastically samples data and
derives synopses that are finally pushed and maintained in the available storage capability. We implemented
the discussed architecture using reverse proxy technologies and in particular the Varnish open source server.
We provide details of our implementation and discuss critical parameters like the frequency of synopsis
generation and CDN/cloud storage.
1 INTRODUCTION
In contemporary Internet, Content Delivery Networks
(CDN) are the infrastructures intended for optimally
delivering content to users, providing high
performance and availability services. The
architecture of such networks has been adapted to the
geographical distribution of servers around the globe.
Caching-Replication technology is used to expedite
content delivery. Nevertheless, the challenges on the
World Wide Web (WWW) have become even greater
and the content more complex. Nowadays, CDNs
need to cope with multimedia streaming, on-demand
video, etc.
Moreover, we live in the age of the Internet of
Things (IoT). The IoT has been promoted as a new
technology that connects objects, such as sensors,
mobile phones, etc., over the Internet. Smart city,
healthcare and transportation are some of the standard
services supported by IoT technology. Such multiple
data sources produce data with great heterogeneity
variable speed and quality from different types of data
stream, that constitute big data’s properties of variety
and variability. Obviously, a huge amount of data,
described by the “volume” of big data, is generated
for delivery, processing, and storage in the context of
IoT infrastructures. Furthermore, the velocity
a
https://orcid.org/0000-0002-8663-3049
property of big data is defined by the entry frequency
of data streams in big data systems. The usefulness of
big data determines its value, as long as its veracity is
assured by reliable sources and big data systems.
Such data need to travel through a CDN (or a
cloud facility), in order to be processed and stored,
leading to the required evolution of CDN (further to
the multimedia, dynamic service provision cases).
Therefore, new (CDN) features are required to meet
these challenges. Requirements should be high
scalability, efficient storage and delivery, and
caching. In the field of scalability demands, which
refer to IoT technology, integrated architectures
should be developed.
To cope with these challenges we investigate an
architecture that turns big data into small data at the
edge of the CDN (infrastructure). Our work is based
on solid stochastic sampling techniques like the
reservoir sampling. We study the operation of the
algorithm in relation to infinite IoT streams seen /
ingested at the CDN. We finally present our
implementation efforts that port the considered
architecture (and associated operational parameters)
into the Varnish CDN support server (DYI – do it
yourself CDN).
The paper is structured as follows: In section 2 we
refer to the prior work referring to the relative subject.
226
Katsarou, E. and Hadjiefthymiades, S.
Reducing IoT Big Data for Efficient Storage and Processing.
DOI: 10.5220/0011983900003482
In Proceedings of the 8th International Conference on Internet of Things, Big Data and Security (IoTBDS 2023), pages 226-230
ISBN: 978-989-758-643-9; ISSN: 2184-4976
Copyright
c
2023 by SCITEPRESS – Science and Technology Publications, Lda. Under CC license (CC BY-NC-ND 4.0)

The edge computing paradigm is analyzed in section
3, where we explain the use of reservoir sampling
(algorithm R) in the proposed scheme and we try to
quantify the era duration of an event. In section 4 we
describe a few implementation issues such as the use
of Varnish Cache. Section 5 describes the metrics and
results of our simulation. Finally, the paper is
concluded in section 6.
2 RELATED WORK
Related work primarily refers to the problem of
turning Big data into small data to meet scalability
requirements in different infrastructure types.
Di Martino, Aversa, Cretella, Esposito &
Kolodziej (2014) survey the developments on Cloud
Computing concerning the big data issue with a
critical analysis and show the further direction to the
new generation multi-datacenter cloud architectures
for storage and management. It presents several cloud
platforms offering big data-oriented services, like
PiCloud, Google BigQuery, Amazon Elastic
MapReduce, etc. Furthermore, it makes an attempt to
classify the services related to big data management,
like data collection, curation, integration and
aggregation, storage, and analysis and interpretation,
among the different cloud providers. It concludes that
distributed data applications across geographically
distributed data centers appear as a good solution for
the efficient management of big data in the clouds.
The researchers, Tao, Jin, Tang, Ji & Zhang
(2020), try to solve the problem of network resource
redundancy and overload in the IoT architecture.
They propose a model of cloud edge collaborative
architecture that combines cloud and edge computing,
centralized and decentralized, respectively, trying to
fulfill the requirements of computing power and real-
time analysis of big local data. Moreover, they
combine the complex network and data access with
the management requirements of the IoT. The Power
IoT architecture uses four layers: the perception layer,
the network layer, the platform layer, and the
application layer. Nevertheless, there is a
management collaboration and coordination of
computing tasks problem between the platform layer,
application layer and the edge computing network,
not to mention the increasing cost of construction,
operation, and maintenance of the system.
The authors Zhou, Liu & Li (2013) examine the
net effect of using deduplication for big data
workloads, considering the increasing complexity of
the data handling process, and elaborate on the
advantages and disadvantages of different
deduplication layers (local and global). The term
‘local deduplication layer’ refers to the fact that
deduplication is only used within a single VM, and
the relevant mechanism can detect replicas within a
single node. The term ‘global deduplication layer’
means that the deduplication technique is applied
across different VMs. In the first case, different VMs
are assigned to different ZFS (deduplication tool)
pools, and in the second case, all VMs are assigned to
the same ZFS pool. Local deduplication cannot fully
remove all the replicas. This fact leads to a negative
performance with the increase of active datasets. The
performance becomes slightly better when more
nodes are deployed because local deduplication can
leverage the parallelism for hash computation and
indexing. It also maintains data availability. On the
contrary, global deduplication has the opposite results
and presents a positive performance.
Xia et al. (2011) present a near-exact
deduplication system, named SiLo, which, under
various workload conditions, exploits similarity and
locality in order to achieve high throughput and
duplicate elimination and, at the same time, low RAM
usage. SiLo is trying to exploit similarity by grouping
correlated small files and segmenting large files. In
addition, it tries to exploit locality in the backup
stream by grouping contiguous segments into blocks
in order to capture duplicate or similar data that is
missing during similarity detection.
Hillman, Ahmad, Whitehorn, & Cobley (2014)
elaborate on a near real-time processing solution in
the sector of big data preprocessing with the use of
Hadoop and Map Reduce. The basic idea is to use
parallel compute clusters and programming methods
in order to deal with large data volumes and
complexity in a reasonable time frame. The paradigm
uses the vast volume of data that is generated in the
field of genes and their product proteins, which must
be preprocessed. Hadoop is used for handling the raw
data while Java code and MapReduce are used for
data preprocessing in order to identify 2D and 3D
peaks in Gaussian curves produced by the data of a
mass spectrometer. As a result, the datasets are
greatly reduced by a Map task and the completion
times are greatly reduced compared to a conventional
PC-based process.
Using preprocessing tools and a cloud
environment, the authors Sugumaran, Burnett &
Blinkmann (2012) were able to develop and
implement a web-based LiDAR (Light Detection and
Ranging) data processing system. The
implementation of this system, called CLiPS (Cloud
Computing-based LiDAR Processing System),
showed that the processing time for three types of
Reducing IoT Big Data for Efficient Storage and Processing
227
LiDAR data decreases as the computer power
increases, while the cloud computing cost is
affordable for any of the users. The CLiPS uses
ESRI’s ArcGIS server, Amazon Elastic Compute
Cloud (Amazon EC2), and other open source spatial
tools. The specified approach showed the advantages
of cloud computing concerning performance and
time. Also, storing all the LiDAR data on the cloud is
not cost-effective in comparison to the processing
needed.
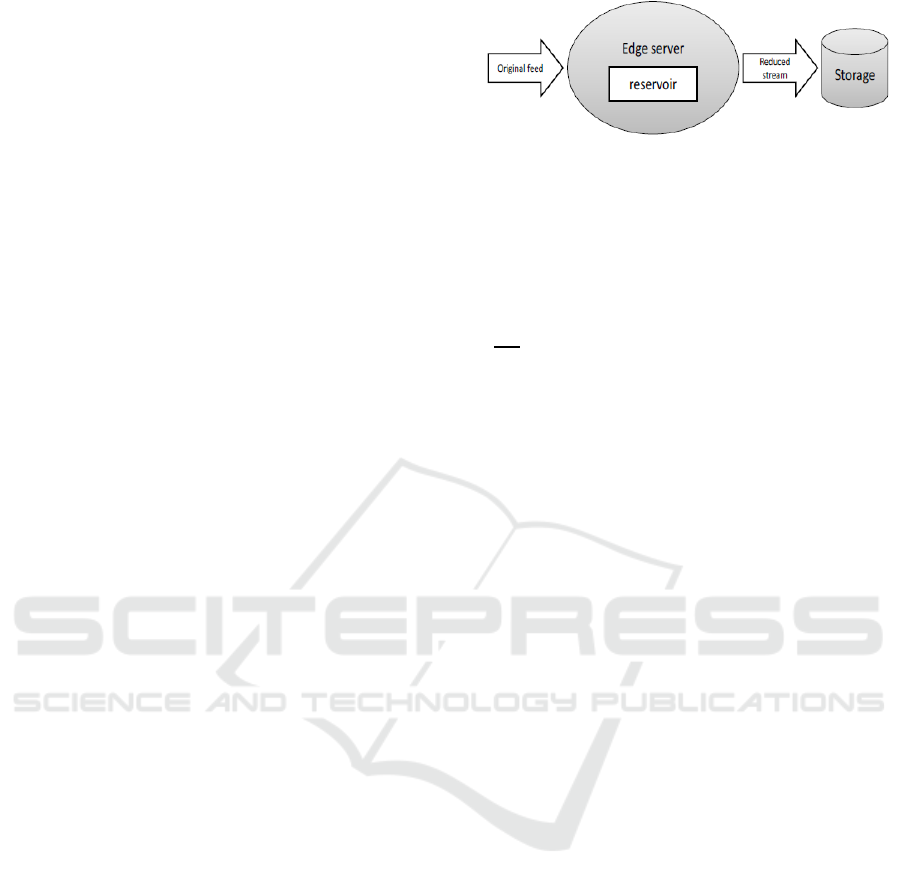
3 PROPOSED SOLUTION
Our solution for IoT data ingestion leverages the edge
computing paradigm. In particular, we assume that
edge computing units implement a systematic and
efficient reduction process that turns the huge volume
or harvested data (sampling and aggregation by IoT
islands) into a manageable subset of representative
synopses. Therefore, we consider two important
aspects for the implementation of the respective
scheme (a) the algorithmic framework that can
support the needed reduction and the associated
operational parameters and (b) the specific
implementation technologies that will support the
said functionality in the context of existing systems
like CDNs.
3.1 Reservoir Sampling
Data fed into the CDN (univariate IoT measurements)
undergo stochastic sampling at the edge of the
infrastructure. Specifically we employ the simple R
Algorithm (Vitter, 1985) to demonstrate the
feasibility of the solution while assessing its technical
and performance merits. R is a reservoir sampling
algorithm that relies heavily on a properly
dimensioned buffer (array of IoT data of fixed size k)
maintained at the edge server. Inbound data, treated
sequentially, may be dropped (and not further
advanced through the infrastructure) or substitute
(update) the contents of the buffer according to a
random experiment.
The length of the incoming data stream is
considered infinite. The size of the reservoir (buffer)
is r and should be selected so as to serve problem-
specific requirements (e.g., minimize the probability
of omitting important changes – change detection - in
the inbound series).
Figure 1: System Architecture.
The first phase of the algorithm involves placing
the first r stream items into the reservoir. The
remaining items are processed sequentially. When
one of the remaining stream items is chosen for the
reservoir, it replaces randomly one of the elements in
the reservoir. The (j+1)th measurement, for j ≥ r, has
a
probability of being a buffer input candidate.
Such candidate replaces one of the r buffer contents
chosen at random. At that time, the sample of r items
is a random sample of the first j+1 stream items
(measurements). At the end of the sequential pass
through the entire stream, we find a truly random
sample of the stream in the buffer.
To cope with the infinite length of the feed we opt
to segment the feed into eras (epochs). Eras are shown
in Figure 2. The start of an era coincides with the first
phase of the R algorithm. The existence of eras allows
us to adopt a specific period of reporting to the CDN,
i.e., how often the accumulated buffer (reservoir) is
posted to the back-end storage facilities for retention
and subsequent processing. One alternative to this
approach (i.e., posting the accumulated reservoir to
the back-end at the end of an era, purging the buffer
and starting over) is to estimate an aggregate (e.g.,
Average, Max) for the reservoir and adopt that as a
single value for further ingestion to the CDN. The
process would be identical to the one described
previously but the edge output would be different,
less accurate yet much more compact. The selection
of a particular aggregate may depend upon
application needs (e.g., Max or Min capture extremes
and should be used when extremes are important
while Average is more appropriate in general stream
observation processes).
The operational parameters of the discussed setup
are:
• The size of the reservoir
• The era duration (or equivalently the period of
back-end reporting)
• The content (and size) of the back-end reports
(entire reservoir or aggregate)
IoTBDS 2023 - 8th International Conference on Internet of Things, Big Data and Security
228
IoT data
generation
timeline
T
i
T
i+1
T
i+2
T
i+3
T
i+4
Era i Era i+1 Era i+2 Era i+3
Figure 2: IoT sampling timeline.
3.2 Era Duration Quantification
Our prime concern in the design of the IoT-aware
solution is to discover changes in the input stream
(original feed) and minimize the probability of
concealing their existence due to the stochastic
sampling nature of the system. In particular we would
like the back-end processing to ensue to implement
change detection algorithms like CUSUM
(cumulative sum control chart) (Page, 1954). We then
consider a reservoir size of r and a frequency of input
f. The phenomenon to be captured (detected) is
assumed to have duration of d (d˖f equals to the
number of samples received at the edge as the
phenomenon evolves). We consider a simple
phenomenon that involves IoT samples increasing
from a standard (no-event) level to an “event” level.
Our objective is to determine the duration of the era(s)
discussed previously as a way to segment time.
To derive this period of back-end reporting we
require the number (W) of samples seen/stored at the
reservoir to be greater than or equal to 1 (W ≥ 1). The
probability of this particular event should be greater
than or equal to ½.
𝑝(𝑊 ≥ 1) ≥
1
2
The R algorithm stipulates that all elements in the
input stream are equally probable to be inserted into
the reservoir. This allows us to determine era duration
(number of samples received at f frequency) as:
𝑛≤
𝑟
1−𝑒
∙
4 IMPLEMENTATION ISSUES
For the implementation of our architecture (Figure 1),
we use Varnish Cache (Feryn, 2017), which is a
reverse caching proxy that can “cache” our IoT traffic
and take most of the load off the backend server. Our
goal is to minimize the workload seen at the backend
which in the case of IoT would be quite significant
yet redundant. For that purpose, we set up Varnish on
the edge server (between the data sources, the islands
and the storage facility), on a separate node, in order
to sustain performance as load increases. For control
of the cache, Varnish uses the Varnish Configuration
Language (VCL). Through the VCL we may establish
the rules to be followed for the data ingestion and also
exploit C-developed modules (Varnish Modules,
VMOD) for elaborate processing (while data are on
transit through the edge/Varnish server). Through
these Varnish implementation options we manage to
implement the reservoir logic described previously,
maintain state/memory during system operation and
pushing information to the back-end as the presented
scheme dictates.
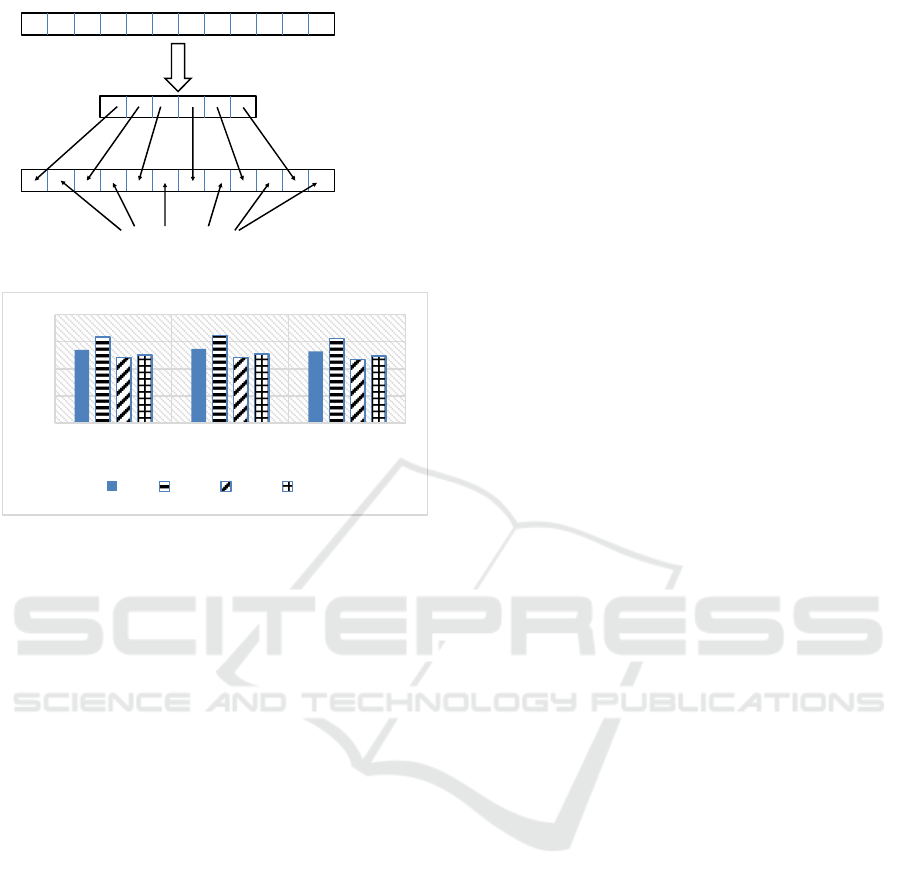
5 RESULTS
We implemented the discussed architecture adopting
the R algorithm for different sizes of the reservoir and
duration of eras. The options that we implemented are
shown in Table 1.
Table 1: Implementation Operational Parameters.
Era duration (e) Reservoir size (r)
5, 10, 15 5, 10, 20, 30
We have addressed to the infrastructure an
extensive dataset of engineering data obtained from
sensors mounted onboard commercial vessels (e.g.,
engine related information, fuel and exhaust
substances, environmental/weather data). We have
experimented with aggregates (Average, Max) for
capturing the current contents of the reservoir and the
establishment of back-end reports. Our findings, for
the particular trace and e and r configurations, clearly
indicate that the performance of the Max aggregate is
significantly better than that of Average.
To quantify this advantage, we introduced a
metric (ρ) that compares the magnitude of the original
stream (seen as a vector of very high dimension) to
the magnitude of the R-sampled, dimension-aligned
stream. A value of ρ=1 indicates full accuracy in the
proposed data reduction process. To be able to
compare streams of equal dimensions the R-sampled
stream underwent a time-based linear interpolation
process (see Figure 3).
Our findings for the metric ρ are shown in Figure
4. We can observe that the better performance is
attained for e=15 and r=20. This scenario with the era
duration value being less than the reservoir size
implies the accumulation of a very representative
subset of the original stream in the reservoir.
Reducing IoT Big Data for Efficient Storage and Processing
229
R-sampling
Interpolated values
Original stream
Reduced stream
Reconstructed
stream
Figure 3: Stream/Vector forms.
Figure 4: Values of the ρ metric for different configurations.
6 CONCLUSIONS
We have augmented the basic CDN architecture for
managing big data in the form of IoT streams. Since
the storage requirements are quite significant, we opt
to reduce the volume of such streams to smaller
sets/synopses which can be easily dealt with (stored
and processed). This strategy is implemented at the
edge of the infrastructure by leveraging two important
aspects. The algorithmic framework that realizes the
pursued data reduction is reservoir sampling and, in
particular, the R algorithm. The considered algorithm
is tuned to cope with phenomena of limited duration
that need to be captured in subsequent processing
through e.g., event detectors (CUSUM). We not only
investigate the algorithmic framework but also the
implementation options through contemporary CDN
software. Specifically, we manage to exploit the
programming (expansion) capabilities of the varnish
servers. Our findings indicate that the requirements
originally set for the CDN expansion towards IoT/big
data handling are met quite efficiently. We finally
report on the implementation of the algorithm itself
and discuss how the intended functionality of data
reduction can benefit from specific combinations of
operational parameters.
REFERENCES
Di Martino, B., Aversa, R., Cretella, G., Esposito, A. and
Kołodziej, J. (2014). Big data (lost) in the cloud, Int. J.
Big Data Intelligence, Vol. 1, Nos. 1/2, pp.3–17.
Tao, J., Jin, S., Tang, J., Ji, Y., Zhang, N. (2020).
Application of Cloud Edge Collaboration Architecture
in Power IoT. In: 2020 IEEE International Conference
on Information Technology, Big Data and Artificial
Intelligence (ICIBA 2020).
Zhou R, Liu M, Li T (2013). Characterizing the efficiency
of data deduplication for big data storage management.
In: 2013 IEEE international symposium on workload
characterization (IISWC).
Xia W et al (2011). SiLo: a similarity-locality based near-
exact deduplication scheme with low RAM overhead
and high throughput. In: USENIX annual technical
conference.
Hillman, C., Ahmad, Y., Whitehorn, M., & Cobley, A.
(2014). Near real-time processing of proteomics data
using Hadoop, Big Data, 2(1), 44-49.
Sugumaran R, Burnett J, Blinkmann A (2012). Big 3d
spatial data processing using cloud computing
environment In: Proceedings of the 1st ACM
SIGSPATIAL international workshop on analytics for
big geospatial data, Nov. 2012, 20-22.
Vitter, Jeffrey S. (1985). Random sampling with a
reservoir, ACM Transactions on Mathematical
Software. 11 (1): 37–57.
Thijs Feryn (2017). Getting Started with Varnish Cache,
O’Reilly.
Page, E. S., (1954). Continuous inspection schemes,
Biometrika, Vol. 41, No. 1/2, pp. 100–115, https://
doi.org/10.1093/biomet/41.1-2.100
0
0,5
1
1,5
2
e=5 e=10 e=15
r=5 r=10 r=20 r=30
IoTBDS 2023 - 8th International Conference on Internet of Things, Big Data and Security
230
