
FakeSpreadersWhatsApp.BR: Misinformation Spreaders Detection in
Brazilian Portuguese WhatsApp Messages
Lucas Cabral, Diogo Martins, Jos
´
e Maria Monteiro, Javam Machado and Wellington Franco
Universidade Federal do Cear
´
a, Brazil
Keywords:
Datasets, Machine Learning, Misinformation Spreaders Detection.
Abstract:
In the past few years, the large-scale dissemination of misinformation through social media has become a
critical issue. In many developing countries such as Brazil, India, and Mexico, one of the primary sources of
misinformation is the messaging application WhatsApp. Recently, a few methods for automatic misinforma-
tion detection for the WhatsApp platform were proposed. On the other hand, identifying users who spread
fake news is another key aspect of mitigating misinformation dissemination effectively. However, features
to describe users on the WhatsApp platform were not found in the literature. This paper proposes a set of
23 features and two approaches (a supervised and another unsupervised) to identify possible misinformation
spreaders on WhatsApp. Our results indicate that the proposed features can be used to distinguish between
potential misinformation spreaders and users who share credible information with a F1 Score of 0.923.
1 INTRODUCTION
In recent years, the large-scale dissemination of mis-
information through social media has become a criti-
cal problem, undermining public health, social stabil-
ity and even democracy. In many developing coun-
tries such as Brazil, India and Mexico, the What-
sApp messaging app is one of the main sources of
misinformation (Martins et al., 2021; Martins et al.,
2022). In this context, identifying users who spread
false content on this platform is a central task in the
fight against disinformation since it allows identify-
ing its origin or its main spreaders. The misinfor-
mation spreaders detection task aims to identify ma-
licious users responsible for spreading misinforma-
tion on a large scale (Morais and Digiampietri, 2022).
The identification of misinformation spreaders makes
it possible to create mechanisms whose purpose is to
block the misinformation flow, mitigating its dissem-
ination. However, proposals of features to describe
users on the WhatsApp platform were not found in
the literature.
This work brings three important contributions:
(i) A set of 23 features to describe the behavior of
users on WhatsApp, which can be used in the au-
tomatic detection of misinformation spreaders.
(ii) Two distinct approaches to identify possi-
ble spreaders of misinformation on WhatsApp:
thresholding and logistic regression.
(iii) A large-scale, labeled, and public dataset of mis-
information spreaders on WhatsApp platform.
This dataset, called FakeSpreadersWhatsApp.Br,
contains 5,364 instances, where each instance rep-
resents a user, and 23 different features, collected
from public chat groups, using the platform pro-
posed by (de S
´
a et al., 2021).
Our results indicate that the proposed approaches
and features can be effectively used to distinguish be-
tween potential misinformation spreaders and users
who share reliable information on WhatsApp. The
thresholding approach (an unsupervised method) ob-
tained a F1 Score of 0.840. The approach based on
logistic regression (a supervised method) presented a
F1 Score of 0.923. Then, we hope that this paper can
help researchers understand Brazil’s misinformation
propagation. The presented ideas can also be used
to build misinformation detection systems, which aim
to assist users in detecting and filtering out deceptive
news.
The remainder of this paper is organized as
follows. Section 2 presents our “misinformation
spreader” definition. Section 3 discuss the main re-
lated work. Section 4 describes the methodology used
in this investigation. Section 4 presents the experi-
mental results. Conclusions and future work are pre-
sented in Section 5.
Cabral, L., Martins, D., Monteiro, J., Machado, J. and Franco, W.
FakeSpreadersWhatsApp.BR: Misinformation Spreaders Detection in Brazilian Portuguese WhatsApp Messages.
DOI: 10.5220/0011985500003467
In Proceedings of the 25th International Conference on Enterprise Information Systems (ICEIS 2023) - Volume 1, pages 219-228
ISBN: 978-989-758-648-4; ISSN: 2184-4992
Copyright
c
2023 by SCITEPRESS – Science and Technology Publications, Lda. Under CC license (CC BY-NC-ND 4.0)
219

2 FUNDAMENTAL CONCEPTS
In this work, we propose an embracing definition for
the concept of “misinformation spreader”, which is
formulated next:
Theorem 2.1. Let be a user u = {U
u
, E
u
} of a social
network N, who has associated with him a set U
u
=
{u
1
, u
2
, ..., u
m
} of other m users with which u has a
connection, a set of engagements E
u
= {e
u
1
, e
u
2
, ..., e
u
n
},
where each e
u
i
= {p
i
, a,t} represents an engagement
of u with the publication p
i
, for the action a, in the
time t. Let the function Q(s) 7→ [0, 1] be a misinfor-
mation score assigned to u and τ be a decision thresh-
old. Detecting misinformation spreaders is the task of
learning a prediction function G(u, τ) 7→ [0, 1], satis-
fying:
G(u, τ) =
(
1 (is a misinf. spreader), if Q(s) ≥ τ
0 (is not a misinf. spreader), if Q(s) < τ
A specific definition to categorize a user as a mis-
information spreader may vary according to the an-
alyzed social network or the particular behavior one
wants to detect. However, it should be considered
that the user posts or shares misinformation with un-
usual frequency or proportion compared to other users
of this social network. That is, a misinformation
spreader publishes a high amount of misleading pub-
lications, or most of his publications contain false in-
formation. It is not, therefore, a gullible user who has
regular activities on the social network and eventually
publishes unreliable information, but users engaged in
abnormally disseminating misinformation compared
to regular users. It is essential to highlight that, de-
pending on the social network, this behavior often vi-
olates its community policies.
3 RELATED WORK
The misinformation spreaders detection is still a prob-
lem little addressed in the context of the Portuguese
language. Most of the existing works address the bots
detection problem. In (Leite et al., 2020), a set of
rules was proposed to describe and classify bots on
Twitter. The rules are based on the users behavior,
and use as input data the number of tweets book-
marked, the index of answered tweets, and the aver-
age of retweets. Using a decision tree, users can be
classified by these rules. The best result achieved an
AUC of 0.97 using the dataset collected by (Cresci
et al., 2017).
In (Benevenuto et al., 2008), the authors in-
vestigate the problem of detecting malicious users
(spammers) on the YouTube platform. Users are
represented by three groups of features: user fea-
tures, video features and social network features.
User features include the number of videos added
to YouTube, number of friends, number of videos
watched, number of videos added as favorites, num-
ber of response videos sent and received, number of
subscriptions, number of subscribers, and the maxi-
mum number of videos added in a day. Video fea-
tures include the videos length average, number of
views, ratings, comments, favorites, honorable men-
tions, and external links on posted videos. Social
network features include clustering coefficient, user
rank, betweenness, reciprocity and assortativity. Us-
ing these features, an F1 Score of 0.81 was obtained
in the malicious user detection task.
The effectiveness of the most popular classifiers,
such as Random Forest and AdaBoost, in detect-
ing bots was evaluated in (Morais and Digiampietri,
2022). The obtained results pointed to the degrada-
tion of the efficiency of the classifiers when exposed
to new datasets, different from the dataset used during
the model training. This result derives, among other
factors, from the dependence on information based
on the user’s profile, which are frequently changed
by bots developers whenever they realize that certain
features are being used by the detection algorithms.
In (Shahid et al., 2022), the authors provided a
comprehensive survey of the state of art methods for
detecting malicious users and bots based on different
features. In (Rath et al., 2021), the authors presented
SCARLET (truSt andCredibility bAsed gRaph neu-
raLnEtwork model using aTtention), a model to pre-
dict misinformation spreaders on Twitter. Using real
world Twitter datasets, they show that SCARLET is
able to predict false information spreaders with an ac-
curacy of over 87%. In (Rath and Srivastava, 2022),
the authors proposed a framework based on a com-
plementary approach to false information mitigation
on Twitter inspired from the domain of Epidemiol-
ogy, where false information is analogous to infec-
tion, social network is analogous to population and
likelihood of people believing an information is anal-
ogous to their vulnerability to infection.
In (Heidari et al., 2021), the authors analyzed sen-
timent features and their effect on the accuracy of ma-
chine learning models for social media bot detection
on Twitter. A new set of sentiment features were ex-
tracted from tweet’s text and used to train bot detec-
tion models. Besides, they proposed a new model for
the Dutch language and achieve more than 87% ac-
curacy for the Dutch tweets based on new sentiment
features.
ICEIS 2023 - 25th International Conference on Enterprise Information Systems
220

4 METHODOLOGY
Regarding the research methodology, the nature of
this research is applied. As for the approach, this re-
search is quantitative, organized through the follow-
ing methodological procedures: (i) extraction of data
referring to messages sent by users in WhatsApp pub-
lic groups, (ii) controlled experiments in the labora-
tory, and (iii) modeling/simulation for the construc-
tion of classifiers based on supervised and unsuper-
vised learning. It is important to highlight that this
project seeks to identify misinformation spreaders on
the WhatsApp platform, considering features that are
independent of the used language.
4.1 The FakeSpreadersWhatsApp.Br
Dataset
In this work, we start from the FakeWhatsApp.Br
(Cabral et al., 2021) dataset, where each line repre-
sents a message that a particular user sent in a spe-
cific WhatsApp public group. The FakeWhatsApp.Br
dataset has 282,601 messages sent by 5,364 users, in
59 public groups, between July and November 2018,
corresponding to the Brazilian election campaign pe-
riod. The columns of the FakeWhatsApp.Br dataset
are the date and time that the message was sent, the
sender’s phone number, the international phone code,
the Brazilian state (if the user is from Brazil), the con-
tent (text) of the message, the number of words, the
amount of characters, and whether the message con-
tained media such as audio, image, or video. How-
ever, the FakeWhatsApp.Br dataset does not have
any media files. Furthermore, the authors computed
how often the same message (with the exact same
text) appears in the dataset. A message was consid-
ered viral if it was observed more than once in the
dataset. For this, only viral messages with identical
textual content and more than five words were con-
sidered to filter out common messages such as greet-
ings. This subset of the FakeWhatsApp.Br dataset
contains 6,926 viral messages. Additionally, the mes-
sages were anonymized in order to remove personal
information such as identity document number, indi-
vidual taxpayer identification number, zip code, and
telephone number, among others. Finally, the mes-
sages were manually labeled (as misinformation or
not misinformation). The strategy used to build the
FakeWhatsApp.Br dataset was described in (Cabral
et al., 2021). The corpus of FakeWhatsApp.Br is pub-
licly available in a repository online
1
.
From FakeWhatsApp.Br we built a new dataset
1
https://github.com/cabrau/FakeWhatsApp.Br
called FakeSpreadersWhatsApp.Br, containing 5,364
instances, where each instance represents a user, with
features calculated from the original dataset and de-
scribing their behavior in the groups during the ob-
served period. For each user, 23 different features
were computed, organized into two large groups: ac-
tivity and network features. Next, we detail each of
these features.
4.1.1 Activity Features
As the name implies, activity features quantify the ac-
tions taken by users in observed groups. Activity fea-
tures can be organized into three subgroups: count,
proportion, and temporal activity.
The count features are groups (number of groups
the user joins), total messages (total number of mes-
sages sent by the user), texts (number of text messages
sent), media (number of media messages sent), viral
(number of viral messages sent), repeated messages
(number of repeated messages sent by the user), and
misinformation (number of messages labeled as mis-
information sent by the user). High values in count
features indicate that the user was very active in the
observed scope. In addition, high values in the at-
tributes media, viral, and repeated messages indicate
propagandist behavior. High values in the misinfor-
mation feature indicate misinformation behavior.
Table 1 shows statistical measures that describe
the count features in the FakeSpreadersWhatsApp.Br
dataset. We can see that spreading misinformation is
not common among users, as 75% of users sent less
than one message containing misinformation. It is
also noted that most users do not actively participate
in the groups. All count features have distributions
with a high concentration of lower values, but with a
high standard deviation and a high maximum value,
characterizing themselves as long-tail distributions.
The proportion features are: texts (ratio between
the number of text messages and the total number
of messages sent by the user), media (ratio between
the number of messages containing media and the to-
tal number of messages sent by the user), viral (ratio
between the number of viral messages and the total
number of messages sent by the user), repeated mes-
sages (ratio between the number of repeated messages
and the total number of messages sent by the user) and
misinformation (ratio between the number of mes-
sages labeled as misinformation and the total number
of messages sent by the user). These features seek
to capture the relationship between a specific type of
message and the total number of messages sent by the
user.
Table 2 shows statistical measures that describe
the proportion features in the FakeSpreadersWhat-
FakeSpreadersWhatsApp.BR: Misinformation Spreaders Detection in Brazilian Portuguese WhatsApp Messages
221

Table 1: Statistical measures of the count-type activity features.
Groups Total messages Texts Media Viral Repeated messages Misinformation
average 1.16 52.68 29.13 23.55 3.89 2.57 2.13
standard deviation 0.65 138.06 89.74 63.19 15.01 16.26 7.33
min 1.00 1.00 0.00 0.00 0.00 0.00 0.00
Q1 1.00 3.00 2.00 1.00 0.00 0.00 0.00
median 1.00 13.00 6.00 4.00 0.00 0.00 0.00
Q3 1.00 45.00 23.00 19.00 2.00 1.00 1.00
max 11.00 4396.00 3742.00 1360.00 564.00 609.00 147.00
sApp.Br dataset. We have observed empirically that
some of these features indicate unusual activity, espe-
cially when users have not been very active, but had
high values for media and viral features. To illustrate
this point with a real example, a user who shared 17
viral messages might not be relevant when looking at
the raw amount alone. However, it was observed that
100% of these messages are viral, which is a behavior
that does not correspond to that of a regular user. This
user is not using the application for conversations, but
as a propagandist, just passing on content. The misin-
formation feature could only be obtained because the
data went through a previous manual labeling process.
However, the other features can be obtained from an
unlabeled dataset.
Temporal activity features are: active days (num-
ber of days the user has sent messages), mean, stan-
dard deviation, median, and maximum number of
messages per day. Table 3 shows statistical mea-
sures that describe temporal activity features in the
FakeSpreadersWhatsApp.Br dataset. Temporal activ-
ity features describe the user behavior over time and
can be extracted without a previous manual labeling
process. Suspicious activities include the user with
very sharp bursts of activity alternating with days of
no activity. A low mean, with a high standard devia-
tion and a high maximum value, can be a solid indi-
cator to identify misinformation spreaders.
4.1.2 Network Features
Modeling user relationships through a network or
graph, can provide relevant information about the
misinformation flow. In some social networks such
as Twitter or Facebook, there are well-defined con-
nections between users through the relationship of
following (Twitter) or friendship (Facebook). How-
ever, on WhatsApp, these connections are not ex-
plicit. Thus, we propose modeling the relationships
between WhatsApp users in the form of directed and
valued graphs, considering the sending of messages
in groups. In this modeling, each node represents a
user, and we can consider a graph for each type of
message: i) messages in general (General Graph), ii)
viral messages (Viral Graph), and iii) messages with
misinformation (Misinformation Graph). Consider-
ing the general graph, where each node represents a
user, a directed edge exists between user i and user j
if user i sent a message to a group that user j belongs.
The weight of this edge is the number of messages
sent by user i to that group. If user i and user j jointly
participate in k groups, the weight of the edge from i
to j will be the sum of the amounts of messages sent
by i to these k groups.
Analogous reasoning can be applied to create the
viral graph: there is a directed edge between user i
and user j if user i sent a viral message to a group
which user j belongs, and the weight of this edge is
the number of viral messages sent by the user i to that
group. The same goes for the misinformation graph.
It can be seen that in the three graphs, the number of
nodes is the same, varying the number of edges. The
count of the number of edges of each type is presented
in Table 4. It can be seen that they are large graphs
with many connections.
Figure 1 exemplifies the format of the general
graph, using a sample of 2,000 users. Besides, for
simplification purposes, the weights and direction of
the edges are ignored in this representation. Note
that there are isolated groups and a cluster of users
strongly connected in the center. This is because there
are engaged users who actively participate in many
groups. Figure 2 illustrates this cluster in more detail.
Observe the existence of users with high centrality,
that is, who interacted with several other users and
users who interact only with their local group.
From these graphs, we can obtain some network
metrics, which we call here “network features”: gen-
eral centrality degree, general strength, viral central-
ity degree, viral strength, misinformation centrality
degree, and misinformation strength. The last two
features can only be computed due to manually as-
signed labels, while the rest can be computed from
unlabeled data. Table 5 shows statistical measures
that describe the network features in the FakeSpread-
ersWhatsApp.Br dataset.
ICEIS 2023 - 25th International Conference on Enterprise Information Systems
222

Table 2: Statistical measures of proportion-type activity features.
Proportion
Texts Media Viral Repeated messages Misinformation
average 0.567 0.433 0.069 0.039 0.041
standard deviation 0.317 0.317 0.140 0.107 0.107
min 0.000 0.000 0.000 0.000 0.000
Q1 0.333 0.158 0.000 0.000 0.000
median 0.571 0.429 0.000 0.000 0.000
Q3 0.842 0.667 0.085 0.014 0.042
max 1.000 1.000 1.000 0.941 1.000
Table 3: Statistical measures of temporal activity features.
Active days Average daily messages Standard deviation of daily messages Median of daily messages Maximum daily messages
average 33.3 2.1 2.8 1.4 10.3
standard deviation 30.0 5.0 4.7 4.8 16.9
min 1.0 0.0 0.0 0.0 1.0
Q1 3.0 0.4 0.7 0.0 2.0
median 28.0 1.0 1.4 0.0 4.0
Q3 59.0 2.0 3.2 1.0 12.0
max 120.0 149.0 148.5 149.0 294.0
Figure 1: Sample of general graph, with a selection of 2,000 users.
Table 4: Quantities of nodes and edges of the graphs gener-
ated to model the relationships between users.
Graphs statistics
Number of nodes 5.364
Number of edges (General graph) 1.125.326
Number of edges (Viral graph) 551.069
Number of edges (Misinformation graph) 433.204
4.2 Misinformation Spreaders Detection
First, we analyzed the general activity of the 5,364
users of the FakeSpreadersWhatsApp.Br dataset by
distributing the total number of messages each user
sent in the public groups. We observe that the distri-
bution of total messages and other user features has a
long tail, with the vast majority of users having low
activity. In fact, only 25% of the users sent more than
45 messages. As we are interested in users who had
relevant activity, to identify possible misinformation
spreaders, we created a clipping containing only users
who sent a more significant number of messages than
the median, corresponding to 13 messages. This sub-
set contains 2,633 users, called active users. Figure 3
shows the distribution of the number of messages sent
by users in the FakeSpreadersWhatsApp.Br dataset.
Next, we analyzed the features distributions for
this subset of users. As already mentioned, we are
interested in the anomalous behavior to define key
users, so we used the the well-known outliers detec-
tion method based on the interquartile range, where
FakeSpreadersWhatsApp.BR: Misinformation Spreaders Detection in Brazilian Portuguese WhatsApp Messages
223
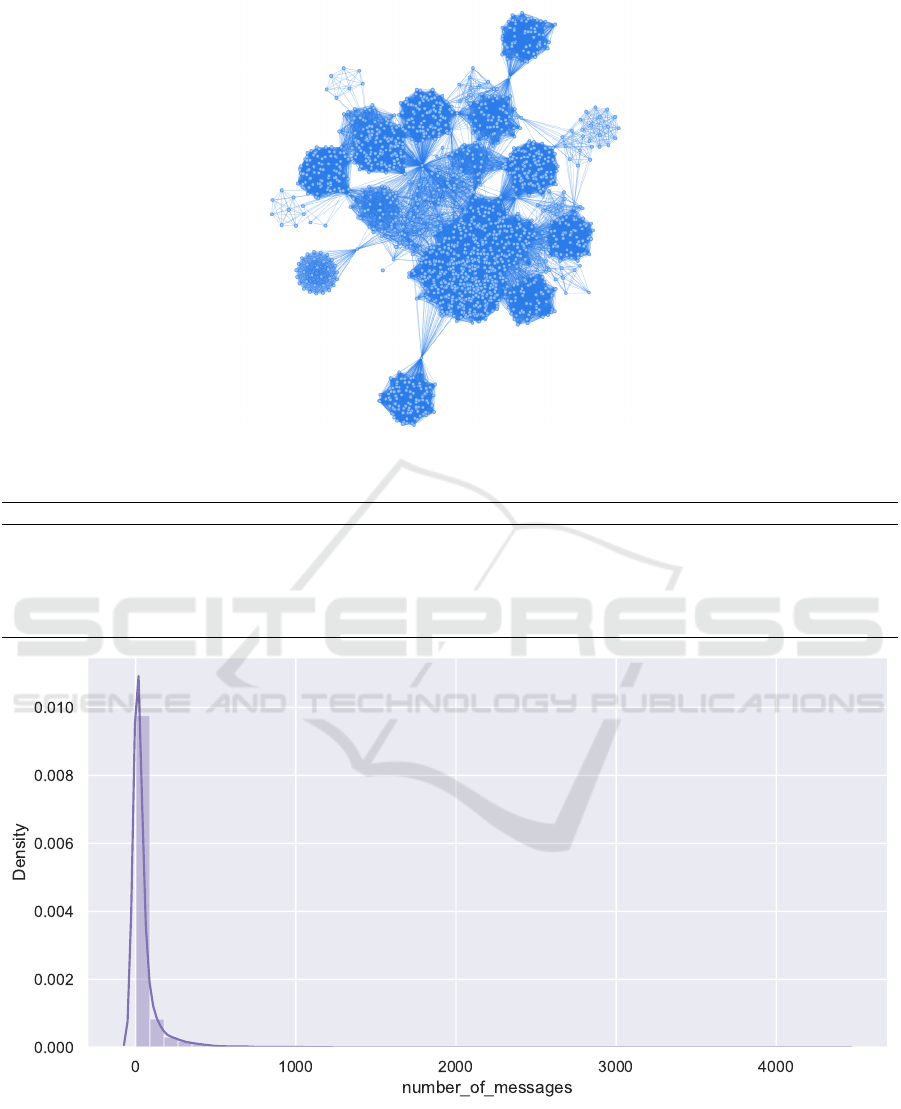
Figure 2: Detail of the graph illustrated in Figure 1, highlighting the strongly connected groups.
Table 5: Statistical measures of network features.
General centrality degree General strength Viral centrality degree Viral strength Misinformation centrality degree Misinformation strength
average 215 10598 105 713 83 386
standard deviation 142 29226 151 2859 136 1392
min 3 7 0 0 0 0
Q1 105 494 0 0 0 0
median 200 2114 0 0 0 0
Q3 278 8322 200 404 153 273
max 1710 672588 1681 96342 1506 28601
Figure 3: Number of messages sent by users in the FakeSpreadersWhatsApp.Br dataset.
an outlier is defined as the value equal to Q3+1.5·IQ,
where Q3 is the third quartile and IQ is the interquar-
tile distance of the distribution, considering only the
subset of active users.
Then, we propose a definition of misinformation
spreader based on the misinformation strength fea-
ture. In this work, the misinformation spreaders con-
stitute the group that, among the active users, has an
ICEIS 2023 - 25th International Conference on Enterprise Information Systems
224

anomalous value for the misinformation strength fea-
ture, according to the interquartile distance method.
In the FakeSpreadersWhatsApp.Br dataset, an outlier
value at the misinformation strength feature is above
the threshold of 28,601. It is important to note that
this user category could also have been defined using
other feature, such as viral centrality degree, general
strength or active days. However, we chose misinfor-
mation strength because we are interested not only in
the amount of misinformation shared, but in the reach
they had, and this feature encapsulates both pieces of
information. That is, our definition of misinforma-
tion spreader encompasses users who can be charac-
terized as “spreaders” due to the scope and frequency
of their actions, which cause more damage than low-
range gullible users.
Next, we show four different messages sent by the
most active misinformation spreader, following the
definition presented previously:
1. • Original Message:
“https://youtu.be/iXi3X2XDg6A ...................
*URGENTE* !! multipliquem este v
´
ıdeo ao
m
´
aximo!!”
• Message Translated to English:
“https://youtu.be/iXi3X2XDg6A ...................
*URGENT* !! multiply this video to the
maximum!!”
2. • Original Message:
“https://youtu.be/WcXXsERafNA. *MAIS
UMA FAKE NEWS do HADDAD DES-
MACARADA!!!* *COMPARTILHEM com
todos os seus contatos!!!* vamos colocar este
v
´
ıdeo *EM ALTA* no YouTube!!!!”
• Message Translated to English:
“https://youtu.be/WcXXsERafNA. *ANOTHER
FAKE NEWS from HADDAD UNMASKED!!!*
*SHARE this with all your contacts!!!* we’ll
put this video *UP* on YouTube!!!!”
3. • Original Message:
“Mais uma fake News da m
´
ıdia........o assassi-
nato do capoeirista n
˜
ao teve nada a ver com
pol
´
ıtica ou muito menos com apoiador de Bol-
sonaro....... *CANALHAS!! ..... Divulgue este
v
´
ıdeo para todos os seus contatos e grupos do
WhatsApp*”
• Message Translated to English:
“Another fake news from the media........the
murder of the capoeirista had nothing to do
with politics or much less with a Bolsonaro sup-
porter....... *SCAMPS!! ..... Share this video to
all your WhatsApp contacts and groups*”
4. • Original Message:
“*No Cear
´
a, o Comando Vermelho( CV )
PROIBIU propaganda de BOLSONARO nos
territ
´
orios que* *”administra”* *Somente
LULA E CIRO Podem. Por serem aliados
do CRIME.* Algu
´
em tem d
´
uvida agora da
quadrilha?”
• Message Translated to English:
“*In Cear
´
a, the Comando Vermelho ( CV )
PROHIBITED BOLSONARO’s propaganda in
the territories it* *”manages”* *Only LULA
AND CIRO can. Because they are allies of
CRIME.* Does anyone have any doubts now
about the gang?”
Table 6 presents information about misinforma-
tion spreaders. One can observe the that the misin-
formation spreader category is formed by only 2.5%
of users, but these are responsible for a large volume
of total misinformation, reaching almost 40%. This
shows that most misinformation is propagated by a
small number of users, whether acting maliciously or
not, which reinforces the need to identify these users
as a way to mitigate the spread of misinformation.
4.3 Experimental Evaluation
Based on our definition of misinformation spreader
presented in the previous section (value of the misin-
formation strength feature greater than 28,601) and
the 23 features of the FakeSpreadersWhatsApp.Br
dataset, binary classification experiments were car-
ried out to identify whether a user is a misinformation
spreader (positive) or not (negative).
It is important to note that the misinformation la-
bel can only be assigned due to the message label-
ing process, which is used to calculate the misinfor-
mation strength metric, which defines a user’s class.
However, there are other features (such as viral cen-
trality degree, general strength and active days) that
are known a priori, without any manual labeling pro-
cess, and these can also be used to identify misinfor-
mation spreaders. Nevertheless, exploring these fea-
tures of misinformation spreaders detection is outside
the scope of this paper.
Additionally, it is worth mentioning that the sub-
set formed by active users presents a high imbal-
ance between classes (misinformation spreader and
non-spreader). The positive class (misinformation
spreader) is the minority, having 132 users, while the
negative class (non-spreader) is the majority, having
5,232 users, as illustrated in Figure 4. This imbal-
ance often increases the difficulty of classification, as
classifiers may tend to recognize only the majority of
class patterns.
FakeSpreadersWhatsApp.BR: Misinformation Spreaders Detection in Brazilian Portuguese WhatsApp Messages
225

Table 6: Description of the misinformation spreader category in terms of number of users, percentage of these users in relation
to the total, amount of misinformation sent by users of this category and percentage of misinformation sent by users of this
category in relation to total misinformation.
Category Feature Threshold nº of users % of users nº of misinformation % of misinformation
Misinformation Spreader Misinformation Strength 28,601 132 2.5% 4,533 39.7%
Figure 4: Balancing between user classes. It is perceived
that it is a problem of extremely unbalanced classes, where
the positive class, of misinformation spreaders, is in the mi-
nority.
To evaluate the performance of the two ap-
proaches proposed in this work for classifying mis-
information spreaders, we performed a random sepa-
ration of data in the training and test sets in a stratified
way, maintaining the proportion between the classes.
Thus, the total number of users was split, with 80%
for the training set and 20% for the test set. Table 7
presents the amount of data of each class present in
each set.
Table 7: Number of negative and positive instances in the
training and test sets.
Training Test
Positive (misinformation spreaders) 106 26
Negative (non misinformation spreaders) 4,185 1,047
Total 4,291 1,073
4.3.1 Approach 1: Thresholding
This approach assumes a strong correlation between
the misinformation strength and viral strength fea-
tures since all misinformation is also a viral message
in the FakeSpreadersWhatsApp.Br dataset. In fact,
when analyzing the correlation of misinformation
strength with other features that can be obtained from
unlabeled data, the most strongly correlated variable
is viral strength, with a correlation index of 0.87.
Thus, a user committed to publicizing and spreading
viral messages has a good chance of spreading mes-
sages labeled as misinformation. We use this intuition
as an approach to detect misinformation spreaders.
The thresholding approach classifies every user
with a value greater than or equal to the outlier thresh-
old in the viral strength feature as a misinformation
spreader. Thus, every user with an anomalous vi-
ral strength value, who disseminates viral messages
on a large scale, is classified as a misinformation
spreader. The threshold observed in the FakeSpread-
ersWhatsApp.Br dataset for the viral strength feature
was 5,675. Note that this approach can be used even
with unlabeled data. That is, the thresholding ap-
proach is an unsupervised method.
4.3.2 Approach 2: Logistic Regression
The second approach proposed in this work consists
of using logistic regression. The input is a subset
of the 23 user features from the FakeSpreadersWhat-
sApp.Br dataset, normalized by the z-score method,
using the mean and variance of the training set. This
subset is selected using a Decision Tree. To do this,
we train the model with the training set and obtain
the Gini Importance, which counts the times a fea-
ture is used to split a node, weighted by the number
of samples it splits. The result of the features’ im-
portance is illustrated in Figure 5. Note that the most
important feature is, in fact, viral strength. But other
features such as the proportion of repeated messages,
amount of media, daily messages, and the number of
viral messages also add information to the classifier.
Thus, we chose the ten most important features: viral
strength, amount of media, the proportion of repeated
messages, general centrality degree, general strength,
average daily messages, amount of viral messages, vi-
ral centrality degree, active days, and 95th percentile
in the number of daily messages. In addition to the
feature selection, another important step is optimiz-
ing the decision threshold. Due to the imbalance, the
model may tend to estimate lower probabilities for the
positive class, so it is necessary to choose an appro-
priate decision threshold, which in this case, may be
less than 0.5. We used the optimal accuracy value in
a validation subset, separate from the training set, to
optimize the decision threshold choice. In order to
avoid inserting noise into the training data, oversam-
pling techniques were not used so that imbalance is
dealt with by choosing an appropriate decision thresh-
old.
ICEIS 2023 - 25th International Conference on Enterprise Information Systems
226

Note that this approach only can be used if labeled
data is available. That is, the logistic regression ap-
proach is a supervised method.
Figure 5: Features Importance.
5 RESULTS
The results obtained in the evaluation are presented in
Table 8. Although accuracy is not a suitable metric for
this problem, since the classes are very unbalanced, it
was also presented. It is observed that the threshold-
ing approach obtained a reasonable result in terms of
precision and recall, with a F1 Score of 0.840. This
approach identified approximately 84% of all misin-
formation spreaders in the test set.
The results obtained by logistic regression were
achieved with a decision threshold of 0.24. That is,
the models classifies as misinformation spreader (pos-
itive) the user with a probability estimate greater than
24% . The performance obtained by logistic regres-
sion was superior in all metrics, in particular in re-
call, where approximately 92.3% of the misinforma-
tion spreaders were identified, and with a high preci-
sion, which means a low rate of false positives. Ad-
ditionally, logistic regression allows interpretability
techniques to be applied, which make possible, for
example, to understand the contributions of each fea-
tures to individual predictions. However, logistic re-
gression requires the data to be labeled.
Since viral strength and misinformation strength
are strongly correlated, we retrained the logistic re-
gression model without it. In this case, the decision
threshold was 0.19. We obtained a F1 Score of 0.807,
recall of 0.807, and AUC of 0.994. The performance
dropped compared to the other methods that rely on
the viral strength feature. Even so, the logistic regres-
sion approach without the misinformation strength
feature identified approximately 87% of all misinfor-
mation spreaders in the test set.
Table 8 shows the results of the misinformation
spreaders classification using the thresholding and lo-
gistic regression approaches. Already Figure 6 illus-
trates the logistic regression confusion matrix, and
Figure 6: Logistic regression confusion matrix.
Figure 7: Logistic regression without viral strength confu-
sion matrix.
Figure 7 shows the confusion matrix for the logistic
regression trained without the viral strength feature.
Table 8: Results of the misinformation spreaders classi-
fication using the thresholding and logistic regression ap-
proaches.
Method ACC PRE REC F1 Score AUC
Thresholding 0.992 0.875 0.807 0.840 -
Logistic Regression 0.996 0.923 0.923 0.923 0.998
Logistic Regression w/o Viral Strength 0.990 0.807 0.807 0.807 0.994
6 CONCLUSION
In this paper, we propose a set of 23 features or-
ganized into two groups (activity and network at-
tributes) and two distinct approaches to identify pos-
sible misinformation spreaders on WhatsApp: thresh-
olding (an unsupervised method) and logistic regres-
sion (a supervised method). Our results indicate that
the proposed approaches and features can be effec-
tively used to distinguish between potential misinfor-
mation spreaders and users who share reliable infor-
mation on WhatsApp. The thresholding approach ob-
tained a F1 Score of 0.840. The approach based on lo-
gistic regression presented a F1 Score of 0.923. When
FakeSpreadersWhatsApp.BR: Misinformation Spreaders Detection in Brazilian Portuguese WhatsApp Messages
227

removing viral strength from the features set, the lo-
gistic regression model presented a F1 Score of 0.807.
REFERENCES
Benevenuto, F., Rodrigues, T., Almeida, V., Almeida, J.,
and Gonc¸alves, M. (2008). Detectando usu
´
arios ma-
liciosos em interac¸
˜
oes via v
´
ıdeos no youtube. In Pro-
ceedings of the 14th Brazilian Symposium on Multi-
media and the Web, pages 138–145.
Cabral, L., Monteiro, J. M., da Silva, J. W. F., Mattos, C. L.,
and Mourao, P. J. C. (2021). Fakewhastapp. br: Nlp
and machine learning techniques for misinformation
detection in brazilian portuguese whatsapp messages.
Cresci, S., Di Pietro, R., Petrocchi, M., Spognardi, A.,
and Tesconi, M. (2017). The paradigm-shift of social
spambots: Evidence, theories, and tools for the arms
race. In Proceedings of the 26th international confer-
ence on world wide web companion, pages 963–972.
de S
´
a, I. C., Monteiro, J. M., da Silva, J. W. F., Medeiros,
L. M., Mourao, P. J. C., and da Cunha, L. C. C. (2021).
Digital lighthouse: A platform for monitoring public
groups in whatsapp.
Heidari, M., Jones, J. H. J., and Uzuner, O. (2021). An
empirical study of machine learning algorithms for
social media bot detection. In 2021 IEEE Interna-
tional IOT, Electronics and Mechatronics Conference
(IEMTRONICS), pages 1–5.
Leite, M. A. G. L., Guelpeli, M. V. C., and Santos,
C. Q. (2020). Um modelo baseado em regras para
a detecc¸
˜
ao de bots no twitter. In Anais do IX Brazil-
ian Workshop on Social Network Analysis and Mining,
pages 37–48. SBC.
Martins, A. D. F., Cabral, L., Mour
˜
ao, P. J. C., Monteiro,
J. M., and Machado, J. (2021). Detection of misinfor-
mation about covid-19 in brazilian portuguese what-
sapp messages. In International Conference on Appli-
cations of Natural Language to Information Systems,
pages 199–206. Springer.
Martins, A. D. F., Monteiro, J. M., and Machado, J. C.
(2022). Understanding misinformation about COVID-
19 in whatsapp messages. In Chiusano, S., Cerquitelli,
T., Wrembel, R., Nørv
˚
ag, K., Catania, B., Vargas-
Solar, G., and Zumpano, E., editors, New Trends
in Database and Information Systems - ADBIS 2022
Short Papers, Doctoral Consortium and Workshops:
DOING, K-GALS, MADEISD, MegaData, SWODCH,
Turin, Italy, September 5-8, 2022, Proceedings, vol-
ume 1652 of Communications in Computer and Infor-
mation Science, pages 14–23. Springer.
Morais, D. and Digiampietri, L. A. (2022). Evaluating so-
cial bots detection approaches in different domains. In
XVIII Brazilian Symposium on Information Systems,
SBSI, New York, NY, USA. Association for Comput-
ing Machinery.
Rath, B., Morales, X., and Srivastava, J. (2021). Scar-
let: Explainable attention based graph neural network
for fake news spreader prediction. In Karlapalem,
K., Cheng, H., Ramakrishnan, N., Agrawal, R. K.,
Reddy, P. K., Srivastava, J., and Chakraborty, T., ed-
itors, Advances in Knowledge Discovery and Data
Mining, pages 714–727, Cham. Springer International
Publishing.
Rath, B. and Srivastava, J. (2022). Spreader-Centric Fake
News Mitigation Framework Based on Epidemiol-
ogy, pages 31–54. Springer International Publishing,
Cham.
Shahid, W., Li, Y., Staples, D., Amin, G., Hakak, S., and
Ghorbani, A. (2022). Are you a cyborg, bot or hu-
man?—a survey on detecting fake news spreaders.
IEEE Access, 10:27069–27083.
ICEIS 2023 - 25th International Conference on Enterprise Information Systems
228
