
Simulation Environment for Traffic Control Systems Targeting
Mixed Autonomy Traffic Scenarios
Christopher Link
1
, Kevin Malena
1
, Sandra Gausemeier
1
and Ansgar Trächtler
1,2
1
Heinz Nixdorf Institute, University of Paderborn, Fürstenallee 11, Paderborn, Germany
2
Fraunhofer Institute for Mechatronic Systems Design IEM, Zunkunftsmeile 1, Paderborn, Germany
Keywords: Traffic Simulation, Traffic Control, Car2X, Mixed Autonomy, Autonomous Vehicles, SUMO, Sensor
Simulation, Traffic Demand Generation, Routing, Traffic Lights, Graph Analysis, Traffic Observer.
Abstract: The development of autonomous vehicles and their introduction in urban traffic offer many opportunities for
traffic improvements. In this paper, an approach for a future traffic control system for mixed autonomy traffic
environments is presented. Furthermore, a simulation framework based on the city of Paderborn is introduced
to enable the development and examination of such a system. This encompasses multiple elements including
the road network itself, traffic lights, sensors as well as methods to analyse the topology of the network.
Furthermore, a procedure for traffic demand generation and routing is presented based on statistical data of
the city and traffic data obtained by measurements. The resulting model can receive and apply the generated
control inputs and in turn generates simulated sensor data for the control system based on the current system
state.
1 INTRODUCTION
Traffic control is a vital part of road mobility,
especially in urban areas. It is required for an efficient
use of the given road network and often has a direct
impact on the traffic situation. Current means of
traffic control e. g., traffic light systems (TLS) or
dynamic speed limitations on selected roads are key
to improve the traffic flow and are therefore currently
subject to optimisation. However, a major drawback
of those systems is their cost and the need for
additional infrastructure, like traffic detectors, to
acquire an accurate picture of the traffic state. TLS,
for example, can achieve significantly better
performance if the traffic situation in their vicinity
can be observed and used to determine the most
suitable control input to handle the current situation
(Malena et al., 2022).
The current developments in autonomous and
connected vehicles offer a great potential to remedy
these limitations and to integrate these vehicles as
agents in traffic control systems themselves. Modern
vehicles monitor their own position and speed
continuously and could share this information using
Car2X technology. Moreover, autonomous vehicles
are dependent on the constant observation of their
environment in real-time to be able to drive without
assistance of a person. For a central traffic control
system this data can give valuable insights in the local
traffic situation close to the respective vehicles.
Additionally, the current road infrastructure already
integrates detectors, like induction loops or radar
detectors, which can provide traffic data on stationary
locations of varying quality. The incorporation of all
these local data sources into a central control system
can be used to obtain a comprehensive and up-to-date
picture of the traffic network’s state, even if only a
small share of the road users is able or willing to
participate in data-sharing.
Our goal, based on these considerations, is to
develop such a traffic control system for future traffic
scenarios and to utilizes the capabilities these systems
would enable. A real-time picture of the traffic state
can further improve TLS performance and enable
route optimisation or rerouting suggestions for
vehicles on the road. Furthermore, cooperative
autonomous vehicles could be used to adapt the
traffic flow speed in order to reduce congestions or
stop-and-go traffic on road sections ahead. The
framework development requires a suitable
simulation environment since the traffic composition,
as described above, and the means for data-sharing
currently do not exist to the required extent.
Link, C., Malena, K., Gausemeier, S. and Trächtler, A.
Simulation Environment for Traffic Control Systems Targeting Mixed Autonomy Traffic Scenarios.
DOI: 10.5220/0011987600003479
In Proceedings of the 9th International Conference on Vehicle Technology and Intelligent Transport Systems (VEHITS 2023), pages 367-377
ISBN: 978-989-758-652-1; ISSN: 2184-495X
Copyright
c
2023 by SCITEPRESS – Science and Technology Publications, Lda. Under CC license (CC BY-NC-ND 4.0)
367

In this paper, we present a simulation environment
and its components that is the foundation of such a
system. In section 2, a literature overview is given to
set a baseline for the presented research. An overview
over the system and its structure is presented in
section 3. Section 4 comprises the modelling of the
road infrastructure as well as the traffic demand.
Finally, in section 5 the conclusions are drawn, and
the next steps are formulated.
2 LITERATURE OVERVIEW
Modelling a traffic environment and the associated
control system are comprehensive tasks that include
several aspects. In this section, a selective overview
is presented due to the limited scope of this
publication. There are many approaches and tools
resulting from previous research. In (Lopez et al.,
2018), the microscopic traffic simulation tool SUMO
and its framework is presented which is used in this
research. By employing the open-source software it is
possible to model and simulate traffic scenarios in a
realistic way. However, to reproduce the behaviour of
a real traffic system, the mobility demand must be
approximated realistically. An overview over
methods for activity-based demand generation is
given in (Schweizer et al., 2018). Depending on the
available data, the desired output and the scope of the
simulation, different methods can be pursued.
Usually, the approaches derive the traffic demand
from data about the population and its behaviour in
the regarded area. Other structural information, e. g.,
the location and size of schools can also impact the
simulated traffic situation, as investigated in (Ma et
al., 2020). In that research, SUMO was used in
combination with the tool Activitygen to simulate a
realistic traffic environment and the results were
compared to real traffic data. An alternative approach
is used in (Maiorov et al., 2019) by splitting a large
traffic region in multiple sections. Applying a
gravitational model and incorporating structural data
of the region, origin-destination (OD) matrices
describing the traffic flows between the sections are
created and used for route generation. In (Lobo et al.,
2020), a method is presented to create a traffic model
of an urban area using SUMO, Activitygen and an
iterative routing approach. This is based on real traffic
measurements and includes realistic programs for
some TLS.
To obtain the road network, data from
OpenStreetMap (OpenStreetMap contributors, 2022)
can be imported and converted to the SUMO
standards. A topological analysis of such a road
network based on graph theory was performed by
(Henning et al., 2017). Using several metrices, e. g.,
Betweenness Centrality and Closeness Centrality, a
topology-based method was applied to identify
important roads of the network. The results of such an
analysis can be used by control systems or traffic
planers to improve the traffic situation. A similar
graph-based approach was taken by (Ahmadzai et al.,
2019) to rate a city’s road network.
The components of the planned control system are
also based on prior research analysing different
aspects. In (Farrag et al., 2020), information about the
simulated traffic obtained via Car2X technology is
used to identify and react to local traffic incidents
(e. g., blocked lanes). Using this information
subsequent vehicles can reduce their velocities which
leads to a reduction in time loss. This demonstrates
both, the potential of sharing traffic information and
the capabilities of velocity control. This assessment is
supported by the results of (Guo et al., 2020) who
consider a mixed autonomy traffic situation. They
show that through speed harmonization on roads
leading to known bottlenecks, a better traffic flow can
be achieved, provided there is sufficient sensor
coverage in these areas. In (Malena et al., 2021a) and
(Malena et al., 2021b), we present a validated method
to obtain the traffic state of a real-world traffic area in
real-time using stationary detectors. Using this
approach, we were able to control multiple TLS in the
regarded area and to integrate a more suitable target
phase selection for the current traffic situation
(Malena et al., 2022). However, this approach was
limited to a city district of Paderborn and required the
integration of additional sensor systems.
Finally, the subject of vehicle routing is important
for the planned system since it is a key part of the
desired real-time control system, and it is required for
the initial route allocation as well. In (Lazar et al.,
2021), a deep reinforcement learning algorithm is
used for cooperative routing of the autonomous
vehicles in a mixed autonomy environment while
human-driven vehicles rely on selfish route choice.
The research shows that a cooperative approach can
lead to a reduction of travel times even if it is only
applied to a fraction of the vehicles. Similar results
were achieved by (Krichene et al., 2016) indicating
that even a small share of controllable vehicles can be
used to achieve significant improvements.
Furthermore, other possible solutions to remedy the
inefficiency of selfish, non-cooperative routing are
summarised, like pricing congestion or the allocation
of road capacities.
The traffic control system and the simulation
environment presented below are based on the
VEHITS 2023 - 9th International Conference on Vehicle Technology and Intelligent Transport Systems
368
research presented here, combining and extending it.
The SUMO-based simulation is complemented by
new models of sensor systems and TLS. Also, a
routing system was developed including results from
topological analysis and real traffic data.
3 SYSTEM OVERVIEW
In order to describe the simulation model, it is
necessary to understand how it is embedded in the
control loop and to formulate the requirements it has
to meet.
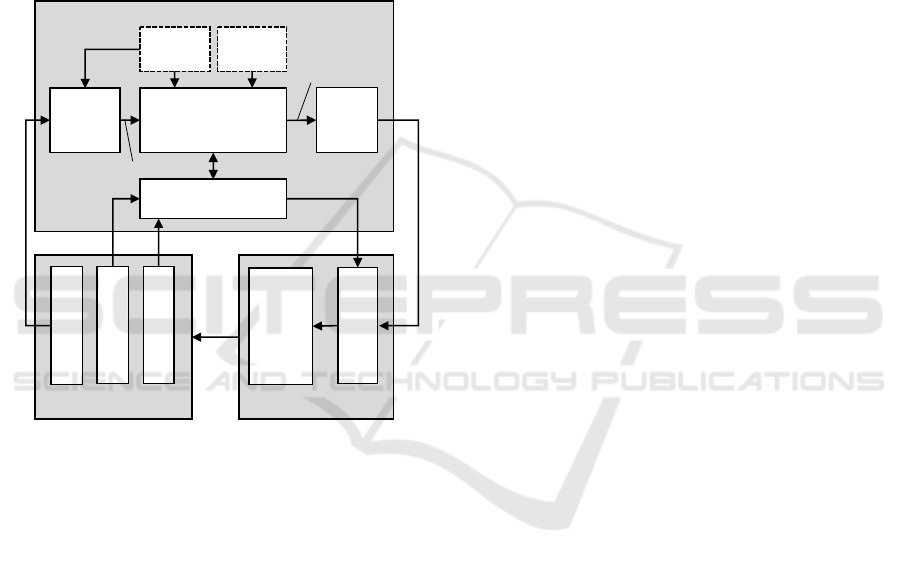
Figure 1: System overview.
The structure of the system which is being
developed is depicted in figure 1 and consists of three
major components: A simulation model, a traffic
observer, and a control system. The latter two serve
as the information processing unit which receives
simulated sensor data from the model and in turn
provides appropriate control inputs. In contrast to
that, the simulation model is a substitute for a real
traffic environment and is used to test the control
system. Therefore, it has to encompass all relevant
components which have a meaningful influence on
the system’s behaviour. It must be able to receive and
apply the given control inputs and generate the
required sensor data based on the system’s state. The
controller provides three means to interact with the
traffic system:
A routing system utilizes the knowledge of the
system state to dynamically find optimised paths to
the given destinations. Such a system must weigh
between multiple criteria, such as route length,
expected travel time, traffic density etc. and suggest a
route-change for compatible vehicles. It is assumed
that autonomous vehicles follow these suggestions
while the drivers of other Car2X-equipped vehicles
can reject them which can be modelled using a
probability-based approach. Other vehicles cannot be
controlled by this system directly, however by easing
traffic demand on critical road sections they are also
expected to experience an indirect positive effect.
The second mean of control is also aimed at
Car2X-equipped vehicles and utilizes the ability to
send them respective target velocities for the road
sections they are located on. If the estimated target
velocity is below the current traffic flow speed it can
be enforced by autonomous vehicles and cooperating
human-driven vehicles. Using consensus algorithms
for a purely autonomous traffic showed that it is
possible to achieve a more homogenous traffic flow
and to reduce undesirable effects like stop-and-go
traffic if the target velocities are chosen appropriately
(Mertin et al., 2020).
Since TLS have a great influence on the traffic
flows, the final control structure is a system to
optimise their performance. Based on the estimated
traffic state on the roads in the vicinity of each TLS,
the waiting times of the affected vehicles and their
vehicle types (if known), a target phase and the
desired switching time is to be calculated and applied
to the traffic system. In our prior research, we have
developed an approach based on Model Predictive
Control (MPC), which is able to improve the
performance of TLS significantly compared to
control systems currently in use (Malena et al., 2022).
An integration of this control approach is therefore
planned for this system as well.
All those presented control systems prerequisite a
comprehensive and up-to-date knowledge of the
current system state in order to provide effective
control inputs. To achieve this, an observer is
currently under development, which processes and
utilizes the data obtained by various sources in the
simulation model. A probability-based traffic
simulation is used to extrapolate the estimated system
state and is continuously updated and corrected by the
incoming sensor data. The accuracy of the estimated
system state of certain areas of the road network
therefore depends on the availability of recent sensor
data. Further details about the observer are subject for
a future publication as soon as implementation and
further tests are completed.
Based on these interactions with other system
components, it is possible to formulate several
requirements for the simulation model: The road
Simulation Model
Control System Traffic Observer
Traffic Dynamics
(SUMO)
Traffic
Demand
Road
Network
AV / Car2X-Vehicles
TLS-
Model
Sensors
TLS-Phases
True State
Sensor Signals
Interaction
Traffic Light Signals
Routing System
Velocity Control
TLS Controller
Sensor Fusion
Probability-
based Traffic
Simulation
Velocity
Targets
Routes
Observed
State
Car2X Data
Simulation Environment for Traffic Control Systems Targeting Mixed Autonomy Traffic Scenarios
369
network has to be selected and provided to the various
system components. The vehicle dynamics must be
modelled containing relevant functions like car-
following-models or lane-change-models. Also, the
behaviour of the different vehicle types has to be
specified, especially the behaviour of autonomous
vehicles. This includes means to set the desired target
velocities and routes. TLS must be integrated in the
road network and the respective controllers must
ensure that the given target phases are applied in a
realistic way. Additionally, the sensors have to be
modelled to generate the required data for the traffic
observer. To test the system under realistic conditions
the traffic demand must be determined and used to
generate appropriate trips which in turn are the basis
to calculate realistic initial routes for the vehicles in
the simulation. In the following section, the
simulation model is described in detail.
4 MODELLING PROCESS
In this section, the simulation environment and its
relevant components are addressed and discussed,
beginning with the selection of the road network and
the model basics. Subsequently, the modelling of the
traffic infrastructure is presented and followed by the
method used for traffic demand generation. The
simulation environment is built on the traffic
simulation software SUMO which is an open-source
tool maintained mainly by the German Aerospace
Center. It is based on a microscopic traffic model and
includes several sub-models e. g., for lane-changing,
car-following behaviour or the reaction of the drivers
to TLS. Therefore, it provides a suitable and
extendable base to meet the requirements listed
above. The system components rely on multiple data
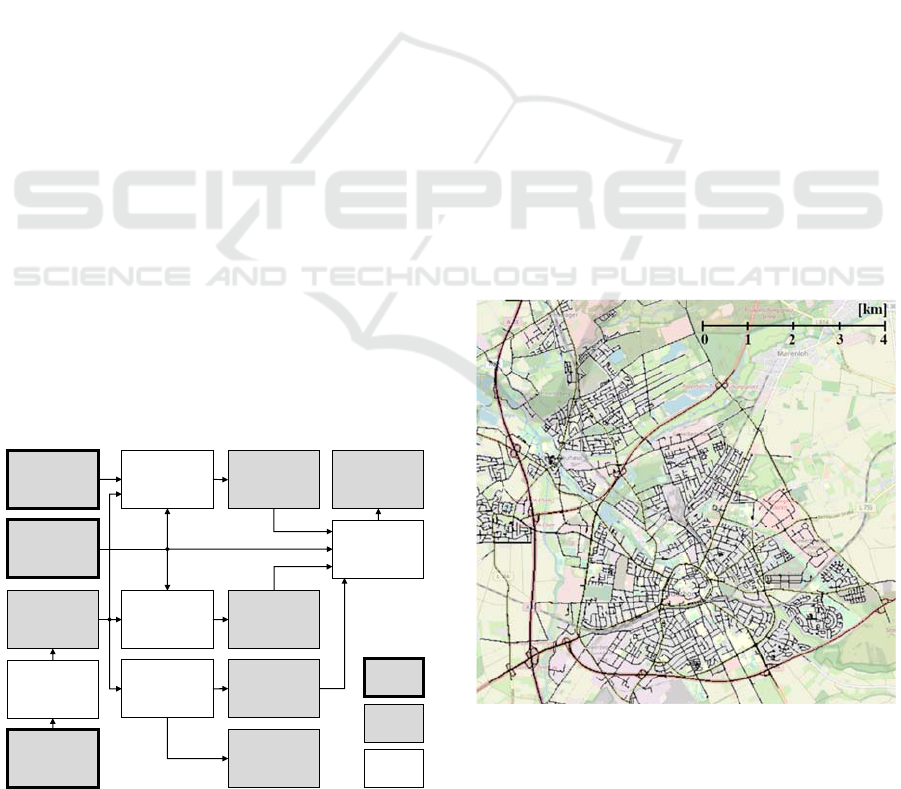
Figure 2: Data processing for the simulation model.
sets to perform their respective tasks. An overview
over the processes needed to generate these data sets
is depicted in figure 2 and will be referred to in the
following sections.
4.1 Traffic Infrastructure
4.1.1 Road Network
The simulation model is based on a real-world traffic
environment to demonstrate the applicability of the
control system to existing road networks. The city of
Paderborn, Germany, and parts of the surrounding
area (see figure 3) serve as a template for the model.
It includes over 960 km of roads (counting both
directions separately) and consists of a wide variety
of road types, from an Autobahn (highway) to
residential streets. Also, there are 137 TLS in the
network which are also considered for the simulation.
Some roads are exclusively for public transportation
and authorities.
The foundation of the road network was imported
from OpenStreetMap (OSM) using the import tool
Netconvert provided by the SUMO toolkit. Although
it provides a useful basis for the model it is far from
being directly deployable for simulation and requires
extensive manual corrections to compensate for
incorrect data. This especially applies to junctions
and the correct definition of the lane connections
indicating which target lanes can be reached from
which origin lanes.
Figure 3: Extract of the selected road network of the city of
Paderborn over the corresponding OSM-map layer
(OpenStreetMap contributors, 2022).
Java Road
Network
Network
Topology
Analysis
SUMO Road
Network
Road Priority
Analysis
Road Priority
Assessment
Traffic
Demand
TLS Config
Data
Initial Vehicle
Routing
SUMO-
ActivityGen
Trips
(Origin-
Destination)
Structural
Data of
Paderborn
Measured
Traffic
Data
Derived
Data
Process
OpenStreet-
Map
SUMO-
Netconvert
Base
Data
VEHITS 2023 - 9th International Conference on Vehicle Technology and Intelligent Transport Systems
370

In order to provide topological network
information to the components of the system (i. e., the
observer and the controller), a tool was developed to
analyse the resulting SUMO road network file and to
create a corresponding graph-representation. This
includes the identification of areas of influence (e. g.,
for TLS based on the distance to them) as well as the
identification of parallel and counter-directional
roads since these are relevant for the control system
design. Another field of application for topological
network information is to integrate the TLS, which is
described below.
4.1.2 Road Priority Assessment
The road network encompassed by the simulation
model has an extensive expanse, however many roads
lead through residential areas, the town centre,
industrial areas, or other regions which are not
intended to be a central vein of transportation.
Especially for the routing-based control system it is
important to consider this since extensive routing
through these areas might cause problems or
discontent among the residents. The importance of a
road is represented by OSM in a priority class which
is based on its role (e. g., highway, federal road), the
number of lanes, etc.
On the other hand, it is important to identify
which roads are most valuable for the traffic system
due to the location or connections to other roads. A
mean to incorporate this is to introduce a numerical
priority rating for each road section as a combination
of several criteria. An established method to rate the
importance of a node in a graph is the Betweenness-
Centrality. It is an indicator of how often a given node
is part of the least costly connection between any two
nodes in the graphs. To apply this to the road network,
it is converted to a line graph that allocates a node to
each road. The connecting edges are created based on
the reachable follow-up roads at each junction. The
cost associated with each edge is set using two
different attributes of the roads. This leads to two
independent graphs: One weighed with the length of
the respective roads and the other with the free travel
time on them (i. e., the length divided by the speed
limit). These attributes were selected because both
play an important role for drivers’ route decisions and
should therefore both be regarded. Consequently, the
Betweenness Centrality is calculated for both cases.
To combine the priority rating 𝑟
,
for road 𝜏
from OSM with the values obtained by the graph
analysis using Betweenness Centralities based on
distance and travel time (𝑟
,
,𝑟
,
), an optimisation
problem is formulated. The goal is to find the
weighting 𝑤∈ℝ
for the different rating approaches
that minimizes the quadratic deviation between a
linear combination of the ratings and actual traffic
data 𝑣
for 𝑛 measurement locations available in
Paderborn with
𝑤=argmin
∈
ℝ
∑
𝑣
−
𝑟
,
𝑟
,
𝑟
,
⋅𝑤
.
(1)
In Paderborn, these measurements were acquired by
a traffic count from 2018 and include the vehicles
detected per day at about 300 locations within the
network. The resulting weighting 𝑤 is used to
calculate a single value in the range 0 to 1.
4.1.3 Traffic Light Systems
As stated above, TLS are a key part of urban traffic
environments since they exert an immediate influence
on the traffic flows. SUMO supports the integration
of TLS and the simulated traffic participants abide to
the signal lights. However, it is up to the user to
ensure that the TLS behave as expected. This is not
limited to the selection of the TLS-phases (which is
the responsibility of the control system) but also to
the way they are implemented, e. g., regard the
minimum green durations and transition times and
avoid incompatible signal combinations. Depending
on the junction’s geometry and the desired phase
transitions these details can have a significant impact
on the transition times and therefore should not be
neglected. To ensure that TLS in the simulation
comply with, the official guidelines for TLS in
Germany, RiLSA (RiLSA, 2015), a controller was
developed that commands the signal lights based on
the current TLS state and the desired target phase. It
ensures the adherence to the yellow signal change
time, the minimum green time and red clearance for
conflicting signals. The basics of the underlying
controller logic applied to each signal of a TLS are
depicted in figure 4.
Each TLS-signal may control multiple lanes, but
a lane is not limited to a single signal. E. g., a right-
turning lane can be released by the ‘main’ green light
or by a right-arrow green signal provided it has no
dedicated red light. Depending on the current state of
each signal and the selected target phase, a series of
checks is performed to decide whether a state
transition is permitted or must be postponed. This
might even result in an active signal to be turned to
red temporarily in order to allow a dependent signal
to switch to green. The mutual relationships and
dependencies of the signals depend on the geometry
and conflict areas of the intersection. Lanes with no
Simulation Environment for Traffic Control Systems Targeting Mixed Autonomy Traffic Scenarios
371
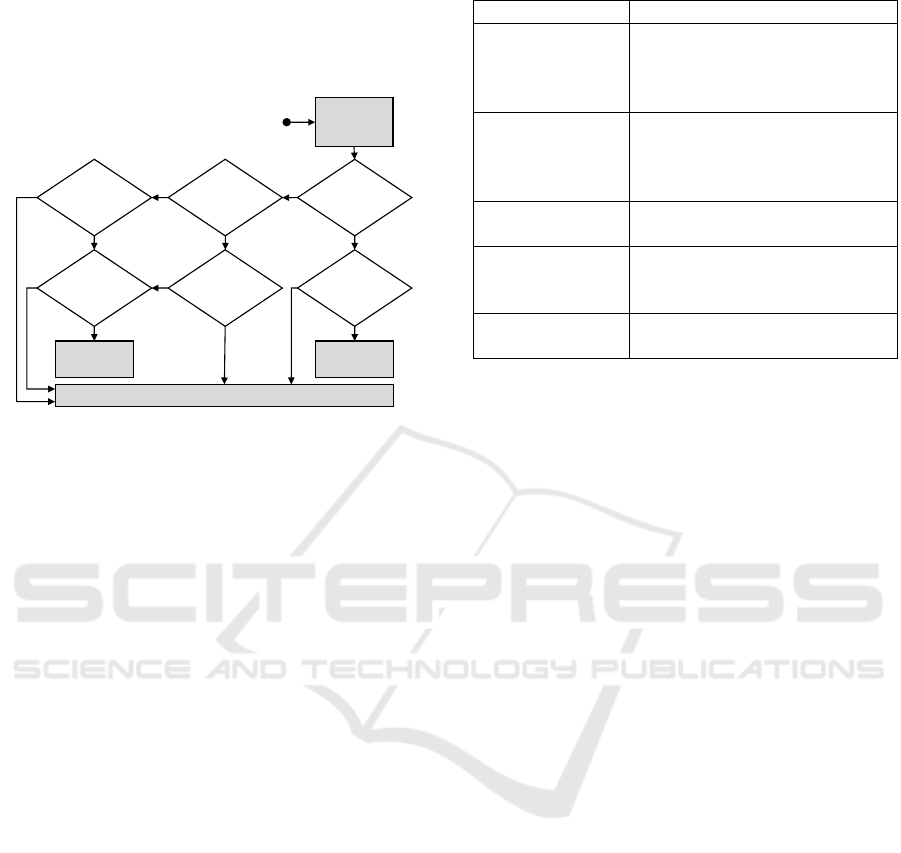
conflicting points and active signals can be controlled
independently. They impose no restrictions for the
controlling signals while lanes from a crossing street
must not receive green if there are any conflicting
areas.
Figure 4: TLS controller logic (Malena et al., 2022).
An automated analyses is performed for each
junction comprising TLS which generates plausible
datasets to setup the simulation and the controller
based on geometrical features. Depending on the
incoming and outgoing lanes and the connections
between them, a TLS setup is selected, and matching
signals and phases are generated. Also, restrictions
like minimum green times and transition times are set
based on that. For TLS with unusual setups or to
incorporate actual phase plans the configuration
datasets can be adjusted manually to ensure a realistic
behaviour.
4.1.4 Traffic Sensors
In a real-world scenario, the sensors are a vital part of
the traffic control system since they are the only
source of information about the current traffic state.
To test the developed system under realistic
conditions, it is therefore required that suitable data
packages are generated by ‘virtual’ sensors based on
the known system state of the simulation model. In
this research, there are five different sources of
information modelled. They vary in terms of the
provided data as well as the time at which the data is
shared. The sensor types with the corresponding
information they provide are listed in table 1.
Table 1: Simulated sensors and their provided information.
Data Source Transmitted Information
Car2X-equipped
vehicles
- Own position
- Own velocity
- Own route (if available)
- Own vehicle type
Autonomous
vehicles
- All Car2X-vehicles’ data above
- Nearby vehicles’ positions
- Nearby vehicles’ velocities
- Nearby vehicles’ types
Induction Loops - Time of detections
- Current occupation status
Radar Detectors - Time of detections
- Detected vehicles’ velocities
- Detected vehicles’ types
Aggregated data
sources
- Average traffic density over a
given time span (delayed)
Induction loops are placed at the stopping lines of
each incoming lane at a TLS. Furthermore, for TLS
containing multiple lanes per direction, additional
induction loops are set up to 40 meters ahead of the
junction, as this is a common setup in Paderborn.
Induction loops are prone to errors especially if
crossed by small vehicles which do not inflict a huge
impact on the inductivity of the sensor. To model this,
a vehicle type-dependant probability is defined to
determine if the crossing of a road user is actually
registered by the sensor. Radar detectors are also
stationary and placed manually on the road network.
They are intended to augment the data collection
efforts on road sections which do not feature
induction loops but exhibit a sufficiently high traffic
volume that would justify an installation of such a
device. Radar detectors provide more reliable
measurements than induction loops. Also, they are
able to gather additional information like the crossing
vehicles’ velocities and vehicle types (which is also
affected by a type-dependent misclassification
probability). To generate the sensor data packages,
the set 𝐿
,
containing all vehicles 𝑖 on lane 𝑧 at the
current time step 𝑘 is considered. For each vehicle
being on the lane for one of consecutive time steps,
i. e., 𝑖∈𝐿
,
∪𝐿
,
, the following cases are
checked using the vehicles’ positions 𝑥
,
on their
respective lane and the positions 𝑝
of the lanes’
respective sensors:
𝑖∈𝐿
,
∧
𝑥
,
≥𝑝
∧
𝑖∉𝐿
,
𝑖∈𝐿
,
∧
𝑥
,
≥𝑝
∧
𝑥
,
<𝑝
(2)
𝑖∈𝐿
,
∧
𝑥
,
<𝑝
∧
𝑖∉𝐿
,
.
If any of the three conditions apply, a sensor crossing
was determined. Consequently, the corresponding
data is read from the known true simulation state and
Min.
green time
reached?
*Conditions:
No conflicting phase active?
Red clearance time for all conflicting phases reached?
Are above conditions also met for all dependent signals?*
Other
green signal
blocked?**
All conditions
met?*
Initiate
switch to r
Wait for next time step
Initiate
switch to g
State: g/u
Target: r
State: g/u
Target: g
State: r/y
Target: g
false
Get current
and target
signal state
**To prevent a permissive signal from becoming green if it would receive
the right-of-way over another green signal (prohibited by the RiLSA)
Signal states
g:Green r:Red
y: Yellow u: Red & Yellow
false
false
false
false
false
true
true
true
true
true
true
VEHITS 2023 - 9th International Conference on Vehicle Technology and Intelligent Transport Systems
372

modified based on the misdetection and
misclassification probabilities according to the type
of sensor. The data package is provided to the traffic
control system without additional delay since the
transmission time is neglectable compared to the
simulation step size (Δ𝑡=1 𝑠) when using a suitable
transmission protocol.
Due to the usage of Car2X communication
technology by some traffic participants, these can be
utilized as moving data sources. It is assumed that
they share their current position, velocity, and the
route they are on, if set. Additionally, autonomous
vehicles provide information which they gather from
their environment. Thus, the position, velocity and
type of nearby vehicles are transmitted as well.
Especially at junctions this can concern vehicles on
multiple lanes, therefore a comparison of the state of
the current lane is not sufficient. To preselect the
vehicles which might be in range of autonomous cars,
the road network is divided into a grid with several
100m-by-100m fields. Each vehicle is allocated to the
corresponding field using its coordinates once per
time step. Thus, to determine the nearby vehicles it is
sufficient to check the distance to the vehicles in the
current grid-field and all neighbouring fields. This
reduces the number of checks to be performed
significantly. Similar to the stationary sensors it is
assumed that the data packages from Car2X-equipped
vehicles are gathered each time step with no
additional delay.
The final method to get information about the
traffic are sources that aggregate data using different
sensors before sharing it. These do not provide data
of individual vehicles but instead estimate the traffic
density on road segments of the network. Data like
this can be gathered by using cell phone information
e. g., via navigation apps or detecting and counting
nearby Bluetooth devices. The aggregated data is not
available in real-time but can still be important for a
traffic control system, especially for routing purposes
and areas of the network without a great sensor
coverage. While the collection methods are not
modelled in detail, the aggregated traffic density over
a certain time period is modelled using a moving
average of the vehicle count for each lane and
delaying it further.
4.2 Traffic Demand
The fixed road infrastructure and the sensor systems
are the base of the simulation model. However, to
perform simulations the traffic itself has to be
modelled as well. This includes the definition of the
vehicle types and their respective behaviour as well
as the generation of the traffic demand to fill the road
network in a plausible way.
In the SUMO traffic simulation eight different
vehicle types are used, e. g. passenger-cars or busses.
Additionally, there are autonomous variants of most
of the types. For human-driven vehicle types the
parameters are configured to randomly deviate from
an ‘ideal’ driving behaviour. This may result in
divergences from the speed limits, not keeping a
sufficient distance to the preceding vehicle, or an
impatient behaviour at junctions regarding the right-
of-way. For autonomous vehicles these deviations are
disabled since a computer-driven car would not
deliberately violate the traffic rules and cannot be
distracted. Moreover, autonomous vehicles can be
controlled by the traffic control system to some
degree.
4.2.1 Trip Generation
The goal of the traffic generation is not to recreate the
exact traffic which is present in Paderborn on a given
day (this would require to monitor each traffic
participant individually), but to create a plausible
traffic situation that resembles the real traffic. The
first step is to generate the trips that are to be carried
out during the simulation. A trip defines the origin
and the destination a vehicles’ route has to connect as
well as the departure time. Therefore, the entirety of
all trips represents the demand for mobility in the
network without prescribing how it is realized. The
(initial) routes the vehicles should take are
determined in a subsequent step (see section 4.2.3).
SUMO already includes the application Activitygen to
generate trips based on a given road network and
additional information about the environment which
must be provided externally. These include statistical
data about the population in Paderborn, like
population count, demographics, employment rate,
car ownership rate, etc. Also, information about the
number of incoming and outgoing commuters as well
as an approximate distribution of the usual working
hours are given. This information was mainly
obtained by publicly available data published by the
City of Paderborn.
Furthermore, information directly related to the
road network was provided that includes the position
and size of schools in the regarded area, since they are
a common destination for many trips at certain times
of the day. Also, the main roads leading in and out of
the road network were specified including the number
of vehicles traveling on them each day. For most of
the relevant roads this information could be obtained
from the traffic count mentioned above. The traffic
Simulation Environment for Traffic Control Systems Targeting Mixed Autonomy Traffic Scenarios
373

which is generated from and to a certain road is
dependent on the number of residents that live there,
and the number of workplaces located nearby. This is
not uniform for all roads and can vary significantly
depending on the location. As there are more than
40,000 road sections in the road network, a manual
setting is not practical, and an alternative method was
used.
To more efficiently allocate numerical values to
the different road edges an image-based method was
developed. It uses the RGB colour channels of a new
layer which is added to the map displayed in figure 3
to encode the required information. Consequently,
areas on the map can be marked according to their
position and function with different colour intensities.
A transformation function is used to map each
network coordinate to the corresponding pixel of the
image. Thus, for each road edge a central coordinate
is determined, the corresponding pixel is selected, and
the respective value is read based on the red
component of its RGB value using a conversion
factor. Note that this is a relative value and the total
number of workers and inhabitants to be allocated is
calculated based on the statistical data mentioned
above. Since there is no data available for Paderborn
that shows the population density or the density of
workplaces in the level of geographical detail
required, the areas on the map are marked based on
their urban development and function. Residential
areas receive a higher-than-average rating for the
number of inhabitants while exhibiting only a limited
number of workplaces. For industrial areas on the
other hand an inverse structure is defined, and the city
centre exhibits high values in both regards. Using this
input data Activitygen creates a set of trips which is
subsequently used as basis for the routing algorithm
presented in the next section to generate the actual
initial traffic.
4.2.2 Routing
The routing process determines how the OD pairs
defined in the trips are connected. Note that this initial
routing is performed for all generated trips, however
the planned control system can allocate new routes
for autonomous vehicles and cooperating Car2X-
equiped vehicles online once it is integrated. The
routing can be done by representing the road network
as a graph and applying a pathfinding algorithm.
Unlike the line graph used in the road priority
analysis, here the junctions are represented by the
nodes and the roads are modelled by the edges. This
enables a direct connection between the cost and the
associated attributes of the roads. However, a simple
distance or time-based allocation would be unsuitable
here, because in a road network the shortest way
might lead through the city core or residential areas
which is not desirable. Also, such a method would not
consider the actions of other road users and could lead
to smaller roads experiencing more demand than they
could handle while better developed roads might not
use their full capacity during critical traffic situations.
In addition, a traffic scenario shall be simulated that
resembles the real traffic situation in Paderborn,
which therefore must be taken into account during the
routing process. Based on these considerations, the
usage costs for each edge 𝑖 comprise of three cost
components and are recalculated for each trip:
1. Expected travel time (𝐽
,
𝑛
)
2. Road priority assessment (𝐽
,
)
3. Real traffic data (𝐽
,
𝑛
)
The vector 𝑛 contains the number of routes that
includes the respective edge 𝑖 and the vector 𝑟
represents the weighting factors for the cost
components. The resulting costs for crossing edge 𝑖
are therefore:
𝐽
𝑛
=
𝐽
,
𝑛
𝐽
,
𝐽
,
𝑛
⋅𝑟.
(3)
The expected travel time is a major influencing
factor for drivers’ routing decisions and must be
considered. It can be estimated using the length 𝑙
of
the considered road section and the expected travel
speed on it. Under ideal circumstances (no other
traffic present) this is equal to the speed limit 𝑣
,
on this road. With increasing traffic demand 𝑛
on
this road the expected speed decreases which is
modelled by the monotonously falling function
𝑓
𝑛
∈
0,1
and leads to
𝐽
,
𝑛
=𝑙
⋅
𝑣
,
⋅
𝑓
𝑛
.
(4)
The second cost factor 𝐽
,
is based on the results
of the road priority assessment and depends on the
importance of the road for the network. More
important roads are associated with lower costs while
lower rated roads result in higher costs. In this case, a
linear relation to the priority value was selected.
In order to match the recreated traffic according
to the real traffic measurements, a third cost factor
𝐽
,
𝑛
is introduced for roads with available
measurement data. This factor adds additional costs
to these roads if the current number of routes
containing this road 𝑛
exceeds the number of
vehicles 𝑛
,
recorded by the measurements. Since
the latter value refers to a whole day of
measurements, it is corrected by the share of all
VEHITS 2023 - 9th International Conference on Vehicle Technology and Intelligent Transport Systems
374
allocated routes related to the number of all recorded
vehicle crossings on all observed roads resulting in
𝐽
,
𝑛
=max0,𝑛
−𝑛
,
∑
∑
,
.
(5)
The total costs for a route are calculated by adding
up the costs 𝐽
𝑛
of all contained edges 𝑖. To
estimate the best route between the given origin and
destination of a trip Dijkstra’s algorithm is applied to
the graph which is guaranteed to find the connection
with the lowest associated costs. As the initial routing
is performed prior to the actual traffic simulation
there is no need to use a faster but less reliable
algorithm. Also, the order in which the trips are
processed is selected randomly and not
chronologically by their departure time which is
intended to further diversify the routes connecting
different parts of the road network. This way
alternative route options for similar connections are
possible from early on and not after a certain
simulation time to reach the threshold to switch to
another route option (e. g., when the estimated
traveling time-related cost increases for a road section
due to the increased number of routes).
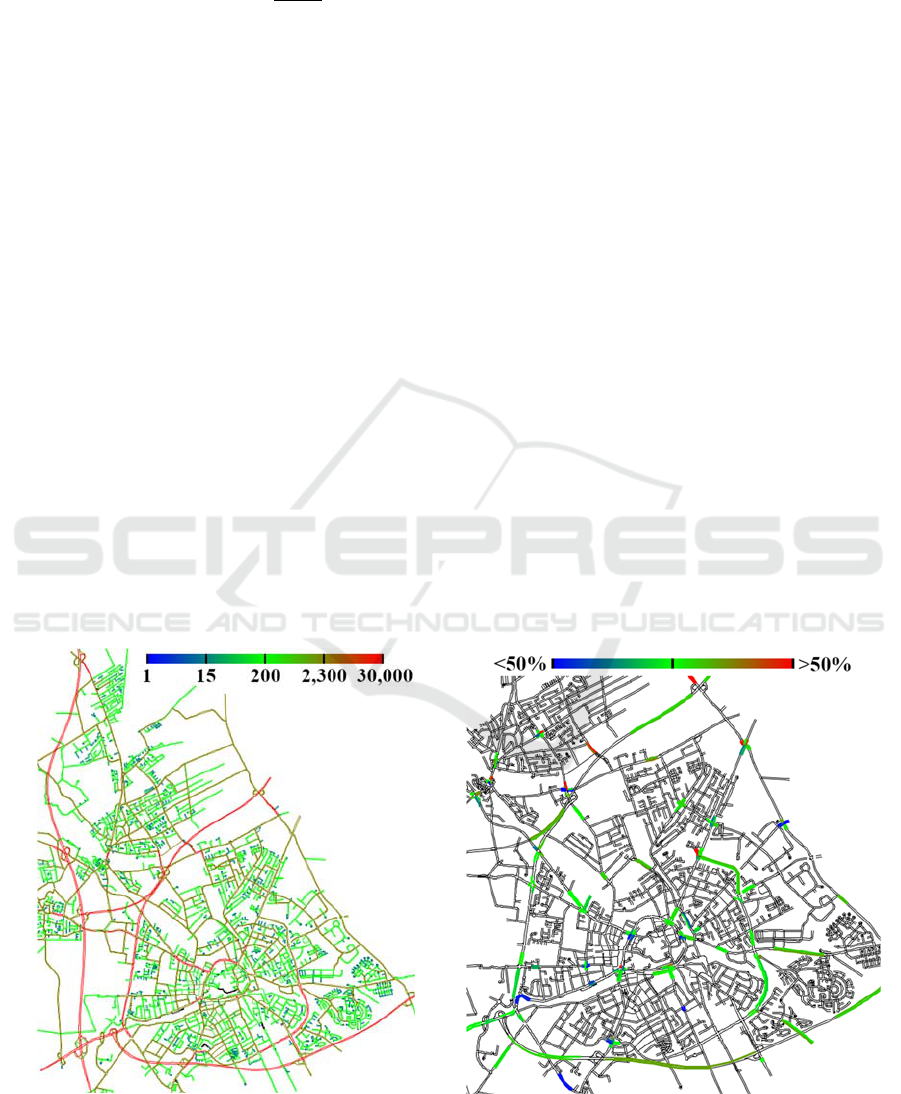
In figure 5, the number of allocated routes for
each road section is depicted on the left side. To better
illustrate the differences on lower frequented roads a
logarithmic colour coding was used. Generally, it can
be seen that Paderborn’s main roads have a greater
number of routes allocated to them while roads in
residential areas or the city centre exhibit much less
demand, which is realistic. To compare the
accordance of the generated routes to the
measurement data, at each available measurement
location the share of realized detections it calculated
(𝑛
/𝑛
,
). The average share for all sensor locations
equals to 100,3% with a variance of 7,3%. An
overview over the deviations of the number of routed
vehicles from the measured data is depicted on the
right side of figure 5. The number of detected and
routed vehicles at the sensor positions are generally
similar although locally the number can deviate
slightly in both directions. A reason for that might be
that not all features of the road network could be
modelled for the Activitygen application, e. g.,
companies with many employees outside dedicated
industrial areas or shopping centres which would
have exceeded the limits of this research.
To show the temporal distribution of the traffic
demand, figure 6 includes the cumulated detection
rates at multiple sensor locations. This is compared to
the cumulated crossing rates resulting from the
generated routes at these positions. There is a good
accordance between both datasets. Both, the morning
and afternoon rush hours are clearly visible and the
values generally match. Slight deviations e. g. at 3:00
and 17:00 are most likely caused by the probability-
based approach for trip generation. Note, that all
crossings registered for a route are allocated to its
departure time on the horizontal axis which explains
the small offset e. g. at 7:00.
Figure 5: Left: Number of routes for each road section (logarithmic) / Right: Deviation routes count from measurements.
Simulation Environment for Traffic Control Systems Targeting Mixed Autonomy Traffic Scenarios
375
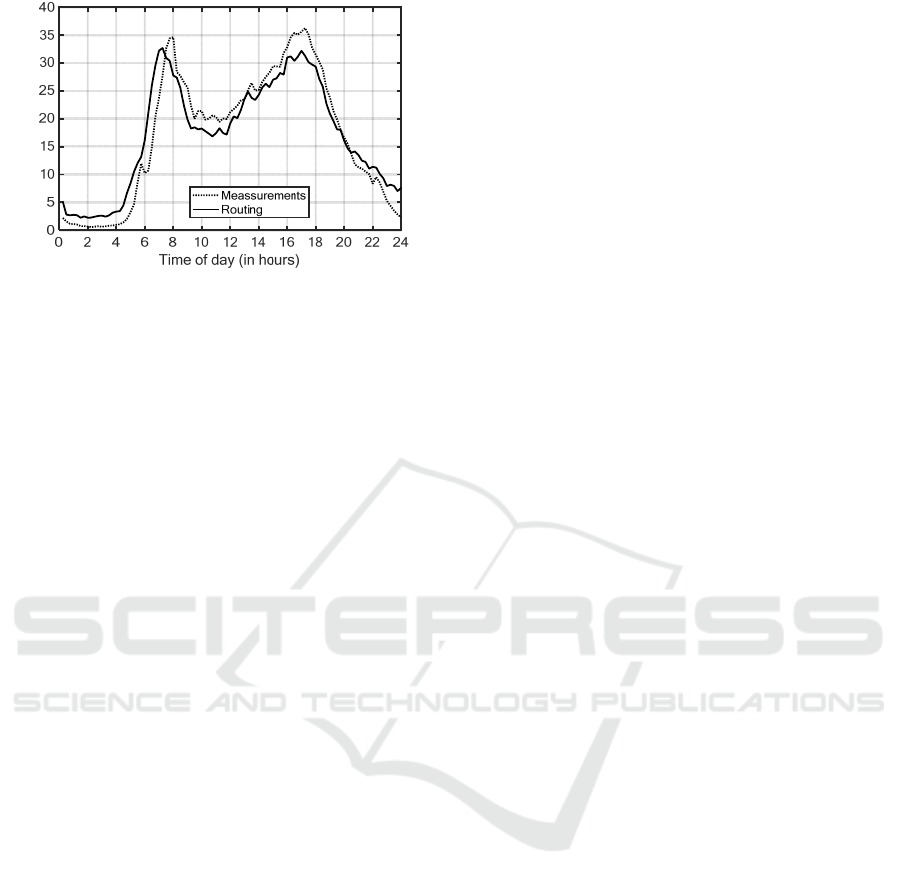
Figure 6: Comparison of the measured detection rates and
the generated routes for a whole day at 54 locations.
5 CONCLUSION
In this paper, the modelling of a simulation
environment based on the city of Paderborn for a
future traffic scenario was presented. The simulation
model is built on the software SUMO which handles
the basic vehicle dynamics and is extended by
multiple components. The road network was
imported from OSM, revised manually, analysed, and
converted to a graph representation. Based on that, a
road priority analysis is preformed using different
metrics as well as real traffic data in order to rate the
different road sections’ importance for the whole
system. The results are used in the routing process
and are also useful for the traffic control system
currently in development. To accurately reproduce
the influence of TLS and ensure that they obey the
guidelines and restrictions of the RiLSA, a controller
was designed to implement a given target phase
selected by the control system. Using geometrical
features of the road network, signals, phases, and
additional configuration data were generated
automatically for the TLS. Also, different sensor
types were modelled which support both, stationary
and mobile data collection in order to provide realistic
information to a traffic observer system. To populate
the simulated roads, multiple vehicle types were
created for human-driven and autonomous vehicles.
Based on the road network, statistical and structural
data of Paderborn, trips were generated containing the
desired origin and destination as well as the departure
times of vehicles in the system. Finally, to create
realistic routes, a pathfinding method utilizing a
dynamic cost estimation method was applied.
The next step is the integration of the mentioned
traffic observer to reconstruct a picture of the current
traffic state based on the gathered sensor data. An
observer is currently under development and relies on
a probability-based approach to describe the vehicles’
positions. Key of such a system is the handling of
uncertainty due to incomplete sensor coverage and a
realistic extrapolation of the vehicles’ behaviour. An
in-detail description and evaluation of this system
will be subject for a future publication. Also, the
development and integration of the traffic control
system is due for the future.
ACKNOWLEDGEMENTS
This research was enabled by the Karl-Vossloh-
Stiftung, and we thank them for their support.
REFERENCES
Ahmadzai, F., Rao, K. L., Ulfat, S. (2019). Assessment and
modelling of urban road networks using Integrated
Graph of Natural Road Network (a GIS-based
approach). In Journal of Urban Management, 8(1),
109-125.
Farrag, S. G., Outay, F., Yasar, A. U. H., Janssens, D.,
Kochan, B., Jabeur, N. (2020). Toward the
improvement of traffic incident management systems
using Car2X technologies. In Personal and Ubiquitous
Computing, 25(1), 163-176.
Guo, Y., Ma, J. (2020). Leveraging existing high-
occupancy vehicle lanes for mixed-autonomy traffic
management with emerging connected automated
vehicle applications. In Transportmetrica A: Transport
Science, 16(3), 1375-1399.
Henning, S., Biemelt, P., Abdelgawad, K., Gausemeier, S.,
Evers, H. H., Trächtler, A. (2017). Methodology for
determining critical locations in road networks based on
graph theory. In IFAC-PapersOnLine, 50(1), 7487-
7492.
Krichene, W., Castillo, M. S., Bayen, A. (2016). On social
optimal routing under selfish learning. In IEEE
transactions on control of network systems, 5(1), 479-
488.
Lazar, D. A., Bıyık, E., Sadigh, D., Pedarsani, R. (2021).
Learning how to dynamically route autonomous
vehicles on shared roads. In Transportation research
part C: emerging technologies, 130, 103258.
Lobo, S. C., Neumeier, S., Fernandez, E. M., Facchi, C.
(2020). InTAS--The Ingolstadt Traffic Scenario for
SUMO. arXiv preprint arXiv:2011.11995.
Lopez, P. A., Behrisch, M., Bieker-Walz, L., Erdmann, J.,
Flötteröd. Y. P., Hilbrich, R., Lücken, L., Rummel, J.,
Wagner, P., Wießner, E. (2018). Microscopic traffic
simulation using SUMO. In 2018 21st international
conference on intelligent transportation systems (ITSC)
(pp. 2575-2582). IEEE.
Ma, X., Hu, X., Schramm, D. (2020). Effects of school
activities on traffic flow on the example of traffic
Detections
pe
r
hou
r
(x1000)
VEHITS 2023 - 9th International Conference on Vehicle Technology and Intelligent Transport Systems
376

scenario from the city Wuhan. In Neue Dimensionen
der Mobilität (pp. 153-163). Springer Gabler,
Wiesbaden.
Maiorov, E. R., Ludan, I. R., Motta, J. D., Saprykin, O. N.
(2019). Developing a microscopic city model in SUMO
simulation system. In Journal of Physics: Conference
Series (Vol. 1368, No. 4, p. 042081). IOP Publishing.
Malena, K., Link, C., Bußemas, L., Gausemeier, S.,
Trächtler, A. (2022). Traffic Estimation and MPC-
Based Traffic Light System Control in Realistic Real-
Time Traffic Environments. In International
Conference on Vehicle Technology and Intelligent
Transport Systems, International Conference on Smart
Cities and Green ICT Systems (pp. 232-254). Springer,
Cham.
Malena, K., Link, C., Mertin, S., Gausemeier, S., Trächtler,
A. (2021a). Online State Estimation for Microscopic
Traffic Simulations using Multiple Data Sources. In 7th
International Conference on Vehicle Technology and
Intelligent Transport Systems (pp. 386-395).
Malena, K., Link, C., Mertin, S., Gausemeier, S., Trächtler,
A. (2021b). Validation of an Online State Estimation
Concept for Microscopic Traffic Simulations. In 2021
IEEE Transportation Electrification Conference &
Expo (ITEC) (pp. 212-217). IEEE
Mertin, S., Malena, K., Link, C., Gausemeier, S., Trächtler,
A. (2020). Macroscopic Traffic Flow Control using
Consensus Algorithms. In 2020 IEEE 23rd
International Conference on Intelligent Transportation
Systems (ITSC) (pp. 1-8). IEEE.
OpenStreetMap contributors (2022). Paderborn Map, from
https://www.openstreetmap.org.
Forschungsgesellschaft für Straßen- und Verkehrswesen
(2015). Richtlinien für Lichtsignalanlagen. RiLSA:
Lichtzeichenanlagen für den Straßenverkehr. FGSV R1
- Regelwerke, FGSV-321, Köln
Schweizer, J., Rupi, F., Filippi, F., Poliziani, C. (2018).
Generating activity based, multi-modal travel demand
for SUMO. In EPiC Series in Engineering, 2, 118-133.
Simulation Environment for Traffic Control Systems Targeting Mixed Autonomy Traffic Scenarios
377
