
Imperviousness Density Mapping Based on GIS-MCDA and
High-Resolution Worldview-2 Imagery
Lovre Panđa
a
University of Zadar, Department of Geography, Trg kneza Višeslava 9, Zadar, Croatia
Keywords: WorldView-2, Imperviousness Density, GIS MCDA, LULC, NDVI, Slope, TWI, Urban Area, Zadar, Croatia.
Abstract: Accurate monitoring and extraction of impervious surfaces are essential for urban planning and sustainable
environmental management. Increasing urbanization has led to a significant increase in the extent of
impervious surfaces, which, along with climate change, are the leading cause of increasingly frequent flooding
in urban areas. To prevent flooding disasters in urban areas, flood hazard and risk analyses must be carried
out. An imperviousness density model is one of the most important criteria in such analyses. In this study, an
imperviousness density model of the city of Zadar was created using GIS-MCDA and four criteria (LULC,
NDVI, slope and TWI). The criteria were extracted from WorldView-2 (WV-2) imagery and linearly
standardized using the Fuzzy logic approach. The Analytic Hierarchy Process (AHP) was used to determine
the final model for imperviousness density. The model with a spatial resolution of 0.5 m, based on the WV-2
imagery turned out to be much more detailed than existing publicly available models, such as the Copernicus
imperviousness density model, which is based on Sentinel-2 imagery with a spatial resolution of 10 m.
1 INTRODUCTION
The rapid growth of the world's population and
increasing urbanization have led to a significant
increase in the extent of impervious surfaces in urban
areas (Duan et al., 2022) while decreasing the extent
of forests, wetlands, green areas and bare soil (Xu,
2016). Impervious surfaces are man-made surfaces
covered with materials such as asphalt or concrete
that prevent the infiltration of water into the
underground (Weng, 2012). In urban areas, this can
include asphalted roads, sidewalks, parking lots,
paved yards, airport runways, shipping ports, squares,
cemeteries, etc. Also, a large portion of impervious
surfaces in urban areas are buildings with roofs made
of tile, concrete or sheet metal. Impervious surfaces
have a great impact on the creation of urban heat
islands and flood-prone areas (Fu et al., 2019).
Furthermore, the increasing number of impervious
surfaces can also disrupt the groundwater cycle and
increase the risk of urban flooding (Brun and Band,
2000). To prevent flooding disasters in urban areas,
flood hazard and risk analyses must be carried out. An
imperviousness density model is one of the most
important criteria in such analyses. Impervious
a
https://orcid.org/0000-0003-4549-4481
surface models are created in different ways, but
generally, they can be divided into four main
categories: (1) machine learning methods (Okujeni et
al., 2018; Zhang et al., 2018), (2) spectral indices (Liu
et al., 2013; Sun et al. 2015), (3) regression model
(Okujeni et al., 2013; Ou et al., 2019), and (4) spectral
mixture analysis (Herold et al., 2004; Yang and He,
2017). However, the methods are being improved
every day and new methods are proposed for
extracting impervious surfaces (Su et al., 2022). The
input data is very important for the creation of a high-
quality model. Data is collected from various
multispectral sensors placed on a specific platform
such as satellites, aircraft or drones. The choice of a
platform and sensor affects the spatial, spectral,
radiometric and temporal resolution, which in turn
affects the output results (Aasen et al., 2018).
Multicriteria GIS decision analysis (GIS-MCDA)
has not yet been used to create imperviousness
density models. Various criteria such as land use –
land cover model (LULC), vegetation indices or
hydrological and geomorphological criteria can
certainly be of great help in the detailed mapping of
imperviousness. Publicly available imperviousness
density models created by Copernicus, based on
222
Pan
¯
da, L.
Imperviousness Density Mapping Based on GIS-MCDA and High-Resolution Worldview-2 Imagery.
DOI: 10.5220/0011988200003473
In Proceedings of the 9th International Conference on Geographical Information Systems Theory, Applications and Management (GISTAM 2023), pages 222-229
ISBN: 978-989-758-649-1; ISSN: 2184-500X
Copyright
c
2023 by SCITEPRESS – Science and Technology Publications, Lda. Under CC license (CC BY-NC-ND 4.0)
Sentinel 2 imagery (URL1) are an excellent input for
hydrological-hydraulic analysis based on models of
lower spatial resolutions. However, for analyses
based on higher spatial resolution models, it is
necessary to create an imperviousness density model
that follows the spatial resolutions of other high-
resolution inputs.
The main goal of this research is to generate a
GIS-MCDA imperviousness density model of Zadar
using high-resolution WorldView-2 (WV-2) satellite
imagery with a spatial resolution of 0.5 m.
1.1 Study Area
The study area is the City of Zadar located in the
middle of the Croatian coast (Figure 1). Zadar is the
fifth largest city in the Republic of Croatia and has
gone through rapid urban growth in recent decades
(Magaš, 1991; Graovac, 2004). This research is
focused only on the mainland part of the City of
Zadar, which in total covers 52.36 km
2
(Figure 1).
Figure 1: Geographical position of Zadar.
As a result of rapid urbanization and climate
change, pluvial flooding caused by short-peak rainfall
is becoming more frequent (Hallegatte et al., 2013;
Woodruff et al., 2013). Of particular note is the major
flood event on September 11, 2017, when a rain of
great intensity in a short time (only 2 hours) caused
extreme precipitation and flash floods. The rain of a
slightly weaker intensity continued to fall throughout
the morning and early afternoon and further worsened
the situation. In 24 hours, a total of 285 mm of rain
fell in Zadar causing significant material damage
(DHMZ, 2017).
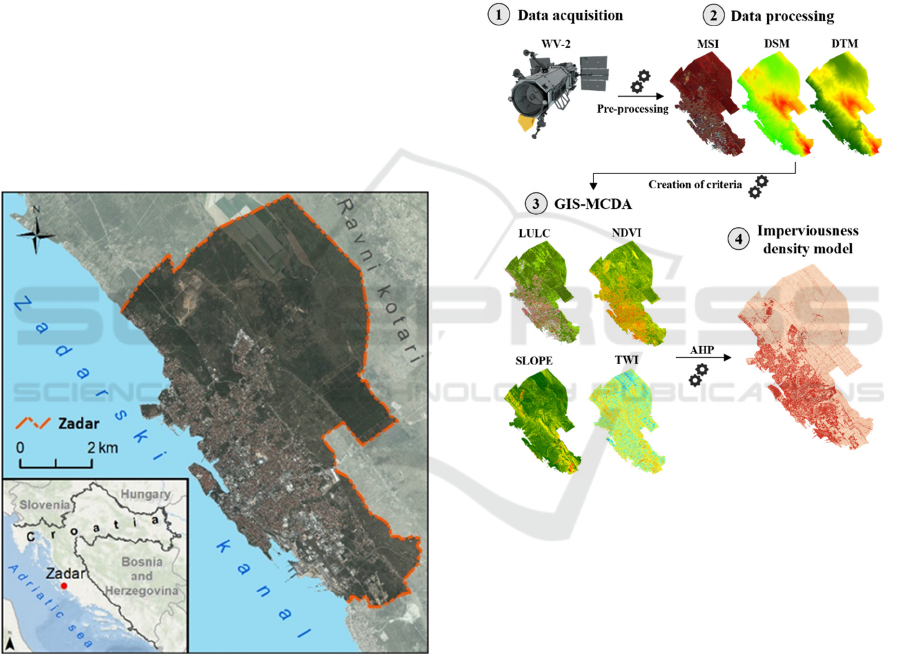
2 METHODOLOGICAL
FRAMEWORK AND DATA
The methodological framework is divided into
several steps that include the acquisition and pre-
processing of satellite imagery, the creation of criteria
for the GIS-MCDA and the GIS-MCDA process itself
(Figure 2).
Figure 2: The methodological framework of the research.
2.1 Acquisition of WV-2 Satellite
Imagery
Launched in October 2009, WV-2 is the first
commercial satellite equipped with a high-resolution
multispectral sensor with 8 spectral bands. The WV-
2 satellite collects data in 8 different spectral bands
and one panchromatic band. The eight multispectral
bands (Coastal, Blue, Green, Yellow, Red, Red Edge,
NIR1 and NIR2) have a spatial resolution of 2 m,
while the panchromatic band has a spatial resolution
of 0.5 m (DigitalGlobe, 2010a; Maxar, 2020).
Since the production of orthorectified
multispectral image (MSI) and high-resolution digital
terrain model (DTM) is planned for the wider area of
the city of Zadar, it was decided to acquire ortho-
ready stereo (OR2A) satellite WV-2 data. OR2A
Imperviousness Density Mapping Based on GIS-MCDA and High-Resolution Worldview-2 Imagery
223

satellite imagery is projected onto a constant
elevation base calculated as the average terrain
elevation within a given polygon. Therefore, OR2A
satellite imagery is suitable for further processing and
orthorectification of a custom high-resolution DTM
(DigitalGlobe, 2010b).
2.2 Pre-processing of WV-2 MSI
Preprocessing of satellite imagery is crucial for the
removal of various deformations and distortions in
satellite images (Campbell and Wynne, 2011).
Therefore, within this manuscript preprocessing has
covered the following four steps:
2.2.1 Creation of a DSM
A digital surface model (DSM) of Zadar was created
from the provided WV stereo images in the
OrthoEngine 2018 extension of Geomatica 2018
software. The entire process of creating a DSM in the
OrthoEngine extension can be divided into the
following steps: (1) Selecting a mathematical model,
(2) adding ground control (GCP) and check points
(CP) required for stereo image orientation, (3) adding
tie points (TP), (4) bundle adjustment, (5) creating of
the epipolar image and (6) the automatic creation of
the DSM.
In the first step, an optimal mathematical model
was chosen for DSM extraction from the WV stereo
imagery, where Optical Satellite modeling based on
rational polynomial coefficients (RPC) and zero-
order polynomial adjustment was chosen, as one the
most commonly used mathematical models (Aguilar
et al., 2013a; Goldbergs et al., 2019).
In the second step, a total of 35 GCPs and 12 CPs,
collected with a real-time kinematic (RTK) GPS,
were added (2) to correct errors caused by the
application of RPC and to improve the overall
georeferencing accuracy (Aguilar et al., 2013a;
Goldbergs et al., 2019).
In the third step, a total of 264 TPs were
automatically collected (3) using stereo imagery pixel
correlation algorithms in Geomatica 2018 software.
In the fourth step, GCPs, TPs and the sensor
geometry generated from the RPC coefficients were
used for bundle adjustment (4) to calculate the exact
position of the satellite at the moment of acquisition.
The fifth step includes the creation of an epipolar
image (5), which represents a stereo pair of images,
where both images are reprojected so that they have a
common orientation and distribution along the
common x-axis (URL2). The created epipolar image
is the basis for the process of automatically creating a
DSM.
The final step of creating a DSM in the
OrthoEngine extension of the Geomatica software is
the automatic generation of a DSM (6) from the
created epipolar image. The method of semi-global
generation (Semi-global matching) of DSM was used
in the process. To achieve the maximum possible
spatial resolution of the created DSM, the pixel
sampling interval was set to the value 1. Thus, the
correlation of the stereo images and the creation of
the DSM was performed with the maximum
resolution of the images, enabling the generation of
the high-resolution model (URL2).
2.2.2 Creation of a DTM
Unlike DSM, which represents the surface of the
relief, natural (e.g. vegetation) and anthropogenic
(e.g. residential buildings, roads, industrial facilities,
etc.) surfaces located on the surface of the relief, a
DTM only represents the surface of the relief (Šiljeg,
2013). Since slope is one of the criteria and an
important criterion for the creation of the topographic
wetness index model (TWI), it was necessary to
create a DTM. The process of a DSM correction and
filtering for the creation of the DTM can be generally
divided into two steps: (1) Automatic correction of
the DSM into the DTM and (2) the manual filtering
of the remaining errors.
The automatic correction of the DSM into the
DTM (1) was performed in the Geomatica 2018
software using the DSM2DTM algorithm, which
enables the automatic filtering of the DSM according
to the given user-defined parameters. The
DSM2DTM algorithm automatically transforms the
DSM into a DTM by applying a series of filtration
steps that progressively remove anthropogenic and
natural elements and smooth the final model by
removing remaining irregularities, such as
depressions and elevations, that do not represent
relief surfaces.
After the automatic conversion of the DSM into a
DTM, it was necessary to manually remove all
remaining errors (2), resulting from the automatic
filtering process. Errors in the created model occurred
mainly in areas covered by water surfaces (e.g. the
sea), where due to the uniformity of the surface, the
software could not perform correlation and
connection of pixels of the satellite imagery. Unlike
artifacts on water surfaces, which include continuous
parts of the model, the errors remaining after
vegetation and anthropogenic objects were removed
were individual, spatially heterogeneous errors that
GISTAM 2023 - 9th International Conference on Geographical Information Systems Theory, Applications and Management
224

could not be removed automatically. Therefore, error
removal was performed manually using the DTM
correction filter from the DEM editing extension of
the Geomatica 2018 software.
2.2.3 Orthorectification of the WV-2 MSI
Orthorectification is one of the most important steps
of satellite data pre-processing (Aguilar et al., 2013b),
which is used to correct the geometry distortions of
the data created during data acquisition (Belfiore and
Parente, 2016). Orthorectification of the WV-2
imagery was performed using OrthoEngine 2018
software, based on the DSM previously created from
the WV-2 stereo imagery. The process was performed
only for one multispectral and one panchromatic
image, where the representation of anthropogenic
objects was better, e.g. less shadows and lower
building distortions. This is especially the case with
tall buildings such as skyscrapers or industrial plants.
In addition to the DTM, available polygons of
anthropogenic objects were also used for the
orthorectification of multispectral and panchromatic
images. Based on the available polygons, a more
accurate orthorectification (true orthorectification)
was performed.
2.2.4 Pan-Sharpening of WV-2 Imagery
Pan-sharpening of satellite imagery combines high-
resolution panchromatic imagery with lower-
resolution MSI, creating a unique MSI with a
resolution equal to the resolution of the panchromatic
image (Belfiore et al., 2016). There are many
different methods for pan-sharpening of satellite
images, which ultimately affect the appearance and
quality of the sharpened images (Belfiore et al., 2016;
Rajput et al., 2019). It should be noted that each
sharpening method degrades the MSI input to some
degree, primarily by deforming the shape or spectral
values of the original image to improve the spatial
resolution of the final image (Cheng and Chaapel,
2010). Although a special Hyperspherical Color
Space (HCS) method (DigitalGlobe, 2010c) was
developed to sharpen WV images, this method did not
prove to be the best solution in the visual comparison
of different sharpening algorithms. However, the
PANSHARP2 algorithm from the Geomatica 2018
software was used to sharpen the WV-2 images,
which caused significantly less distortion of the
spectral values compared to the HCS algorithm and
other algorithms tested.
2.3 Generating Criteria for the
GIS-MCDA
A total of four criteria (LULC, NDVI, slope and TWI)
generated from the WV-2 MSI and the DTM were
used in the GIS-MCDA process.
The LULC model was created using the GEOBIA
method. First, the WV-2 MSI was segmented using
the Mean Shift method (Comaniciu and Meer, 2002).
The spectral detail parameter was set to 15.5, the
spatial detail was set to 15 and the minimum segment
size was set to 20. The band sequence 8 4 1 (NIR2,
Yellow, Coastal) is used, which allows different types
of land cover to be viewed in different colors. This
band combination can be used to quickly identify land
use and land cover (URL3). Vegetation is in red,
built-up areas are in blue, and changes in vegetation
and structures are shown in different colors. A total
of 1,200 samples were collected in six classes (water,
asphalt/concrete/rock, buildings, low vegetation,
forest, and soil). The segmented WV-2 image was
then classified using the Support Vector Machine
(SVM) algorithm (Aguilar et al., 2014; Lin et al.,
2015; Wu et, al, 2017; Mugiraneza et al., 2019). The
created DSM was used as an additional parameter.
NDVI is a measure of the condition or health of
vegetation in a certain area, determined based on the
reflectance of certain spectral values (Maglione et al.,
2014; Moody et al., 2014). Healthy vegetation
reduces the susceptibility of a certain area to the
process of soil erosion, as plants stabilize soil deposits
with their roots and promote the infiltration of surface
runoff into the soil (Arabameri et al., 2020). For this
reason, high NDVI values, which represent healthy
vegetation, also represent permeable areas. The
NDVI model was created based on the spectral bands
of the WV-2 MSI using the following formula
(Maglione et al., 2014):
𝑁𝐷𝑉𝐼 =
(1)
The slope is a measure of the slope of each cell of
the raster surface, i.e. the terrain surface (Gallant and
Wilson, 2000). The Spatial Analyst extension of
ArcGIS 10.1 software was used to create slope
criteria using the Slope tool based on the Horn
method (Horn, 1981). Slope affects the velocity of
surface runoff, with velocity generally increasing as
slope increases (Morgan, 2009). Therefore, the slope
was used as one of the criteria because as the slope
increases, the possibility of water retention and
infiltration into the underground decreases.
The TWI is a hydrological measure of the
potential wetness of a certain terrain, which defines
Imperviousness Density Mapping Based on GIS-MCDA and High-Resolution Worldview-2 Imagery
225

the tendency of a certain area to accumulate water
(Różycka et al., 2017; Raduła et al., 2018). TWI
enables the detection and analysis of different
waterlogged areas (e.g. swamps, sinkholes, ravines,
river valleys, etc.) characterized by high values of this
index, and drier areas (e.g. steeper slopes and
elevations) with low values of this index (Gallant and
Wilson 2000). In this study, TWI was calculated
using the Topographic Wetness Index tool from the
Saga GIS extension for ArcGIS 10.1. The input data
for the calculation of TWI were the slope and the size
of the catchment area.
2.4 GIS-MCDA
Applied GIS-MCDA covered the following three
steps: (1) standardization of criteria, (2)
determination of weight coefficients (W
i
) and (3)
aggregation of standard criteria and W
i
.
The developed six classes of LULC models were
reclassified regarding the infiltration capacity of the
substrate according to the NRCS methodology
(USDA, 2017; Hong and Adler, 2008). Then,
standardization was performed using the Fuzzy logic
approach in ArcMap software. The Fuzzy
Membership tool standardizes the raster criteria
according to the chosen fuzzification algorithm on a
scale of 0-1, where a value of 1 indicates a maximum
membership strength that gradually decreases
towards 0 (ESRI, 2023). The linear method was used
and impervious classes received higher values.
The NDVI criterion was also linearly standardized
with lower NDVI values representing impervious
surfaces being assigned a higher value.
The slope criterion was also linearly reclassified
so that higher slope values represent lower
throughput.
The criterion TWI was linearly reclassified so that
higher index values mean potentially higher
throughput and lower index values mean lower
throughput potential.
The Analytic Hierarchy Process (AHP) was used
to determine the W
i
required for the creation of the
final imperviousness density model. The highest W
i
was assigned to the LULC, which is the most
important criterion in imperviousness density
mapping. The NDVI criterion is the next in terms of
importance, as it allows well distinction between
permeable and impervious surfaces. The smallest W
i
were assigned to the criteria of slope and TWI
because their influence exists, but is not as significant
as, for example, LULC. (Table 1). The CR was 0.1,
which is 10% and is considered acceptable.
Table 1: AHP preference matrix and assigned W
i
for the
created criteria.
LULC NDVI SLOPE TWI W
i
LULC 1 5 8 9 64.79
NDVI 0.2 1 6 7 24.64
SLOPE 0.125 0.167 1 2 6.33
TWI 0.111 0.143 0.5 1 4.24
In the final step, the GIS-MCDA model was created,
based on the aggregation of standardized criteria and
their W
i
.
3 RESULTS AND DISCUSSION
Using the methodology GIS-MCDA and the Fuzzy
logic approach to standardize the criteria, a model of
imperviousness density was created. A total of four
criteria were created and used in the further process
(LULC, NDVI, slope and TWI).
The developed LULC model distinguished
impervious surfaces very well compared to the WV-
2 MSI. The most dominant LULC class within the
study area is forest, while impervious classes
(buildings, asphalt/concrete/rock) are mostly
concentrated in urban coastal parts (Figure 3A).
The NDVI model best showed the difference
between permeable surfaces, shown in shades of
green, and less permeable and impervious surfaces,
shown in shades of red (Figure 3B). Numerous
researchers have used the NDVI and other indices
derived from MSI in impervious surface extraction
(Sun et al., 2015; Feng and Fan, 2019), and therefore
this is certainly one of the more important criteria.
The slope criterion created on the DTM serves as
a criterion that increases the degree of imperviousness
on steeper slopes (Ansari et al., 2016). Within the
research area, leveled and slightly sloping terrain
prevails, which is why, if only this criterion is
considered, most areas have a greater possibility of
permeability. Steeper slopes comprise a very small
part of the research area, which is mainly related to
anthropogenic forms (quarry and waste dump) or
natural slopes, and these areas are marked as less
permeable (Figure 3C).
The criterion TWI distinguished areas that tend to
accumulate water from the topographic basin. The
areas that have a lower tendency to accumulate water,
therefore, have a lower probability of water
infiltration. TWI values within the research area are
determined by the morphology of the relief, with
elevated parts recording lower values of this index,
which indicates less water accumulation (Figure 3D).
On the other hand, the lower parts of the relief record
GISTAM 2023 - 9th International Conference on Geographical Information Systems Theory, Applications and Management
226
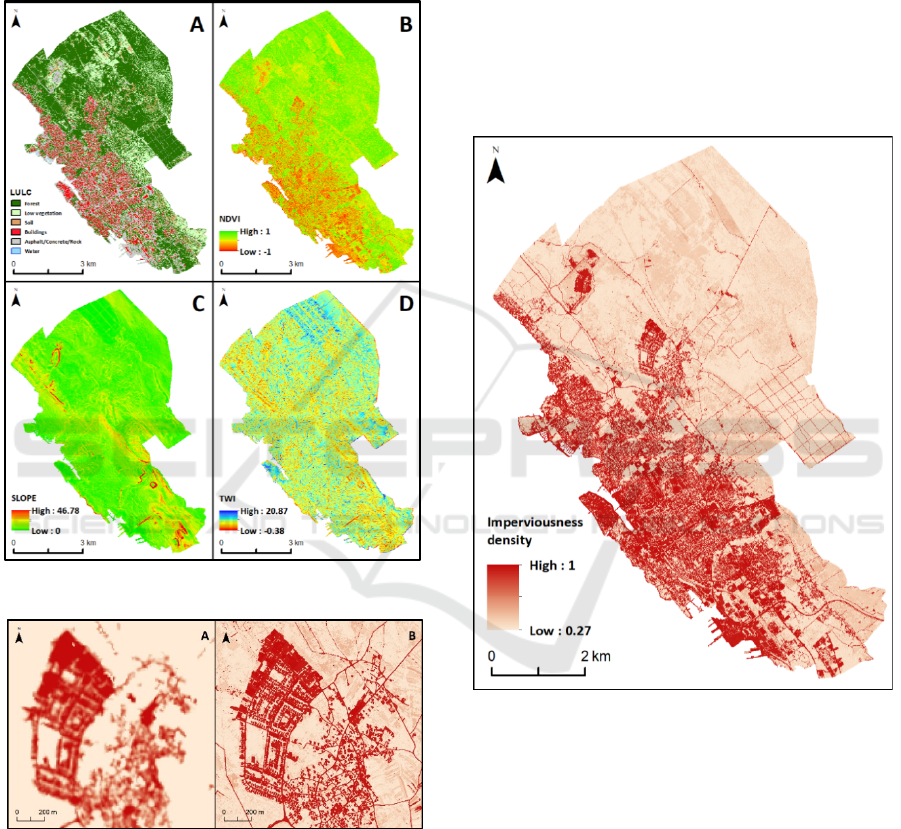
higher values of TWI, that is, they indicate a greater
possibility of accumulating a significant amount of
water. According to TWI, it is possible to distinguish
two areas of water accumulation within the research
area. The first area includes the coastal part including
the center of the city of Zadar, and the second area the
depression on the outskirts of the city.
Figure 3: A) LULC; B) NDVI; C) Slope; D) TWI.
Figure 4: Imperviousness density based on A) Sentinel 2
MSI; B) WV-2 MSI.
The final imperviousness density model created
from four linear standardized criteria shows that there
are no completely permeable surfaces in Zadar
(Figure 5). The lowest value for imperviousness of
0.23 was achieved by surfaces covered with forest,
low vegetation and bare soil, while those covered
with asphalt, concrete and rock have higher values.
Although green areas and bare soil are permeable
surfaces, they have an infiltration capacity that is
overloaded during extreme rainfall, when the
substrate is oversaturated.
Comparing the imperviousness density model
created with a spatial resolution of 0.5 m (Figure 4B),
it is clear that it is significantly more detailed than the
existing 10 m Copernicus model (Figure 4A). A
quantitative comparison of these two models would
not be relevant considering the large difference in
spatial resolution. In the model created from the WV-
2 imagery, objects are extracted in more detail, unlike
the Copernicus model based on Sentinel 2.
Figure 5: Imperviousness density model.
4 CONCLUSIONS
This paper describes a new approach to
imperviousness density mapping using the GIS-
MCDA method, based on four predisposing criteria.
Depending on the quality of the input data, other
criteria can also be considered, such as the drainage
system or a more detailed LULC model. The existing
Copernicus imperviousness density model is well
suited for less detailed hydrological-hydraulic
analyses. For more detailed analyses, it is necessary
to create an imperviousness density model with
higher spatial resolution. However, a more detailed
Imperviousness Density Mapping Based on GIS-MCDA and High-Resolution Worldview-2 Imagery
227

model requires a longer processing time, so a perfect
balance should be found considering the purpose of
the final model. The created model of imperviousness
density in Zadar with a spatial resolution of 0.5 m is
certainly the most detailed model of imperviousness
of this area, which will serve as one of the spatial
input data for hydrological-hydraulic 2D modeling in
further studies. The same method will also be applied
to create an imperviousness density model from data
collected by a UAV multispectral camera with 10
bands and an aero-LiDAR system (ALS).
ACKNOWLEDGEMENTS
This research was produced as part of the Interreg
STREAM (Strategic development of flood
management) project, funded by the Italy-Croatia
cross-border cooperation program 2014-2020 and the
project UIP-2017-05-2694 financially supported by
the Croatian Science Foundation.
REFERENCES
Aasen, H., Honkavaara, E., Lucieer, A., & Zarco-Tejada, P.
J. (2018). Quantitative remote sensing at ultra-high
resolution with UAV spectroscopy: a review of sensor
technology, measurement procedures, and data
correction workflows. Remote Sensing, 10(7), 1091.
Aguilar, M. A., Bianconi, F., Aguilar, F. J., & Fernández, I.
(2014). Object-based greenhouse classification from
GeoEye-1 and WorldView-2 stereo imagery. Remote
sensing, 6(5), 3554-3582.
Aguilar, M. Á., del Mar Saldaña, M., & Aguilar, F. J.
(2013a). Generation and quality assessment of stereo-
extracted DSM from GeoEye-1 and WorldView-2
imagery. IEEE Transactions on Geoscience and
Remote Sensing, 52(2), 1259-1271.
Aguilar, M. A., del Mar Saldana, M., & Aguilar, F. J.
(2013b). Assessing geometric accuracy of the
orthorectification process from GeoEye-1 and
WorldView-2 panchromatic images. International
Journal of Applied Earth Observation and
Geoinformation, 21, 427-435.
Ansari, T. A., Katpatal, Y. B., & Vasudeo, A. D. (2016).
Spatial evaluation of impacts of increase in impervious
surface area on SCS-CN and runoff in Nagpur urban
watersheds, India. Arabian Journal of Geosciences,
9(18), 1-15.
Arabameri, A., Blaschke, T., Pradhan, B., Pourghasemi, H.
R., Tiefenbacher, J. P., & Bui, D. T. (2020). Evaluation
of recent advanced soft computing techniques for gully
erosion susceptibility mapping: A comparative study.
Sensors, 20(2), 335.
Belfiore, O. R., & Parente, C. (2016). Comparison of
different algorithms to orthorectify WorldView-2
satellite imagery. Algorithms, 9(4), 67.
Belfiore, O. R., Meneghini, C., Parente, C., & Santamaria,
R. (2016). Application of different Pan-sharpening
methods on WorldView-3 images. ARPN J. Eng. Appl.
Sci, 11(7).
Brun, S. E., & Band, L. E. (2000). Simulating runoff
behavior in an urbanizing watershed. Computers,
environment and urban systems, 24(1), 5-22.
Campbell, J. B., & Wynne, R. H. (2011). Introduction to
remote sensing. Guilford Press.
Cheng, P., & Chaapel, C. (2010). Pan-sharpening and
geometric correction: worldview-2 satellite.
GeoInformatics, 13(4), 30.
Comaniciu, D., & Meer, P. (2002). Mean shift: A robust
approach toward feature space analysis. IEEE
Transactions on pattern analysis and machine
intelligence, 24(5), 603-619.
DHMZ - Državni hidrometeorološki zavod (2017).
Available from: https://meteo.hr/objave_najave_nat
jecaji.php?section=onn¶m=objave&el=priopcenj
a&daj=pr12092017 (Accessed on 17 November 2022).
DigitalGlobe, Inc. (2010a): The Benefits of the 8 Spectral
Bands of WorldView-2, https://docslib.org/doc/
5291751/the-benefits-of-the-eight-spectral-bands-of-
worldview-2 (Accessed on 19 November 2022).
DigitalGlobe, Inc. (2010b): DigitalGlobe Core Imagery
Products Guide, https://lps16.esa.int/posterfiles/paper1
213/%5bRD12%5d_digitalglobe-core-imagery-produc
ts -guide.pdf (Accessed on 20 November 2022).
DigitalGlobe, Inc. (2010c) - WorldView-2 Imagery Basics
and Erdas Imagine, https://fdocuments.net/document
/worldview2-basics-and-erdas-imagine.html?page=1
(Accessed on 22 November 2022).
Duan, C., Zhang, J., Chen, Y., Lang, Q., Zhang, Y., Wu, C.,
& Zhang, Z. (2022). Comprehensive Risk Assessment
of Urban Waterlogging Disaster Based on MCDA-GIS
Integration: The Case Study of Changchun, China.
Remote Sensing, 14(13), 3101.
ESRI (2023). Fuzzy Membership (Spatial Analyst)—
ArcMap| Documentation
(n.d.). Available from:
https://desktop.arcgis.com/en/arcmap/latest/tools/spati
al-analyst-toolbox/fuzzy-membership.htm (Accessed
on 24 February 2023).
Feng, S., & Fan, F. (2019). A hierarchical extraction
method of impervious surface based on NDVI
thresholding integrated with multispectral and high-
resolution remote sensing imageries. Ieee Journal of
Selected Topics in Applied Earth Observations and
Remote Sensing, 12(5), 1461-1470.
Fu, Y., Liu, K., Shen, Z., Deng, J., Gan, M., ... & Wang, K.
(2019). Mapping impervious surfaces in town–rural
transition belts using China’s GF-2 imagery and object-
based deep CNNs. Remote Sensing, 11(3), 280.
Gallant, J. C., & Wilson, J. P. (2000). Terrain analysis:
principles and applications (Vol. 538). New York: John
Wiley & Sons.
Goldbergs, G., Maier, S. W., Levick, S. R., & Edwards, A.
(2019). Limitations of high resolution satellite stereo
imagery for estimating canopy height in Australian
tropical savannas. International Journal of Applied
Earth Observation and Geoinformation, 75, 83-95.
Graovac, V. (2004). Populacijski razvoj Zadra. Geoadria,
9(1), 51-72.
GISTAM 2023 - 9th International Conference on Geographical Information Systems Theory, Applications and Management
228

Hallegatte, S., Green, C., Nicholls, R. J., & Corfee-Morlot,
J. (2013). Future flood losses in major coastal cities.
Nature climate change, 3(9), 802-806.
Herold, M., Roberts, D. A., Gardner, M. E., & Dennison, P.
E. (2004). Spectrometry for urban area remote
sensing—Development and analysis of a spectral
library from 350 to 2400 nm. Remote sensing of
environment, 91(3-4), 304-319.
Hong, Y., & Adler, R. F. (2008). Estimation of global SCS
curve numbers using satellite remote sensing and
geospatial data. International Journal of Remote
Sensing, 29(2), 471-477.
Horn, B. K. (1981). Hill shading and the reflectance map.
Proceedings of the IEEE, 69(1), 14-47.
Lin, C., Wu, C. C., Tsogt, K., Ouyang, Y. C., & Chang, C. I.
(2015). Effects of atmospheric correction and
pansharpening on LULC classification accuracy using
WorldView-2 imagery. Information Processing in
Agriculture, 2(1), 25-36.
Liu, C., Shao, Z., Chen, M., & Luo, H. (2013). MNDISI: A
multi-source composition index for impervious surface
area estimation at the individual city scale. Remote
sensing letters, 4(8), 803-812.
Magaš, D. (1991). Neke promeje u gradskim naseljima
zadarske regije u razdoblju 1857.-1971. godine. Radovi
Zavoda za povijesne znanosti HAZU u Zadru, (33), 239-
258.
Maglione, P., Parente, C., & Vallario, A. (2014). Coastline
extraction using high-resolution WorldView-2 satellite
imagery. European Journal of Remote Sensing, 47(1),
685-699.
Maxar (2020): Worldview-2. Datasheet. (Accessed on 19
November 2022).
Moody, D. I., Brumby, S. P., Rowland, J. C., Altmann, G. L.,
& Larson, A. E. (2014, October). Change detection and
classification of land cover in multispectral satellite
imagery using clustering of sparse approximations
(CoSA) over learned feature dictionaries. In 2014 IEEE
Applied Imagery Pattern Recognition Workshop (AIPR)
(pp. 1-10). IEEE.
Morgan, R. P. C. (2009). Soil erosion and conservation. John
Wiley & Sons.
Mugiraneza, T., Nascetti, A., & Ban, Y. (2019). WorldView-
2 data for hierarchical object-based urban land cover
classification in Kigali: integrating rule-based approach
with urban density and greenness indices. Remote
Sensing, 11(18), 2128.
Okujeni, A., Canters, F., Cooper, S. D., Degerickx, J.,
Heiden, U., Hostert, P., ... & van der Linden, S. (2018).
Generalizing machine learning regression models using
multi-site spectral libraries for mapping vegetation-
impervious-soil fractions across multiple cities. Remote
sensing of environment, 216, 482-496.
Raduła, M. W., Szymura, T. H., & Szymura, M. (2018).
Topographic wetness index explains soil moisture better
than bioindication with Ellenberg’s indicator values.
Ecological Indicators, 85, 172-179.
Rajput, U. K., Ghosh, S. K., & Kumar, A. (2016). Multi-
sensor satellite pan-sharpening based on IHS and
Window Pseudo Wigner distribution integrated
approach: Application to WorldView-2 imagery. Intern-
ational Journal of Image and Data Fusion,7(2),119-147.
Różycka, M., Migoń, P., & Michniewicz, A. (2017).
Topographic Wetness Index and Terrain Ruggedness
Index in geomorphic characterisation of landslide
terrains, on examples from the Sudetes, SW Poland.
Zeitschrift für geomorphologie, Supplementary issues,
61(2), 61-80.
Šiljeg, A. (2013). Digitalni model reljefa u analizi
geomorfometrijskih parametara–primjer PP Vransko
jezero (Doctoral dissertation, Doktorski rad, PMF,
Sveucilište u Zagrebu).
Su, S., Tian, J., Dong, X., Tian, Q., Wang, N., & Xi, Y.
(2022). An impervious surface spectral index on
multispectral imagery using visible and Near-Infrared
bands. Remote Sensing, 14(14), 3391.
Su, S., Tian, J., Dong, X., Tian, Q., Wang, N., & Xi, Y.
(2022). An impervious surface spectral index on
multispectral imagery using visible and Near-Infrared
bands. Remote Sensing, 14(14), 3391.
Sun, G., Chen, X., Jia, X., Yao, Y., & Wang, Z. (2015).
Combinational build-up index (CBI) for effective
impervious surface mapping in urban areas. IEEE
Journal of selected topics in applied earth observations
and remote sensing, 9(5), 2081-2092.
URL1: Imperviousness density 2018. https://land.coper
nicus.eu/pan-european/high-resolution-layers/impervio
usness/status-maps/imperviousness-density-2018?tab=
metadata (Accessed on 17 November 2022).
URL2: https://catalyst.earth/catalyst-system-files/help/CO
MMON/concepts/DEM_buildfromstereo.html
(Accessed on 3 December 2022).
URL3:https://studylib.net/doc/7954755/worldview--2-band
-combinations---c-agg (Accessed on 20 December2022).
USDA (2017): Part 630 Hydrology: National Engineering
Handbook, Chapter 9: Hydrological Soil-Cover
Complexes.
Weng, Q. (2012). Remote sensing of impervious surfaces in
the urban areas: Requirements, methods, and trends.
Remote Sensing of Environment, 117, 34-49.
Woodruff, J. D., Irish, J. L., & Camargo, S. J. (2013).
Coastal flooding by tropical cyclones and sea-level rise.
Nature, 504(7478), 44-52.
Wu, Q., Zhong, R., Zhao, W., Fu, H., & Song, K. (2017). A
comparison of pixel-based decision tree and object-
based Support Vector Machine methods for land-cover
classification based on aerial images and airborne lidar
data. International Journal of Remote Sensing, 38(23),
7176-7195.
Xu, J., Zhao, Y., Zhong, K., Ruan, H., & Liu, X. (2016).
Coupling modified linear spectral mixture analysis and
soil conservation service curve number models to
simulate surface runoff: application to the main urban
area of Guangzhou, China. Water, 8(12), 550.
Yang, J., & He, Y. (2017). Automated mapping of
impervious surfaces in urban and suburban areas:
Linear spectral unmixing of high spatial resolution
imagery. International Journal of Applied Earth
Observation and Geoinformation, 54, 53-64.
Zhang, L., Zhang, M., & Yao, Y. (2018). Mapping seasonal
impervious surface dynamics in Wuhan urban
agglomeration, China from 2000 to 2016. International
journal of applied earth observation and
geoinformation, 70, 51-61.
Imperviousness Density Mapping Based on GIS-MCDA and High-Resolution Worldview-2 Imagery
229
