
Digital Image Processing in the Diagnosis of Cracks in Steel Sheet
Taynara Martins Gonc¸alves
1 a
, Andrea G. Campos Bianchi
1 b
and Glauco F. Gazel Yared
2 c
1
Department of Computing, Federal University of Ouro Preto, Brazil
2
Department of Electrical Engineering at the Federal University of Ouro Preto, Brazil
Keywords:
Contour Segmentation, Automatic Detection, Computer Vision, Rail Inspection.
Abstract:
The railway is an essential part of the marketing chain. If it is considered efficient, safe, and competitive,
on the other hand, the railways suffer from the enormous difficulty of maintenance due not only to their
great extension, dispersion and lack of financial investments. Initiatives for automatic maintenance inspection,
mostly done manually, require development and consolidation. Therefore, this work presents a method for
identifying defects in sleepers based on analyzing images. We will use digital image processing techniques
that will allow us to extract the contours of the sleepers and therefore analyze their curvature. The development
is carried out with images from laboratory tests, not previously classified but subject to noise. The method is
validated through analysis with an image bank with about 20 images of defective and flawless sleepers, with
an average assertiveness of 94.24%. The detection, classification, and localization of faults in train tracks are
then investigated and discussed.
1 INTRODUCTION
The expansion of the use of the railway system, to-
gether with the speed, frequency, and weight per axle
adopted, directly affects the structure of the railway
lines, including rails, sleepers, and other components.
In this context, the sleepers play an essential role in
the stability of the rails, as they are responsible for
transferring the efforts produced by the loads to the
ballast and guaranteeing the gauge of the line (dis-
tance between the rails). (Magalh
˜
aes, 2007)
However, structural problems arising from use,
which begin with the appearance of cracks, can
progress to the complete breakage of the sleeper. This
rupture causes an overload on the adjacent sleepers,
accelerating the process of structural degradation and
consequently contributing to the appearance of new
cracks. This process can be repeated in such a way
as to result in a sequence of broken sleepers, causing
an increase in the track gauge and compromising the
safety of a specific section of the railway line, which
can become a considerable risk for the occurrence of
derailment, mainly on curves.
In addition, the position of the sleeper in a “U”
shape on the rails, as seen in Figure 1, ends up in-
a
https://orcid.org/0000-0002-5862-6271
b
https://orcid.org/0000-0001-7949-1188
c
https://orcid.org/0000-0002-5586-2543
creasing the possibility of corrosion of the sleepers
and further increases the cost of maintenance of the
railways. (Magalh
˜
aes, 2007)
Figure 1: Shape of the steel sleeper on the train track
(DNITT, 2003).
Therefore, rail wear and tear can generate finan-
cial losses and cause risks that directly affect the
safety of train operators. Thus, preventive and correc-
tive maintenance practices are essential to ensure the
reliability of the railroad. However, railway mainte-
nance has a high cost because it depends on qualified
labor and an extensive and varied table of procedures
to ensure safer and more efficient conditions for the
operation. (Machado et al., 2009).
Therefore an automated system would be more re-
liable, safe, and consistent, increasing the efficiency
of railway maintenance and reducing track inspection
time. It would also minimize railway workers’ risks
Gonçalves, T., Bianchi, A. and Yared, G.
Digital Image Processing in the Diagnosis of Cracks in Steel Sheet.
DOI: 10.5220/0011989800003467
In Proceedings of the 25th International Conference on Enterprise Information Systems (ICEIS 2023) - Volume 1, pages 623-629
ISBN: 978-989-758-648-4; ISSN: 2184-4992
Copyright
c
2023 by SCITEPRESS – Science and Technology Publications, Lda. Under CC license (CC BY-NC-ND 4.0)
623

when they are in a dangerous environment. (Malik,
2013)
For example, during maintenance, some sleepers
are replaced depending on the time of use and oth-
ers by the location of cracks, done manually by visual
inspection. Thus, it is important to carry out this ap-
plied research, which aims to produce knowledge and
generate technology to systematize, streamline and
automate (when applicable) the process of diagnos-
ing structural problems in steel sleepers. Contributing
significantly to the reduction of operating costs, and
losses arising from accidents, in addition to creating
new business opportunities for the company, consid-
ering that other railroads also have the same needs.
Therefore, this project aims to develop applied re-
search to diagnose structural problems in steel sleep-
ers and identify them between flawless and defective
sleepers. The work will be developed using digital
image processing techniques and pattern recognition
that enable the extraction of information about the ge-
ometry of the sleeper, more specifically the curvature
of the sleeper edge. A system for diagnosing struc-
tural problems in steel sleepers will be implemented
based on the surface geometry of the collected data,
which will be divided into upper and lower geometry
to compare the model’s effectiveness.
2 LITERATURE REVIEW
The railways emerged during the second Industrial
Revolution (17th and 19th centuries), with the need
to keep up with the progress of the time, bringing
even more economic and social opportunities. In this
context, the railway matrix makes up an important
modal within the transport sector of the world econ-
omy, providing accessibility and mobility for trans-
porting cargo and people. It is important to note that
in addition to logistics, railroads gained prominence
due to some characteristics, among them: capacity of
freight trains, low cost of freight over long distances,
lack of delays due to traffic jams, lower incidence of
thefts and accidents, low-cost energy and great sus-
tainability, since it has low CO2 emissions in the at-
mosphere.
Therefore, in the world’s major economies, rail-
ways represent the basic means of high-density infras-
tructure and highly connected networks in the trans-
port system. For example, according to data obtained
from (ANTT, 2021), railroads represent the main way
of transportation for Russia (81%), Canada (46%),
Australia and the US (43%), and China (37%). That
is, countries with a developed economy have rail lo-
gistics that are very participatory within the transport
sector; this causes mobility to advance the connection
between the main cities in the country and facilitate
the flow of goods.
Given the importance of railroads for the global
economic sector, the improvement of their manage-
ment has been the subject of several studies to auto-
mate and facilitate inspections of railroad components
since it is still a very human-dependent process, mak-
ing it exhaustive and slow. (Rubinsztejn, 2011), for
example, proposed an automatic system based on the
Viola-Jones algorithm for the automatic detection of
the presence or absence of parts of interest on railroad
tracks using real images acquired by a digital camera
installed under a train.
Other innovative works in the area can be cited,
(Rong et al., 2016) use a camera that captures im-
ages of the rails and a vibration sensor and present
a system to detect irregularities on the track and the
wagon wheels through computer vision and analy-
sis of the rail vibration signal (SVD). (Yokoyama
and Matsumoto, 2017) uses an algorithm based on
Adaboost for crack detection in images of concrete
sleepers. It is trained using crack and non-crack char-
acteristics.
(Srinivasan, 2020) uses visual perception and im-
age processing techniques for railway inspection and
anomaly detection. All work is developed in Lab-
View and the images used are extracted through a
webcam, which runs along the entire length of the
railway. Here, edge detection and image convolution,
performed by changing pixels, are sufficient to detect
loose or bent screws and cracks on the sleeper sur-
face. (Franca and Vassallo, 2021) present a method to
inventory and identify the types and defects of sleep-
ers through real images obtained on railways and sub-
ject to various noises. For this, it uses image pro-
cessing, heuristics, and feature fusion, all in an un-
supervised way and through Matlab. Haar transform,
integral imaging, edge detection, entropy calculation,
and topology aspects are applied. Furthermore, (Pas-
sos et al., 2022) use convolutional neural networks
(CNN) to automatically detect defects on the rail sur-
face. In this work, a comparison is made between 10
(ten) CNN models in order to find the one that per-
forms better results and accuracy.
The works presented so far have become similar
in that they use image processing techniques to assess
and inspect the conditions of the railways. But un-
like what has been exposed so far, the sleeper’s object
of analysis in this work will be analyzed not by their
surface, but by their curvature. The next topic will de-
scribe in detail the methods used to create a practical
and efficient framework for automatic rail inspection.
ICEIS 2023 - 25th International Conference on Enterprise Information Systems
624
3 METHODOLOGY
Image analysis and its representation play an impor-
tant role in applications related to computer vision
and the construction of visual inspection systems.
This process is characterized as an area where sys-
tems are built to identify, classify, and interpret ob-
jects in a scene. Thus, as it is an iterative software,
which includes a programming language for techni-
cal and scientific computing and toolboxes, allowing
problem-solving with high versatility (Demuth and
Beale, 2001), Matlab was the software chosen as the
platform for the development of this research.
The flowchart that represents the methodology of
the information control systems used in this work has
5 (five) main phases and is adapted in the sequen-
tial pattern of (Gonzalez, 2015), which is divided
into: digital image acquisition, digital image pro-
cessing(PDI), and digital image analysis (ADI). The
flowchart represented in Figure 2 describes the steps
of this work, starting from the representation in pixels
and advancing toward the regions and data.
Figure 2: Flowchart of the methodology steps.
3.1 Image Acquisition
Building a database with real images of defective and
non-defective sleepers is challenging, as it depends on
numerous factors related to companies and the protec-
tion of their data and information. Thus, our proof of
concept uses images of sleepers obtained in the labo-
ratory for further testing in the field.
The image acquisition process was carried out
through laboratory experiments. All sleepers are
placed exactly in the same place and at the same dis-
tance so that the only variant in the image collection
is the sleeper itself. Thus, the position of the camera
allows for obtaining an image of the sleeper from the
front and above, where it is possible to view the en-
tire edge of the sleeper. Therefore, the database com-
prises a total of 20 (twenty) images, 10 (ten) images
of sleepers with apparent defects, and 10 (ten) images
of sleepers without defects. Figure 3 illustrates one of
the database images.
Therefore, as the images obtained have a lot of
noise, pre-processing becomes essential for a cleaner
image. That is, the manipulations were performed
properly to eliminate useless information or impair
the analysis. We also use techniques to improve
Figure 3: Database image example, faulty sleeper.
lighting, define the region of interest, and extract at-
tributes.
3.2 Segmentation
In this context, specifically, image analysis involves
processes based on regions, thus requiring segmenta-
tion and processes based on transforming the image
into the domain of spatial frequencies. Both allow the
extraction of attributes used for pattern recognition,
whether geometric or related to the power spectrum.
Here, segmentation was used with the delimitation of
the object (sleeper) in the region of interest (ROI) to
define a contour of the two-dimensional geometry of
the edge, the main object of the study.
The main segmentation approaches may involve
linear methods, which act uniformly throughout the
image and are fast and simple but cause loss of in-
formation and image details, as occurs with thresh-
olding methods. Non-linear methods require more
complex implementations to preserve more informa-
tion about image details. The main interpretations in-
volving non-linear segmentation cases are the varia-
tional approach. A technique where an energy func-
tional is defined (cost function) and whose solution
is found when this functional is minimized. Nonlin-
ear partial differential equations are used to represent
the contour, and the contour evolution is expressed as
some function of invariant properties of the image. In
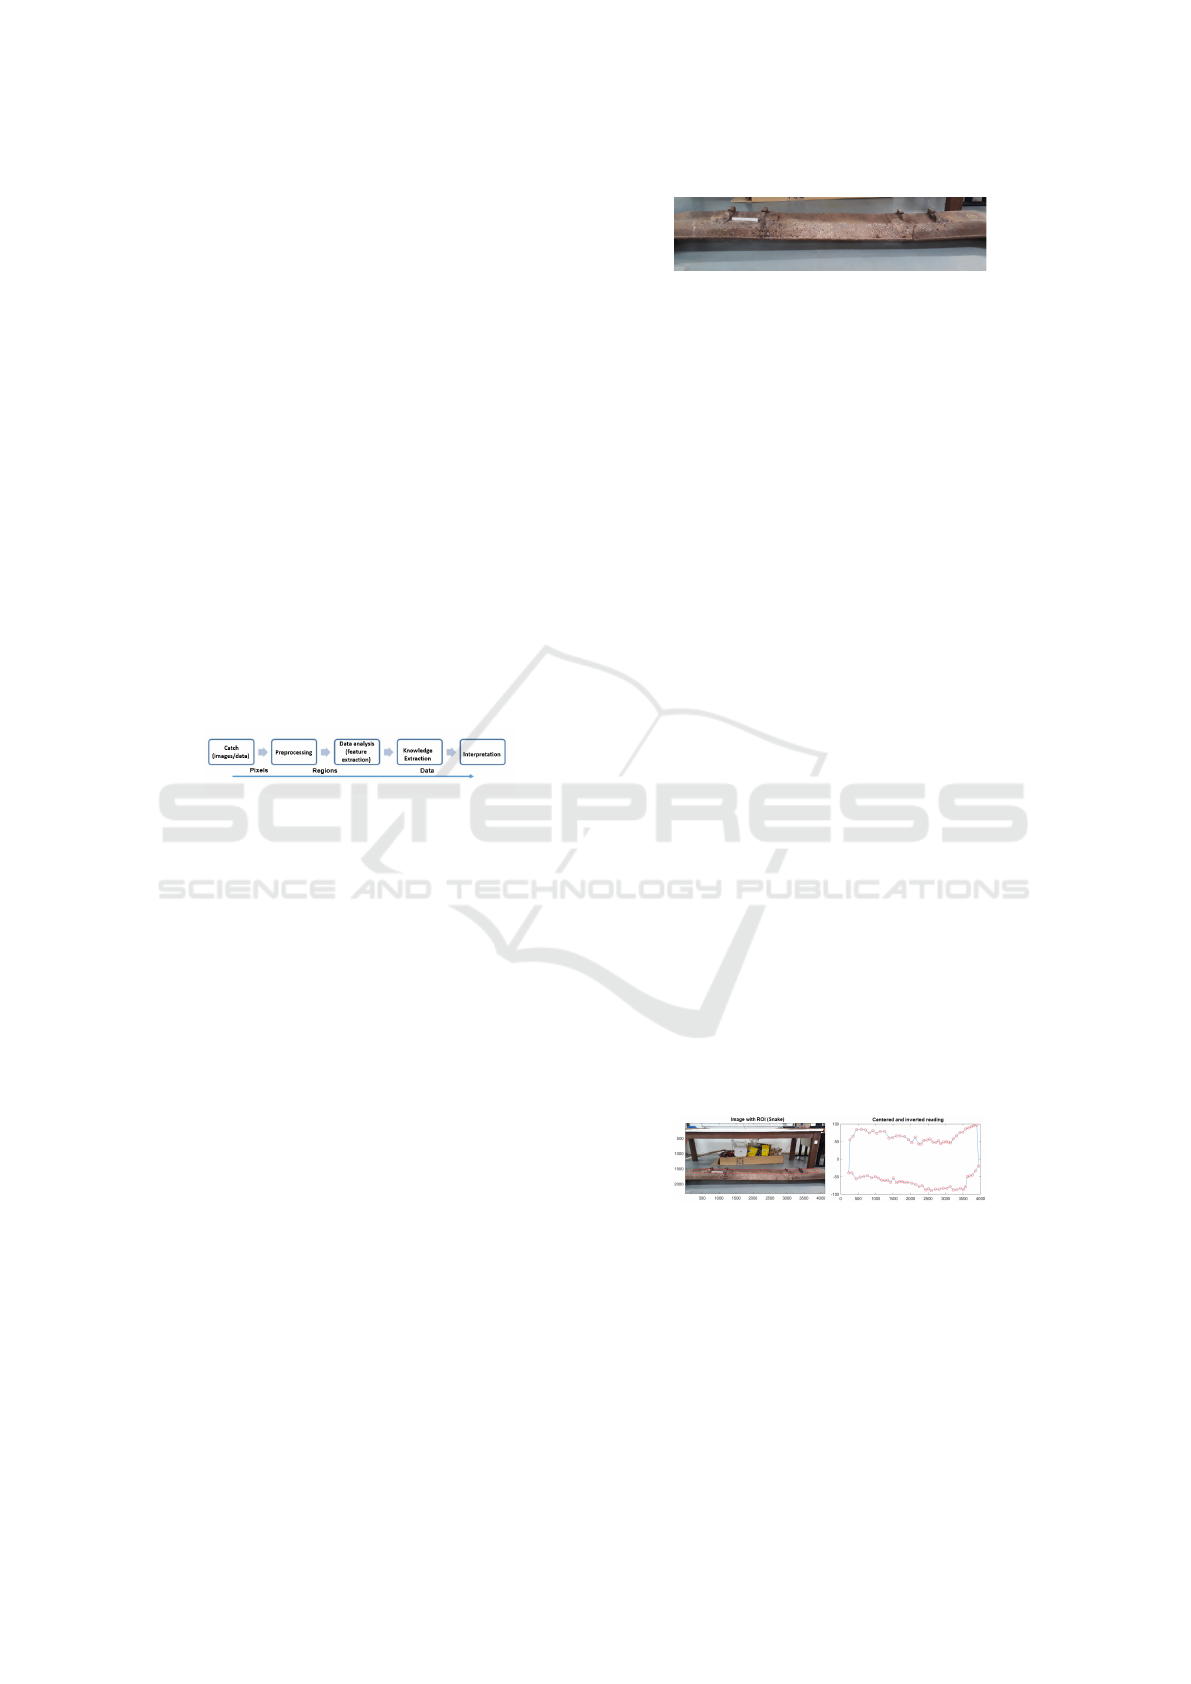
Figure 4 we see the segmented sleeper and the (x, y)
points representing the sleeper segmentation. X de-
termines the column’s position, and y is the line’s po-
sition in the image where the contour is located.
Figure 4: Segmented sleeper and referent chart.
The functional energy minimization problem is
characterized by being ill-conditioned, where differ-
ent solutions can lead to the same minimized func-
tion; i.e. the solution is not unique. There are several
techniques for the solution of the functional. How-
ever, it strongly depends on the type of parameter used
in its definition. In this context, we will investigate
the segmentation using snakes: active contour. This
Digital Image Processing in the Diagnosis of Cracks in Steel Sheet
625

technique allows us to segment the image from en-
ergy functionals defined by the image. From an initial
curve in the image, it is deformed towards the edge
region. This curve deformation is then accomplished
by minimizing the total functional energy. Therefore,
as it is an effective method for detecting edges of im-
ages with little contrast, presence of noise, and tex-
ture, this technique was used to delimit the edge and
consequently obtain the extraction of points from the
desired contour. (Kass et al., 1988)
3.3 Data Analysis
Thus, once the sleeper edge is detected using snakes,
the delimited edge is transformed into a set of points
x and y, allowing a detailed analysis of the curvature
that forms the sleeper edge.
These data will be pre-processed through point in-
terpolation. Interpolation is a technique used to es-
timate values of functions at intermediate points of
intervals; this determination is made from functions
calculated at the extremes of these intervals. (Knott,
2000).
This technique is necessary so that all points
have the same distance along the axis and conse-
quently form an edge curvature. Even so, the tech-
nique known as spline was chosen for the curve to
be interpolated as smoothly as possible. Consid-
ered an approximation technique, spline interpolation
consists of dividing the interval of interest into sev-
eral subintervals and interpolating these subintervals
with low-degree polynomials, causing the curve to be
smoothed.(Knott, 2000)
Thus, for better analysis and representation of in-
formation about the outline of the sleepers, we sepa-
rated the points that form the outline into upper and
lower parts. We can see this in figure 5.
Figure 5: Upper and lower contour sleeper points.
After defining the contour points, we calculate
each curve’s curvature (κ) using Fourier Transform
properties proposed by (Estrozi et al., 2003). It is
well accepted that curvature provides an essential rep-
resentation of salient shape points and is invariant
to rigid-body transformations (Estrozi et al., 2003).
Once the one-dimensional signal y was obtained, a
numerical curvature κ was calculated through Equa-
tion 1.
κ =
|y
00
|
p
(1 + y
02
)
3
(1)
where y
0
is the first and y
00
the second derivatives of
one-dimensional signal. After all this process, the
curvature is stored in a matrix to classify the sleeper
as defective or flawless.
The developed algorithm uses the second fre-
quency component of the Fourier transform. Thus, for
this second frequency component, there is a tendency
for the spectrum of the curve extracted from damaged
sleepers to assume higher values when compared to
flawless sleepers. This frequency limit is then defined
from the mean of the flawless sleeper data chosen for
training, which tended to assume the Gaussian param-
eters.
Therefore, the established threshold will define an
expected pattern in which, above the threshold, it will
consider a defective sleeper and below the threshold a
flawless sleeper and will save this performance. This
whole process will be repeated 110 times, and at the
end, we will have a ranking result based on the av-
erage of this performance. The methodology used to
develop the classification system was to test different
combinations between feature extractions, classifiers,
and classifier parameters to find the attribute sequence
that achieves the best performance for the situation.
3.4 Data Classification
To classify the curvature and to separate the defective
sleepers from the healthy ones, the 2nd component
of the Fourier derivative will be used. This approach
was chosen because, in addition to Fourier adequately
analyzing non-periodic functions, there is greater ap-
plicability to problems related to signal processing.
(Junior and Costa, 1996) That is, in the Fourier Trans-
form, the global or semi-local frequency information
is captured along an entire signal or in processing
windows, not oscillating in short intervals.
Thus, according to (Silva et al., 2022) the geome-
try of the sleepers associated with the spatial signs of
the permanent way, have information that helps us to
characterize the railway superstructure. In this sense,
the discrete Fourier transform (DFT), which is a func-
tion composed of samples that can have pixel values
altered along a row or column, is one of the tools that
will help us in digital image processing. It is used
because it is a mathematical technique based on the
decomposition of signals into sinusoids, these sinu-
soids enter a linear system and come out as sinusoids
that can change amplitude and phase, maintaining the
original frequency, thus knowing if the sleeper has a
ICEIS 2023 - 25th International Conference on Enterprise Information Systems
626
fracture or not, let’s visualize the change in amplitude
of this sinusoid.
Thus, Fourier’s second-order derivative method
can be applied to estimate the curvature along the en-
tire isopotential, curves defined by a surface (x and
y), taking the contour of the original shape as one of
its curve levels. In addition, it provides more excel-
lent curvature enhancement, which would contribute
to the greater accuracy of our analysis. (Estrozi et al.,
2003) and (Junior and Costa, 1996)
Finally, after applying the second derivative, a fre-
quency threshold will be established to define a clas-
sification region in the image. From this limit, all
frequency components that are below this limit, re-
flecting the amplitude of the curve, will be classified
as defective sleepers and above as healthy sleepers.
Given the difficulty of establishing a threshold, an au-
tomatic global thresholding method was proposed to
efficiently establish a threshold and minimize the er-
ror rate. (Gonzalez, 2015)
3.5 Performance Evaluation
Considering the proposed method for defect detec-
tion, its evaluation is based on three known pattern
recognition metrics: Precision, Recall, and F1 Score.
These metrics measure how well the method’s detec-
tion is performed. Precision and recall are metrics
useful for measuring relevance since they show the
amount of data obtained that are relevant (precision),
and the amount of relevant data obtained (recall). The
Equations 2 and 3 describe precision and recall, re-
spectively
Precision =
T P
T P + FP
(2)
Recall =
T P
T P + FN
(3)
where TP is the true positive rate, corresponding to
defect sleepers that were correctly detected, FP, the
false positive rate, a defect sleeper that was detected
incorrectly, and FN, the false negative rate, indicating
no detection when it does.
Using precision and recall, we can calculate the
F1 Score, which represents the balance between the
two metrics, and can be described by Equation 4.
F1 = 2 ∗
Precision ∗ Recall
Precision + Recall
(4)
4 RESULTS
From obtaining the curvature points with the snake,
these are divided between the upper points of the
sleeper and the lower points, but to define equal and
consistent regions along the contour, we calculate a
midpoint of the sleeper in such a way that values
greater than the midpoint are treated as the top and
lower values as the bottom of the tie.
In the next step, after separating the points, the
data obtained from the sleeper geometry are inter-
polated with the spline function, using a distance of
1 cm. In this case, the interpolation aims to make
evaluating the upper and lower curvatures efficient
and equal. This is because the edge points that form
the curvature of the sleeper that will be analyzed
later, when extracted, are not obtained equally spaced.
Therefore, the interpolation will calculate the internal
points not given, allowing the (approximate) reconsti-
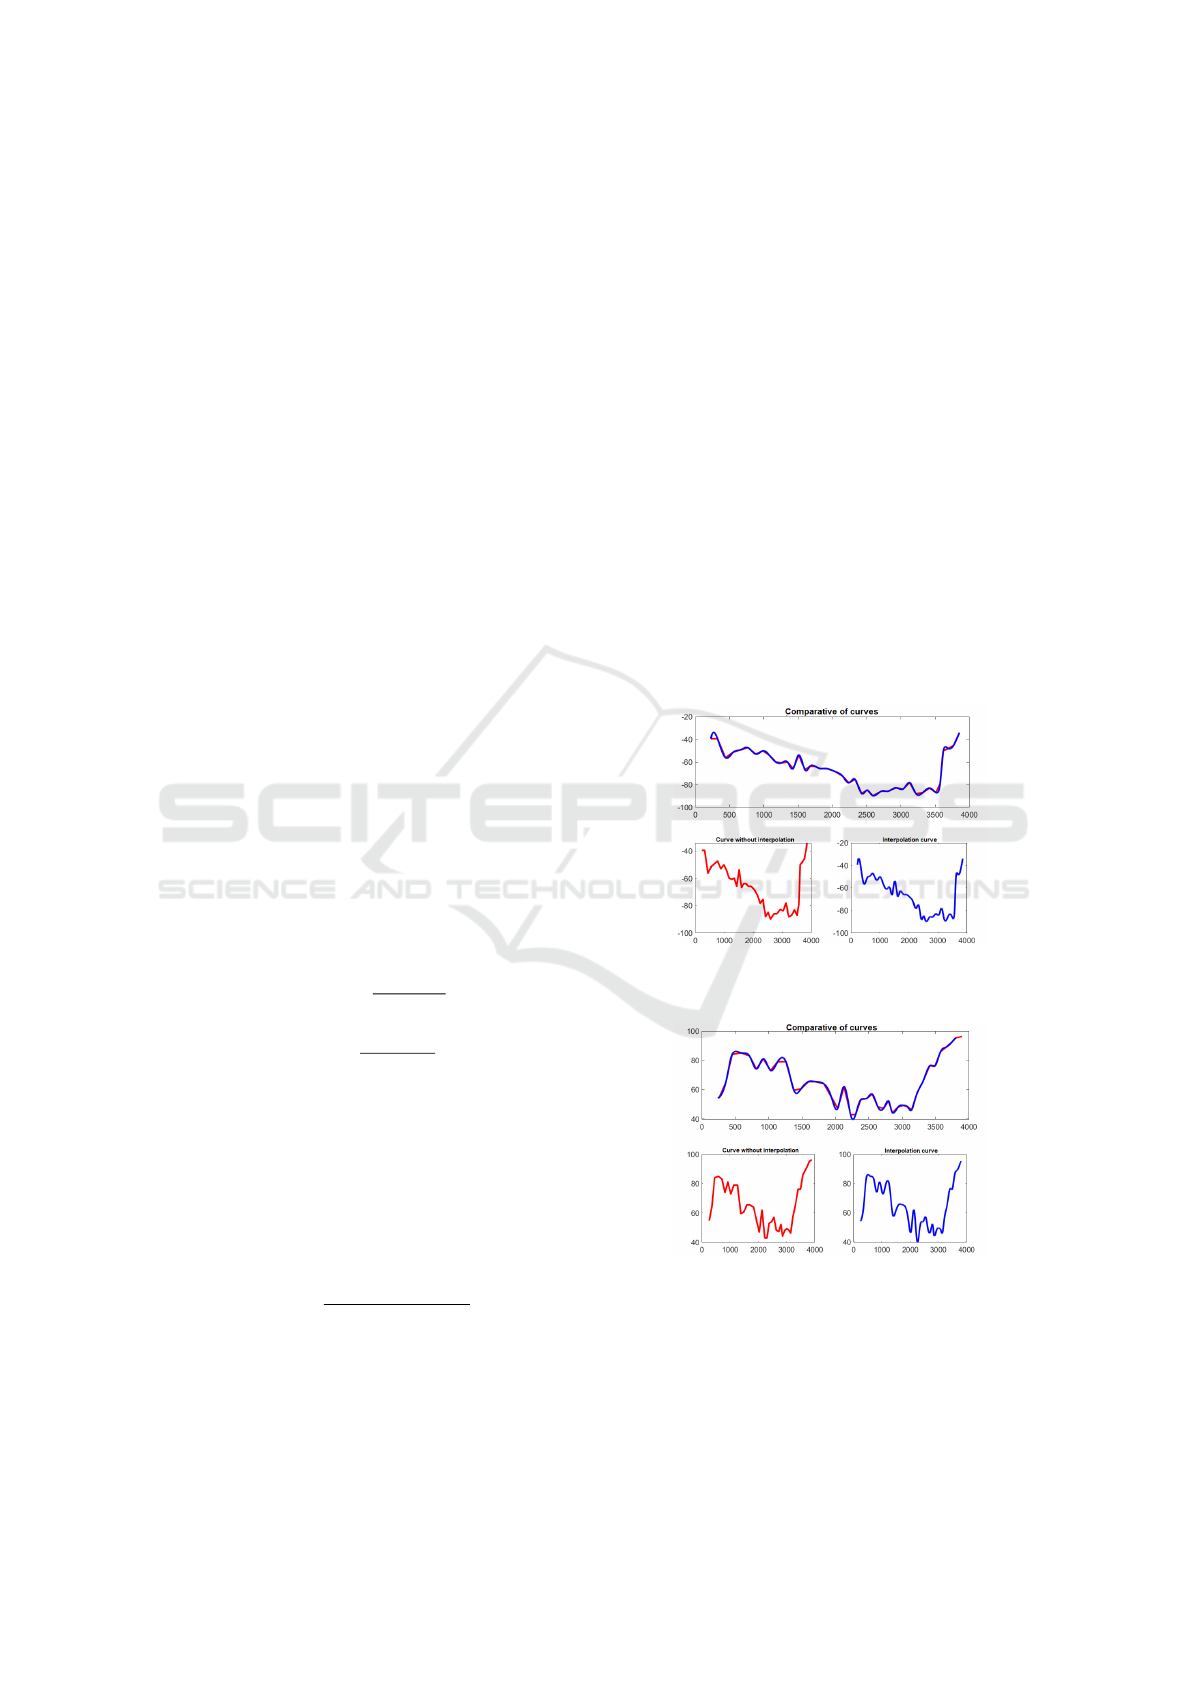
tution of an occupation. In Figures 6 and 8, we can
see the curve before and after interpolating the points.
Figure 6: Lower curve before and after interpolation.
Figure 7: Upper curve before and after interpolation.
The treatment of all these data is part of the re-
sult that will allow us to save these points in a ma-
trix that will be applied to the curvature for its clas-
sification. Thus, in the algorithm developed for this
work, based on the calculation of the Fourier trans-
form on the curve obtained from each sleeper, the
Digital Image Processing in the Diagnosis of Cracks in Steel Sheet
627

data, but specifically, the curvature of the sleepers, are
randomly separated, that is, 70% of these curvatures
are separated for training the model and the other 30%
for validation/testing.
In this way, this separation of training and test data
is done 110 times, and each time the code is executed,
the result is saved and the final result is an average
performance of these 110 draws. We emphasize that
making this result repeated 110 times was the way
we found so that our result is not biased in a specific
database, increasing the reliability of the model, con-
sidering that the final result is based on an average
of these 110 times the algorithm runs differently. In
addition, the limit automatically defined by our model
was an adjustment based on training data from healthy
sleepers as mean plus standard deviation, assuming
that the data distribution of the chosen parameter is
Gaussian.
Figure 8: DFT of sleeper surface geometry.
In the graph shown in 8 we have the coincidence
of the Fourier transform in the turned curve of each
sleeper. Thus, we can observe, for visual and qualita-
tive purposes, that for this second frequency compo-
nent, there is a tendency for the curve spectrum ex-
tracted from damaged sleepers to assume higher val-
ues when compared to the frequency spectrum recov-
ered from healthy sleepers.
In 1 we have the final performance result of our
model. Therefore, we have the overall average hit
rate, the general value of the classification of sleep-
ers. We have the average index in the location of de-
fective sleepers and we have the false positives, which
represent healthy sleepers that are being classified as
damaged. There is a better performance of the points
extracted from the upper part of the sleeper, with
100% in the location of the sleepers; that is, all de-
fective sleepers were detected, contrary to the points
extracted from the lower part of the sleeper, where
81.82 % of defective sleepers were detected. Also,
the false positives at the top are 11.51% as opposed to
the false positives at the bottom.
Therefore, the average performance of the points
Table 1: Results.
Data Precision Defective False Posit
Upper 94,24% 100% 11,51%
Lower 83,03% 81,82% 15,72%
that form the upper curvature of the sleeper edge
has a better global average classification performance,
94.24%, than the points that form the lower curvature
of the sleeper edge, 83.03%.
5 CONCLUSIONS
This work proposed applying a pattern recognition
modeling for automatic railway defects investigation
using digital image processing. Its main contribution
is analyzing and classifying sleepers and the conse-
quent rail maintenance management. This innovative
process extracts information from the curvature of the
surface of sleepers, aiming to optimize the mainte-
nance of railways, which is fundamental in preventing
accidents and reducing costs.
The classification based on the extraction of the
sleeper surface curvature showed good performance
when we analyzed the upper curvature, the model cor-
rectly classified 94.24% of the validation data, having
found all the defective sleepers, contrary to the clas-
sification carried out with the points below, here the
average hit rate for damaged sleepers was 81.82%.
Thus, the system presents a user-friendly and easy-to-
use interface. However, the validation dataset needs
to be bigger, limiting our study, and it is important to
analyze the architecture’s performance in the face of
a greater challenge.
A larger database is proposed for future work,
varying the training parameters. Furthermore, we
suggest that the extraction of the points that form the
curvature of the sleeper be fully automated. In this
work, this was not possible, as the snakes, the method
used, needed help to demarcate points around the ob-
ject of study. We also suggest comparing different
defect detection techniques; these techniques can be
better exploited if we get a bigger image bank.
ACKNOWLEDGEMENTS
The authors thank CAPES, Fapemig, CNPq, and the
Federal University of Ouro Preto for supporting this
work. Also, the authors would like to thank Vale S/A
for enabling the creation of a dataset with real images.
This study was financed in part by the
Coordenac¸
˜
ao de Aperfeic¸oamento de Pessoal de
ICEIS 2023 - 25th International Conference on Enterprise Information Systems
628

N
´
ıvel Superior - Brazil (CAPES) - Finance Code
001, the Conselho Nacional de Desenvolvimento
Cient
´
ıfico e Tecnol
´
ogico (CNPQ), Vale S.A. and the
Universidade Federal de Ouro Preto (UFOP).
REFERENCES
ANTT, A. N. d. T. T. (2021). Relat
´
orio T
´
ecnico. Minist
´
erio
dos Transportes do Brasil, Brasil.
Demuth, H. B. and Beale, M. H. (2001). Neural Network
Toolbox for Use with MATLAB: Computation, Visual-
ization, Pro-gramming,. Number Version 3.0.
DNITT, D. N. d. I.-E. d. T. (2003). Procedimento de
Inspec¸
˜
ao Material. Minist
´
erio dos Transportes do
Brasil.
Estrozi, L. F., Rios-Filho, L. G., Bianchi, A. G. C., Ce-
sar Jr, R. M., and da Fontoura Costa, L. (2003). 1d
and 2d fourier-based approaches to numeric curvature
estimation and their comparative performance assess-
ment. Digital signal processing, 13(1):172–197.
Franca, A. S. and Vassallo, R. F. (2021). A Method of Clas-
sifying Railway Sleepers and Surface Defects in Real
Environment. IEEE Sensors Journal, 21(10):11301–
11309. Conference Name: IEEE Sensors Journal.
Gonzalez, R. C. e. W. (2015). Digital Image Processing.
Pearson.
Junior, R. M. C. and Costa, L. D. F. (1996). Towards effec-
tive planar shape representation with multiscale digi-
tal curvature analysis based on signal processing tech-
niques. Digital signal processing, 29(9):1559–1569.
Kass, M., Witkin, A., and Terzopoulos, D. (1988). Snakes:
active contour models. Int. Journal of Computer Vi-
sion, 1:321–333.
Knott, G. D. (2000). Interpolating Cubic Splines. Progress
in Computer Science and Applied Logic, Boston.
Machado, A., Andrade, A., and Bornachi, A. (2009). Man-
ual T
´
ecnico da Via Permanente.
Magalh
˜
aes, P. C. (2007). Apostila de Engenharia de Linha:
M
´
odulo de Superestrutura III. Curso de Capacitac¸
˜
ao
em Geometria de Linha: Vale/FCA, Belo Horizonte.
Malik, Q.-u.-A. (2013). Novel methods of object recog-
nition and fault detection applied to non-destructive
testing of rail’s surface during production. PhD the-
sis, Manchester Metropolitan University.
Passos, R., Ferreira, M. P., Silva, A. d. B.-H., Lopes, L.
A. S., and Ribeiro, H. (2022). An in-depth assessment
of convolutional neural networks for rail surface de-
fect detection. page 13.
Rong, J., Song, S., Dang, Z., Shi, H., and Cao, Y. (2016).
Rail Track Irregularity Detection Method Based on
Computer Vision and Gesture Analysis. Interna-
tional Journal of Online and Biomedical Engineering
(iJOE), 12(12):55–59.
Rubinsztejn, Y. (2011). Automatic Detection of Objects of
Interest from Rail Track Images. PhD thesis, Univer-
sity of Manchester Faculty of Engineering and Physi-
cal Science.
Silva, L. P. F. e., Yared, G. F. G., and Reis, A. J. d. R. R.
(2022). Sistema de Multiplos Classificadores para
Detecc¸
˜
ao de Defeitos em Dormentes de Ac¸o.
Srinivasan, N. (2020). Development of a railroad track in-
spection system based on visual perception using lab-
view. Journal of mechanics of continua and mathe-
matical sciences, 15(5).
Yokoyama, S. and Matsumoto, T. (2017). Development
of an automatic detector of cracks in concrete using
machine learning. Procedia Engineering, 171:1250–
1255.
Digital Image Processing in the Diagnosis of Cracks in Steel Sheet
629
