
Forecasting of COVID-19 Pandemic Using ARIMA and Fb-Prophet
Models: UK Case Study
Victor Chang
1a
, Oghara Efetobore Akpomedaye
2
, Vitor Jesus
1b
, Qianwen Ariel Xu
1c
,
Karl Hall
2d
and Meghana Ashok Ganatra
2
1
Department of Operations and Information Management, Aston Business School, Aston University, Birmingham, U.K.
2
Information Systems and AI Research Group, School of Computing and Digital Technologies, Teesside University,
Middlesbrough, U.K.
drazarx3@gmail.com and meghana.ganatra@gmail.com
Keywords: COVID-19 Prediction, ARIMA, PROPHET, Health Analytics.
Abstract: This study aims to provide insights into predicting future cases of COVID-19 infection and rates of virus
transmission in the UK by critically analyzing and visualizing historical COVID-19 data, so that healthcare
providers can prepare ahead of time. In order to achieve this goal, the study invested in the existing studies
and selected ARIMA and Fb-Prophet time series models as the methods to predict confirmed and death cases
in the following year. In a comparison of both models using values of their evaluation metrics, root-mean-
square error, mean absolute error and mean absolute percentage error show that ARIMA performs better than
Fb-Prophet. The study also discusses the reasons for the dramatic spike in mortality and the large drop in
deaths shown in the results, contributing to the literature on health analytics and COVID-19 by validating the
results of related studies.
1 INTRODUCTION
According to WHO data, the United Kingdom, the
United States, Mexico, France, and Brazil are among
the countries most affected by the pandemic. On
January 30, 2020, the first two verified cases of
COVID-19 were discovered in the United Kingdom
(Gaur et al., 2020 ). Since then, COVID-19 has
mutated into numerous variants, including "Alpha,"
which was first found in the UK, "Beta," in South
Africa, "Gamma," in Brazil, and "Delta," in India,
causing two devastating infection waves in the UK
and other areas of the world. Finally, the Omicron
variant made its appearance and is now the most
common. In recent months, the UK has observed a
reduction in infection rates following multiple
vaccination campaigns and early adherence to strict
regulatory laws such as face masking, social
distancing, and prohibitions on religious, cultural,
and educational gatherings. Furthermore, those who
a
https://orcid.org/0000-0002-8012-5852
b
https://orcid.org/0000-0002-5884-0446
c
https://orcid.org/0000-0003-0360-7193
d
https://orcid.org/0000-0003-2863-3312
were considered to be very sensitive to serious
sickness were advised to stay home in self-isolation
and avoid social interactions. Artificial intelligence
technology has also been deployed to help in COVID-
19 diagnosis, screening, prediction, and drug
repurposing. The UK National Health Service (NHS)
test and trace service help people with symptoms that
are associated with COVID-19 to get tested and then
follow up with those who test positive.
Regardless, the pandemic will persist as a global
health issue for at least a few more years. There are
expectations that additional waves of the pandemic
will occur due to the virus's dynamic nature, which
has previously mutated into other variants. As such, it
is necessary to study how the virus spreads so we can
learn from visualization and prediction of the current
situation and be better prepared for the following
waves and their impact. To this end, AI predictive
modeling can be employed to analyze and forecast
COVID-19 based on past and current data.
Chang, V., Akpomedaye, O., Jesus, V., Xu, Q., Hall, K. and Ganatra, M.
Forecasting of COVID-19 Pandemic Using ARIMA and Fb-Prophet Models: UK Case Study.
DOI: 10.5220/0011990300003485
In Proceedings of the 8th International Conference on Complexity, Future Information Systems and Risk (COMPLEXIS 2023), pages 85-93
ISBN: 978-989-758-644-6; ISSN: 2184-5034
Copyright
c
2023 by SCITEPRESS – Science and Technology Publications, Lda. Under CC license (CC BY-NC-ND 4.0)
85

AI and Big Data research has been at the forefront
of the COVID-19 battle, especially in the detection
and forecasting of the disease spread. Time series–
based forecasting methods, such as Auto-Regressive
Integrated Moving Average (ARIMA), Fb-Prophet,
Nonlinear Autoregression Neural Network
(NARNN), and Long-Short Term Memory (LSTM)
approaches, have recently been popular in AI
predictive analysis (Wang et al., 2020). Therefore,
this study is focused on time series analysis and
forecasting of the COVID-19 cases in the UK using
ARIMA and Fb-Prophet predictive models. We have
chosen these models as they are most suitable for
time-series forecasting. They capture different
aspects of underlying patterns, which is the main
requirement of COVID-19 data to predict the trend
based on data. This will help improve our
understanding of how COVID-19 spreads and allow
us to plan ahead to mitigate the crisis. Furthermore, a
comparison between these models is conducted to
determine which performs better.
2 LITERATURE REVIEW
Starting in December 2019, every country has been
dealing with COVID-19 outbreaks; as a result,
forecasting future instances using different time
series forecasting models or algorithms based on
historical data is now a focus of recent research.
Gecili et al. (2021) implemented four models on
COVID-19 data from USA and Italy: 1) the Holt
model, which uses dual exponential smoothing; 2) the
ARIMA model; 3) the TBATS model (Trigonometric
Exponential smoothing state space model with Box-
Cox transformation, ARIMA errors, Trend and
Seasonal component), and 4) the Cubic Smoothing
Spline model based on a stochastic state space model
that permits the use of a possible strategy for
predicting the smoothing parameter. The result
showed that ARIMA and Cubic Smoothing Spline
Models performed better than TBATS and Holt-
Winter models, with smaller prediction errors and
narrower prediction intervals. Similar results were
obtained by (Sharma et al., 2021). by applying
ARIMA with a further decomposition of the time
series to test for unit roots and validate against data
from multiple countries. They employed the root-
mean-square error (RMSE) to evaluate the prediction
performance; (Benvenuto et al., 2019) further
justified ARIMA's prediction properties through
descriptive analysis.
Based on the COVID-19 dataset of confirmed
cases in China (Ye and Yang, 2021) proposed an
uncertain time series detection model. The aim of this
model is to analyze the evolution of the confirmed
cases. They compared their model with other classical
methods to deal with time series datasets and found
that the proposed method outperformed other
methods in describing the COVID-19 epidemic by
reducing the estimated variance of the disturbance
term to an acceptable value.
In the work of Rasjid et al. (2021), LSTM and
Savitzky-Golay Smoothing methods were employed
to create prediction models for predicting the death
and infected COVID-19. They applied the prediction
models to the dataset from Indonesia and compared
their performance. The results showed that the LSTM
forecast has a clear upward trend and is consistent
with the Time Series data.
In a COVID-19 dataset gathered from the Kaggle
website for Indonesia (Satrio et al., 2021) investigate
the application of ARIMA and Fb-Prophet models to
forecast the confirmed deaths and recovered cases.
The performance and accuracy of these models'
outputs were compared using R
2
, Mean Squared Error
(MSE), Mean Absolute Error (MAE), and Mean
Forecast Error (MFE). The results of the error
measurements indicated that the Prophet model
outscored the ARIMA model with minimal
differences between the actual data.
Dwivedi et al. (2021) examined the efficacy and
suitability of the Fb-Prophet and the ARIMA
prediction models to the Indian COVID-19 dataset
with confirmed deaths and recovered cases, which
was collected from the COVID-19 India site.
Comparing these two models showed that ARIMA
surpasses Prophet in terms of its prediction accuracy.
In order to forecast future COVID-19 infections
and mortalities in Bangladesh, (Sarkar et al., 2020)
used ARIMA and machine learning algorithms in
their research and evaluated them by RMSE. The Fb-
Prophet model delivered the best forecasting result
with exceptional precision among other forecasting
models, including Holt's Linear Regression, Support
Vector Regression, and Holt's Winter Additive
Model.
As the COVID-19 pandemic is becoming a
prevalent danger for humankind worldwide (Arora et
al., 2021) investigated the COVID-19 data from a
source at Johns Hopkins University for five months
in 2020 and predicted the trend in weeks using
ARIMA and regression models. The evaluation
results from error measurement by Root Mean
Squared Logarithmic Error (RMSLE) showed that
ARIMA outperformed regression models.
By examining the most recent literature relating to
the prediction of COVID-19 confirmations and
COMPLEXIS 2023 - 8th International Conference on Complexity, Future Information Systems and Risk
86
mortality, it can be concluded that ARIMA and
Fbprophet are the least geographically constrained
compared to other methods and demonstrate good
predictive power (Battineni et al., 2020). Therefore,
ARIMA and Fbprophet were chosen for this study to
examine the UK context. In addition, error metrics are
also used to evaluate our models by measuring the
difference between predicted and actual data.
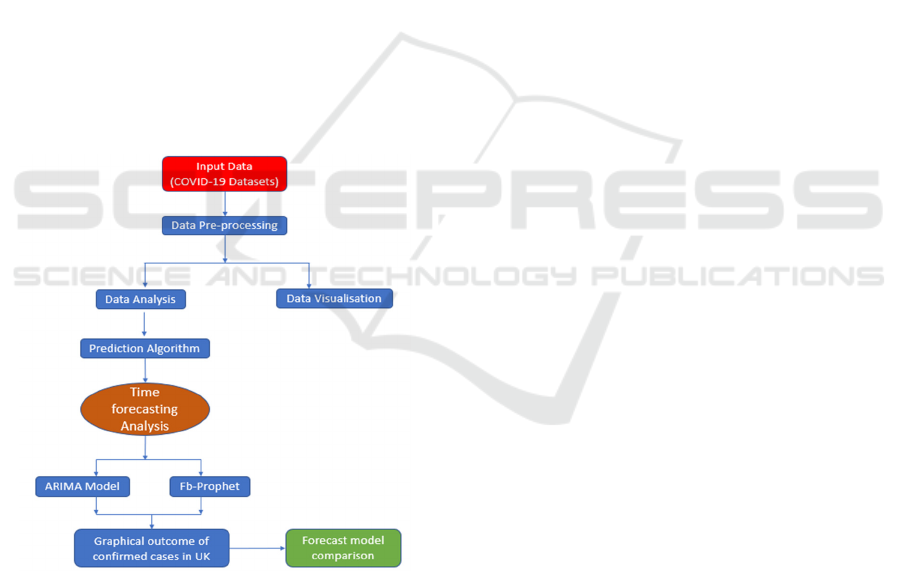
3 MATERIALS AND
METHODOLOGY
Using the Google Colab IDE, effective data analysis
techniques and prediction models are implemented in
Python 3.8. ARIMA and Fb-Prophet models from the
openly available packages “statsmodels” and “Fb-
Prophet”, respectively, are used to forecast COVID-
19 confirmed cases in the UK for the next 365 days.
Finally, the evaluation metrics root mean square error
(RMSE), mean absolute error (MAE) and mean
absolute percentage error (MAPE) of both models are
compared to find the best forecasting model. The
workflow of this study is presented in Figure 1.
Figure 1: Study Workflow.
3.1 Forecasting Models
3.1.1 Fb-Prophet
Fb-Prophet is a forecasting algorithm developed by
Meta. This model is based on the additive regression
technique, which recognizes patterns, seasons, and
holidays before combining them to improve forecast
accuracy (Anandatirtha et al., 2020). This model uses
a combination of non-linear and linear algorithms, as
well as time as a regressor. It is expressed as follows.
= (1)
where g(t) is the trend function; piecewise linear
or logical growth to fit non-periodic changes in the
value of the time series, s(t) are the periodical
variations (e.g., week after week/yearly irregularity),
h(t) are the effects of holidays that occur on irregular
schedules over a day or more, and e(t) is any unusual
change which is not accommodated by the model.
The model's input is always a time series with two
components: t is time, and y is the total number of
occurrences in a given country.
3.1.2 Arima (Autoregressive Integrated
Moving Average Model)
ARIMA is a common time-series model that can be
used to detect linear trends in definite time values.
ARIMA forecasts future values by examining the
differences between values in the time series.
ARIMA(p, d, q) models are a fusion of integrated
autoregressive (AR) and moving average (MA)
models.
=cϕ
ϕ
…ϕ
θ
θ
…
θ
(2)
Where:
: the value of the time series at time t
c: the constant or intercept term
p: the order of the autoregressive (AR) part
of the model
d: the degree of difference needed to make
the time series stationary
q: the order of the moving average (MA) part
of the model
ϕ_: the coefficient of the ith lagged
observation in the AR part of the model
θ_: the coefficient of the ith lagged error
term in the MA part of the model
_: the error term at time t
Parameter Evaluation By Testing for Stationarity.
In time series, stationary is a crucial component. For
data to be stationary, it has a mean, variance, and
autocorrelation structure that remain constant across
time. A model cannot forecast on non-stationary time
series data. Hence the first step in ARIMA time series
forecasting is to calculate the number of differencing
necessary to make the series stationary.
The Augmented Dickey-Fuller (ADF) test was
used to determine whether or not the time series data
Forecasting of COVID-19 Pandemic Using ARIMA and Fb-Prophet Models: UK Case Study
87

were stationary before calculating the parameters for
the ARIMA model (Alzahrani et al., 2020). This
approach aims to maintain the reliability of the test
based on white noise. Assume that the significance
level is 5%, and the null hypothesis is that the series
is not stationary. Suppose the critical value of the
ADF test is greater than 0.05. the null hypothesis is
accepted and the time series is confirmed to be non-
stationary. In this case, differences of varying degrees
are then used in the series to produce a stationary
series (Wanjuki et al., 2021).
3.2 Quantitative Study
3.2.1 Data Source and Description
The datasets for this study were obtained from the
GitHub account of the Johns Hopkins University
Centre for Systems Science and Engineering's (JHU
CSSE) data repository for the 2019 Novel
Coronavirus Visual Dashboard (Alzahrani, et al.,
2020)
Two different time series datasets were obtained:
confirmed cases and deaths, containing information
collected daily throughout the globe and is updated in
real-time.
3.2.2 Data Preprocessing
Data cleaning was carried out in order to acquire
useful data for analysis, visualization, and
forecasting. The columns "Province," "Lat," and
"Long" were dropped from the dataframe since they
were no longer needed. Meanwhile, the data
collection dates columns are transposed to a single
column and indexed as a timestamp for time series
forecasting. Missing values in each of the datasets
were also checked and replaced with zeros.
As this study focuses on the COVID-19 cases in
the United Kingdom, the data samples from the UK
were extracted from the global COVID-19 time series
repository. For each dataset, there are 807 data
samples, recording the number of confirmed/death
from January 22, 2020 to April 7, 2022.
Calculations for the following statistical
information were obtained:
UK daily percentage growth rate in the past 30
days = (Active cases of the current day – Active cases
30 days ago / Active cases 30 days ago) *100
UK daily death rate = (Daily deaths / Daily
confirmed cases) *100
UK death rate = (Accumulated deaths /
Accumulated confirmed cases) *100
3.3 Model Performance Evaluation
Metrics
The performance of each of the models mentioned
above is evaluated using a widely popular accuracy
measurement function. These measures are explained
below.
3.3.1 Mean Absolute Percentage Error
(MAPE)
MAPE is derived as the mean absolute percent
inaccuracy for each time period, excluding actual
values divided by real values and assesses the
accuracy of the forecast as a percentage—the better
the forecast, the lower the MAPE.
=
100
−
(3)
3.3.2 Mean Absolute Error (MAE)
MAE calculates the absolute value of an anticipated
value. After that, we simply add up all of the absolute
values that have been recorded. A better fit is
evidenced by a reduced MAE value.
=
∑|
−
|
(4)
3.3.3 Root Mean Squared Error (RMSE)
It evaluates the forecast model's absolute fit to the
data or how close the model's predicted values are to
the observed data points. It's frequently used as an
evaluation metric as well as a loss function.
=
1
−
ŷ
(5)
In equations (3) to (5), n is the number of
observations, _ is the actual value, and _ is the
predicted value.
4 DATA VISUALISATION AND
ANALYSIS
4.1 Summary of COVID-19 in the UK
Our analysis is based on the code (COVID-19 data,
2023). From Figure 2, we can observe that confirmed
COMPLEXIS 2023 - 8th International Conference on Complexity, Future Information Systems and Risk
88
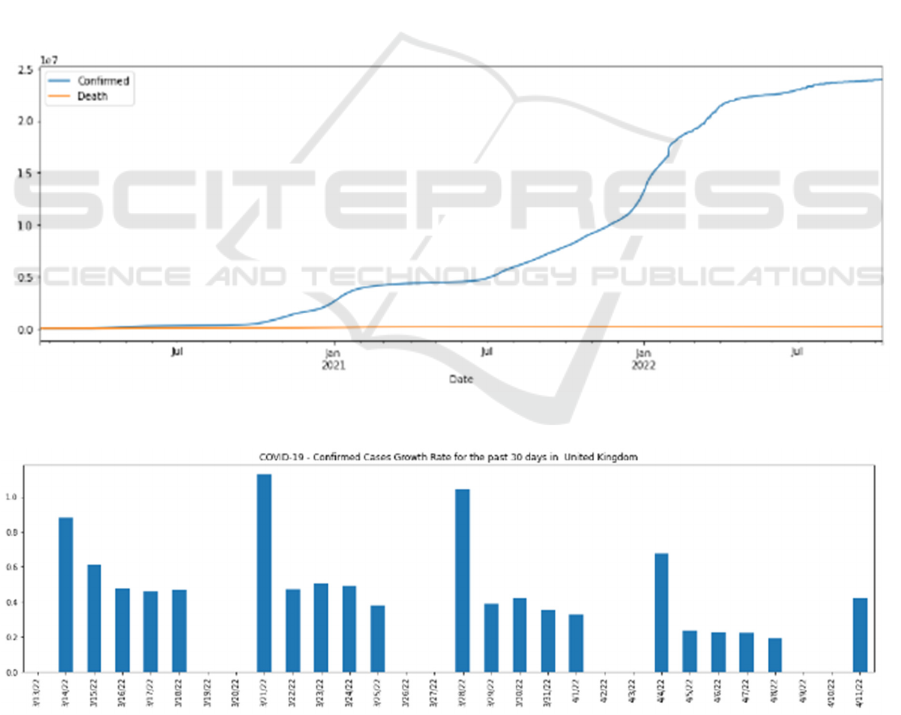
cases are rising rapidly from July 2021 onwards till
April 2022, while the death rates are below the 0.5
percentile. Although the number of deaths is
significantly lower than the number of confirmed
cases, these huge numbers imply how much people's
lives and work are affected. Moreover, it remains on
an upward trend and has not plateaued, meaning that
the impact continues.
Figure 3 indicates the confirmed case growth in
the UK from March 13, 2022, to April 11, 2022. It is
shown that the few days have the highest count up to
1.0 and other days below 0.6. This can give us an idea
of the upcoming few days ahead.
Figure 4 shows there is a peak in the death rate in
the UK in May 2020, with a maximum percentile of
15 and then a slow decline begins. Between October
and late November 2021, the mortality rate drops
sharply to about 3%, and after September 2021, the
rate drops to below 2%. This helps us understand that
the impact of COVID-19 on death rates is reduced
and stabilized in the span of two years.
4.2 Forecasting UK Confirmed Cases
by Fb-Prophet
Figure 5 shows Fb-Prophet's prediction of confirmed
cases for the coming year (365 days) from March 1,
2022. The black line indicates the original data points
in the training set. The shaded area in the light blue
color indicates the uncertainty level with an upper and
lower boundary, and the dark blue line indicates the
prediction. The uncertainty intervals can be used to
make more informed decisions. In the case of
predicting confirmed cases of COVID-19, healthcare
providers can prepare in advance based on the upper
limit of the uncertainty interval. In the future, there
may be a steady increase in the number of cases.
Therefore, the UK government should plan to act
accordingly to prevent this as much as possible.
Figure 2: UK Confirmed and Death cases.
Figure 3: Confirmed cases growth rate from 3/13/2022 to 4/11/2022 in the UK.
Forecasting of COVID-19 Pandemic Using ARIMA and Fb-Prophet Models: UK Case Study
89
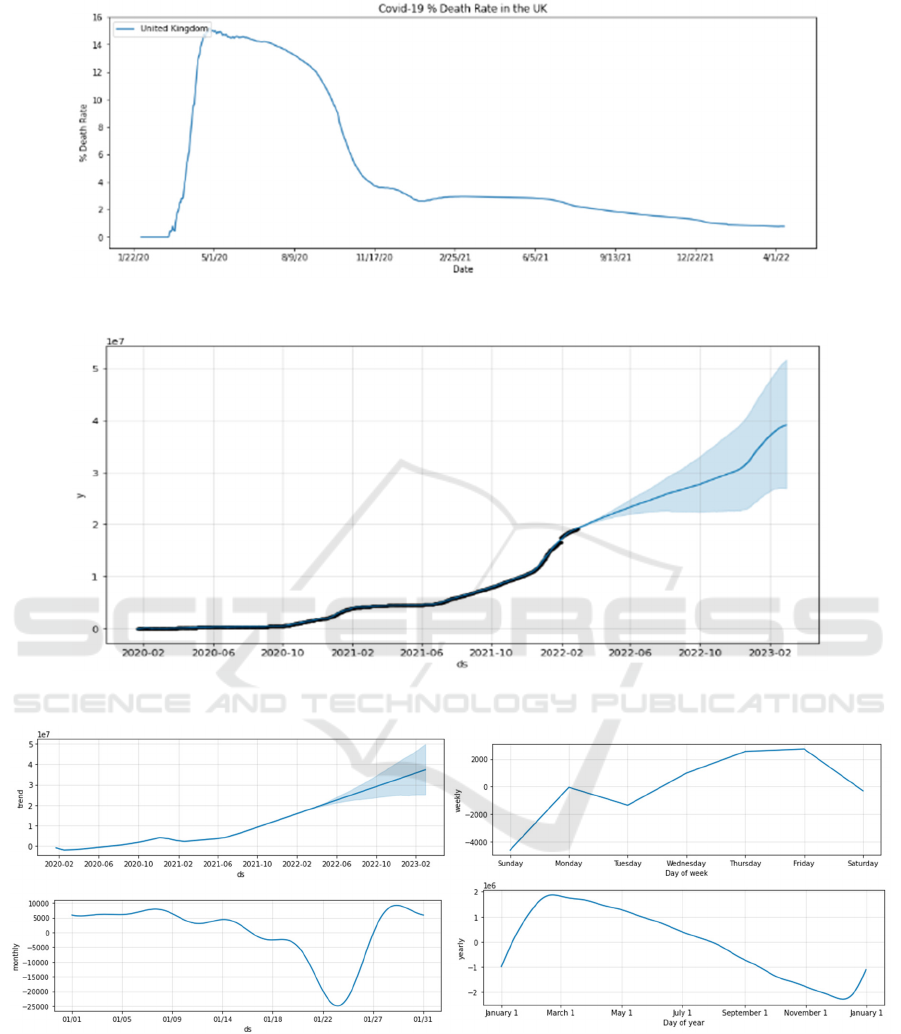
Figure 4: COVID-19 death rate percentage in the UK.
Figure 5: Fb-Prophet 365 days forecast.
Figure 6: Forecast trend and seasonality.
Figure 6 shows the trend of the COVID-19
confirmed cases and the seasonality (in a week, a
month, and a year) of the time series data. The first
sub-figure of Figure 6 shows a high increase in cases
around June 2022, and there is predicted to be a
steady increase leading into 2023. The weekly
forecast shows a high increase in cases from Tuesday
to Friday and then a steady drop. The monthly
forecast shows a steady curve in cases from January
1 to January 18 and then a huge drop until the end of
the month before an extreme spike. The yearly
forecast shows a high increase in cases from January
1 to March 1 and then a steady drop till the end of the
year and a hike on January 1 again.
COMPLEXIS 2023 - 8th International Conference on Complexity, Future Information Systems and Risk
90
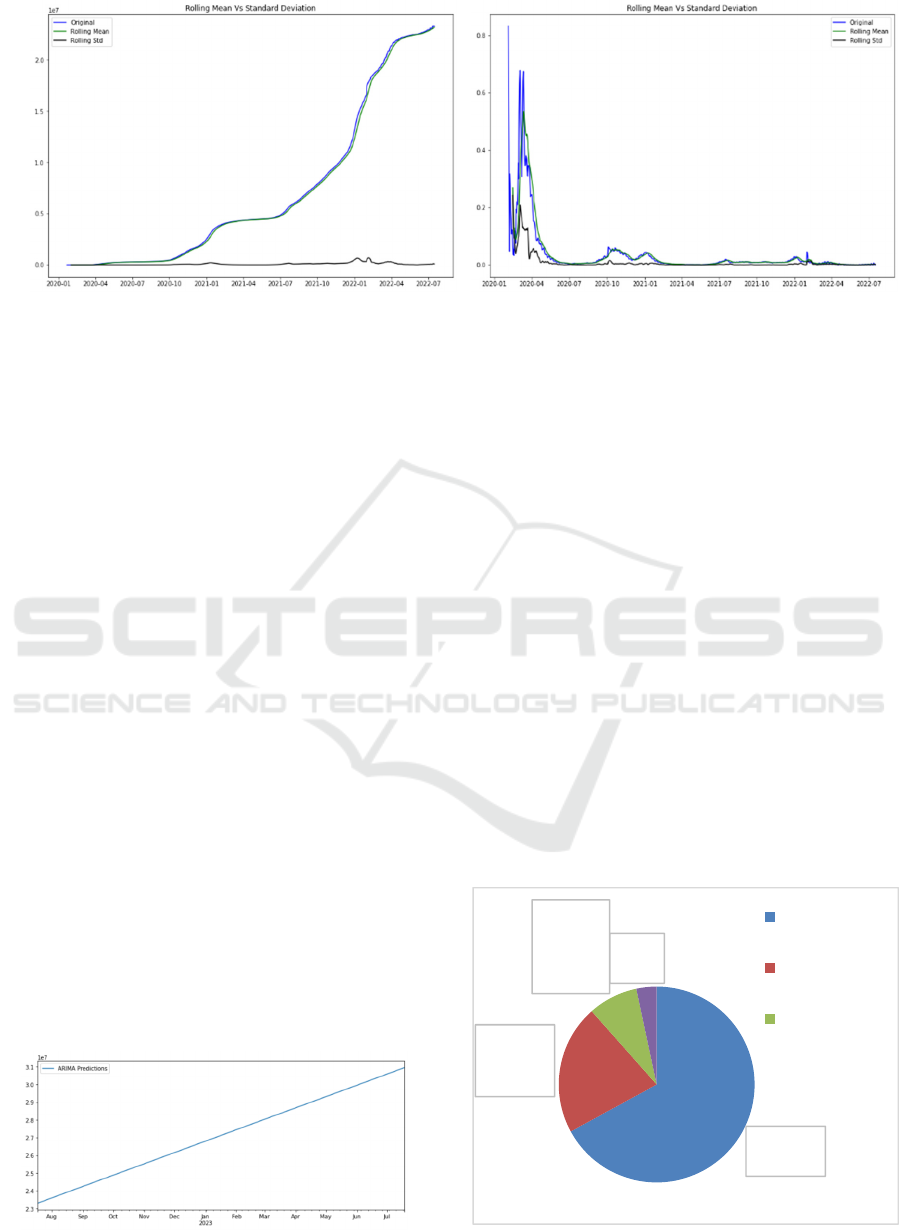
Figure 7: ADF Test for initial data (left) and for logarithmic values (right).
4.3 Forecasting UK Confirmed Cases
by ARIMA
The result of the stationary test is shown in Figure 7.
As shown in this figure, the rolling mean and original
data are trending in the same path while the rolling
standard deviation is constant. In addition, the p-value
of the test is 0.98 (p > 0.05). Therefore, the time-
series data appeared to be non-stationary based on the
ADF test result, and the variance between the data
must be compressed using the log scale of the data.
After transforming the data into the log form, this
study conducted the ADF Test again to check the
stationary values. The null hypothesis was rejected
because, after applying the initial difference, d(0), the
p-value produced was less than the significance level
(p 0.05), and the statistical ADF was smaller than all
the other critical bounds. The results are shown in
Figure 7.
After checking the dataset for the stationary, the
stepwise search by (Hyndman and Khandaka, et al
2008) was conducted to figure out the order for the
best ARIMA model. The results show that the order
for the best model is ARIMA(3,2,3)(0,0,0)[0], with
the minimum Akaike’s Information Criterion (AIC)
of 21,376.38 and Bayesian Information Criterion of
21410.04. The parameters obtained were then used to
train the Arima model and make predictions on the
test set. The results (Figure 8) of the ARIMA model
validate the increasing trend forecast by Fb-Prophet.
Figure 8: ARIMA Forecast.
The Linear trend is almost perfect, which may
happen due to the following reasons.
• The model is overfitting the data, it may fit the
trend too close.
• The data exhibits the linear trend, ARIMA is
perfectly capturing a trend component of the
time series, it also indicates that the model is
removing the trend component from the data,
so it is not a cause of concern.
5 ANALYSIS AND FINDINGS
A comparison of active cases in the UK and some
other countries worst hit by the pandemic is shown in
Figure 3. In the graph, the UK was 4th on the list of
countries with the most active cases. The percentage
growth rate of confirmed cases from March 13, 2022
to April 11, 2022, was calculated and visualized in
Figure 3. March 21 and April 8, 2022, recorded the
highest and lowest confirmed case growth rates,
respectively.
Figure 9: Active Cases from Jan 2020 to Jan 2023.
Americas
67%
SouthEas
t Asia
22%
Eastern
Mediterr
anean
8%
Africa
3%
Americas
SouthEast Asia
Eastern
Mediterranean
Forecasting of COVID-19 Pandemic Using ARIMA and Fb-Prophet Models: UK Case Study
91

5.1 Model Evaluation
Figures 5 and Figure 6 show the Fb-Prophet forecast
model trend of confirmed cases in the next 365 days.
These show the underlying trend in the prediction is
a linear trend while also accurately modeling weekly
and monthly seasonality. The exponential curves of
the forecast from the Fb-Prophet and ARIMA models
show there will be more confirmed cases in the next
year (365 days).
Table 1: Evaluation Metrics Comparison between Models.
Model RMSE MAE MAPE
ARIMA 473888.97 379160.07 0.02
Fb-Prophet 1539062.30 1504264.94 0.15
In order to evaluate the performance of the Fb-
Prophet and ARIMA models, error measurement
metrics, RMSE, MAE, and MAPE, were carried out
and the results are shown in Table 1. They are
commonly used metrics to evaluate the accuracy of
time series forecasting models. We have made this
comparison to determine which model gives less error
and is more accurate in predicting the result. A lower
value of the different evaluation metrics indicates a
model is well fit and has a higher prediction accuracy.
A comparison of RMSE, MAE, and MAPE shows
that the ARIMA model performed better than Fb-
Prophet. The MAE for ARIMA is 379160 and for Fb-
Prophet is 1504264, which is three times higher than
the MAE for ARIMA. Similarly, the RMSEs of the
two models show a vast difference, with ARIMA
being at 473888 and Fb-prophet at 1539062. Finally,
we compared the MAPE values of the two models at
0.02 for ARIMA and 0.15 for Fb-Prophet. The
significantly lower values of error indicators for
ARIMA show that ARIMA is better at capturing the
patterns and trends in the time series data and making
accurate forecasts than Fb-Prophet.
5.2 Forecasting Discussion
The following can be inferred from the analysis with
respect to existing literature:
• Figure 4 shows a considerable decrease in
deaths due to the deployment and adherence to
pandemic control measures such as lockdowns, social
distancing, face masking, sanitization, and
vaccination by individuals and the UK authority.
Dashtbali and Mirzaie's work in 2021 is therefore
justified. They created two models, SEIHRD and
SMEIHRDV, that accurately predicted how social
distancing and vaccination are used to manage the
COVID-19 pandemic (Mohan, et al., 2022).
• There was a drastic spike in the death rate, as
seen in Figure 4, during the early months of the
outbreak. It is evident in the work of Anderson et al.
(2020) that data collection and research to better
understand the virus's nature and behavior were
ongoing while healthcare systems were overwhelmed
due to the hospitalization cases surge (Anderson, et
al., 2020).
6 CONCLUSIONS AND
IMPLICATIONS
Predictive analysis of COVID-19 infectious disease
using a time-series model is a useful application of AI
and Big Data in the fight against the virus. The
proposed models predicted an exponential slope from
confirmed cases, implying that there will most
probably be more instances in the next 365 days.
Nevertheless, new variants, herd immunity, vaccines,
and available resources may all alter mortality case
projection curves. This study will enable the
government and healthcare providers to understand
the current situation better and prepare for the next
wave so that less damage is caused in the near future.
In the future study, we can enhance this study by
taking the latest data and adding time series
algorithms like SEIR(Suspected Exposed Infections
Removed) for short-term and long-term forecasting,
Hybrid models like combining ARIMA with LSTM
to capture trends in data.
ACKNOWLEDGEMENTS
This project is partly supported by VC Research
(VCR0000199).
REFERENCES
Alzahrani, S.I., Aljamaan, I.A. and Al-Fakih, E.A., 2020.
Forecasting the spread of the COVID-19 pandemic in
Saudi Arabia using ARIMA prediction model under
current public health interventions. Journal of infection
and public health, 13(7), pp.914-919.
Anandatirtha JS, Shree BH, Janani M. Analysis and
Forecasting COVID-19 in India. Int J Res Appl Sci Eng
Technol. 2020 August 31;8(8):70-6.
Anderson, R.M., Heesterbeek, H., Klinkenberg, D. and
Hollingsworth, T.D., 2020. How will country-based
mitigation measures influence the course of the
COMPLEXIS 2023 - 8th International Conference on Complexity, Future Information Systems and Risk
92

COVID-19 epidemic? The lancet, 395(10228), pp.931-
934.
Arora, R., Agrawal, A., Arora, R., Poonia, R.C. and
Madaan, V., 2021. Prediction and forecasting of
COVID-19 outbreak using regression and ARIMA
models. Journal of Interdisciplinary Mathematics,
24(1), pp.227-243.
Battineni, G., Chintalapudi, N. and Amenta, F., 2020.
Forecasting of COVID-19 epidemic size in four high
hitting nations (USA, Brazil, India and Russia) by Fb-
Prophet machine learning model. Applied Computing
and Informatics.
Benvenuto, D, Giovanetti, M, Vassallo, L, Angeletti, L,
Ciccozzi, M, Application of the ARIMA model on the
COVID-2019 epidemic dataset, Data in Brief, Volume
29, 2020, 105340, ISSN 2352-3409.
COVID-19 data, Available at: https://github.com/
CSSEGISandData/COVID-19 (accessed January 17,
2023)
Dwivedi, A., 2021. Forecasting of Covid-19 Trends Using
Arima Model and Tableau. SPAST Abstracts, 1(01).
Gaur, S., 2020. Global forecasting of covid-19 using
ARIMA based FB-Prophet. International Journal of
Engineering Applied Sciences and Technology, 5(2),
pp.463-467.
Gecili, E., Ziady, A. and Szczesniak, R.D., 2021.
Forecasting COVID-19 confirmed cases, deaths, and
recoveries: revisiting established time series modeling
through novel applications for the USA and Italy. PloS
one, 16(1), p.e0244173.
Hyndman RJ, Khandakar Y. Automatic time series
forecasting: the forecast package for R. Journal of
statistical software. 2008 July 29;27:1-22.
Mohan, S., Solanki, A.K., Taluja, H.K. and Singh, A., 2022.
Predicting the impact of the third wave of COVID-19
in India using hybrid statistical machine learning
models: A time series forecasting and sentiment
analysis approach. Computers in Biology and
Medicine, 144, p.105354.
Rasjid, Z. E., Setiawan, R., & Effendi, A. (2021). A
comparison: prediction of death and infected COVID-
19 cases in Indonesia using time series smoothing and
LSTM neural network. Procedia computer science, 179,
982-988.
Sarkar, O., Ahamed, MF and Chowdhury, P., 2020,
December. Forecasting & Severity Analysis of
COVID-19 Using Machine Learning Approach with
Advanced Data Visualization. In 2020 23rd
International Conference on Computer and Information
Technology (ICCIT) (pp. 1-6). IEEE.
Satrio, C.B.A., Darmawan, W., Nadia, B.U. and Hanafiah,
N., 2021. Time series analysis and forecasting of
coronavirus disease in Indonesia using ARIMA model
and PROPHET. Procedia Computer Science, 179,
pp.524-532.
Sharma, R. R., Kumar, M., Maheshwari S. and Ray K. P.,
"EVDHM-ARIMA-Based Time Series Forecasting
Model and Its Application for COVID-19 Cases," in
IEEE Transactions on Instrumentation and
Measurement, vol. 70, pp. 1-10, 2021, Art no. 6502210,
doi: 10.1109/TIM.2020.3041833.
Wang, P., Zheng, X., Ai, G., Liu, D. and Zhu, B., 2020.
Time series prediction for the epidemic trends of
COVID-19 using the improved LSTM deep learning
method: Case studies in Russia, Peru, and Iran. Chaos,
Solitons & Fractals, 140, p.110214.
Wanjuki, T. M., Wagala, A., & Muriithi, D. K. (2021).
Forecasting Commodity Price Index of Food and
Beverages in Kenya Using Seasonal Autoregressive
Integrated Moving Average (SARIMA) Models.
European Journal of Mathematics and Statistics, 2(6),
50-63.
Ye, T., & Yang, X. (2021). Analysis and prediction of
confirmed COVID-19 cases in China with uncertain
time series. Fuzzy Optimization and Decision Making,
20(2), 209-228.
Forecasting of COVID-19 Pandemic Using ARIMA and Fb-Prophet Models: UK Case Study
93
