
Examining the Intra-Location Differences Among Twitter Samples
Rositsa V. Ivanova
1 a
, Ema Ku
ˇ
sen
2 b
and Stefan Sobernig
1 c
1
Institute of Information Systems and New Media, Vienna University of Economics and Business, Vienna, Austria
2
Faculty of Informatics, University of Vienna, Vienna, Austria
Keywords:
Data Analysis, Data Collection, Data Quality, Network Science, Social Networks, Twitter.
Abstract:
In this paper, we explore Twitter data samples collected from five different geographical locations. For each
of these geographical locations, we compare variations occurring within samples collected simultaneously
from two different machines running Twitter API clients. In addition, we split the collected data samples into
“complete” and “incomplete” datasets. An incomplete dataset is a collection of Twitter messages where at
least one machine received a smaller data sample due to some interruption. A complete dataset is one that
includes all tweets that Twitter’s API delivers for a particular set of search parameters. Our findings indicate
that 86% of the complete samples show some variations in the attribute values attached to extracted tweets.
While the complete datasets show comparable attribute values and network characteristics, the incomplete
data samples exhibit substantial differences. We arrive at recommendations for researchers on Online Social
Networks on how to mine Twitter data while mitigating these risks.
1 INTRODUCTION
In the search for representative and freely acces-
sible data on Online Social Networks (OSN), re-
searchers frequently rely on datasets extracted from
Twitter. Tweets (Twitter messages) have been uti-
lized in various research fields from applied network
science to medicine (Grinberg et al., 2019; Morone
and Makse, 2015; Broniatowski et al., 2018; Bouty-
line and Willer, 2017; Ku
ˇ
sen and Strembeck, 2021).
Twitter’s well-documented and publicly available
application programming interface (API) grants re-
searchers automated access to large datasets, only
requiring an existing Twitter account. As a major
downside, Twitter data is only made available to re-
searchers free of charge as a blackbox sample. Access
types with fewer limitations (e.g., higher monthly rate
limits, access to a full archive) are offered by Twit-
ter either via commercial or special purpose accounts
(e.g., for academic research). While these types of
accounts are used in business and academic settings,
they are either paid for or granted upon request after
fulfilling specific criteria. In many cases, researchers
may not be able to obtain an academic account or can-
not afford paying to lift the paywall. This leaves re-
a
https://orcid.org/0000-0002-4149-5017
b
https://orcid.org/0000-0003-1145-6778
c
https://orcid.org/0009-0002-5018-7961
searchers with free-of-charge API access to samples
of Twitter data.
Despite Twitter’s popularity as a data source, there
is still little awareness among OSN researchers of
how this sampled data from Twitter may affect their
research and how sampling has to be accounted for
in their research designs. Regarding representative-
ness, Twitter data samples were found to potentially
under- or over-represent certain user accounts (Pfef-
fer et al., 2018). Dataset sizes and the user accounts
contained therein vary substantially based on the ac-
cess types (Kim et al., 2020). Furthermore, Wang
et al. (2015) found that the various access types re-
sult in different user-activity patterns and sentiments.
Similarly, Morstatter et al. (2013) compared differ-
ent Twitter API endpoints and discovered that Twit-
ter data obtained via the free-of-charge API performs
worse than other access types in terms of reflecting
the statistical properties of Twitter activity. When
comparing data samples collected using popular and
non-popular search terms, Campan et al. (2018) re-
vealed that only unpopular search terms lead to un-
biased samples and that, otherwise, samples cannot
be considered random. Recently, Pfeffer et al. (2022)
found that approximately 10% of tweets are deleted in
the short term and up to 30% over the period of four
years. Moreover, Timoneda (2018) found that even
in the short term, 20-30% tweets of strong political
94
Ivanova, R., Kušen, E. and Sobernig, S.
Examining the Intra-Location Differences Among Twitter Samples.
DOI: 10.5220/0011990600003485
In Proceedings of the 8th International Conference on Complexity, Future Information Systems and Risk (COMPLEXIS 2023), pages 94-101
ISBN: 978-989-758-644-6; ISSN: 2184-5034
Copyright
c
2023 by SCITEPRESS – Science and Technology Publications, Lda. Under CC license (CC BY-NC-ND 4.0)

content could not even be recovered via the free-of-
charge API.
In Ivanova et al. (2022), we investigated the dif-
ferences in data samples that were collected from var-
ious geolocations. In this context, geolocations re-
fer to network-topological locations (Internet nodes)
that send requests to the free-of-charge Twitter API.
In particular, we showed that data collections ex-
tracted from the same geolocation as well as the same
network-topological zone may vary in terms of users
and tweets collected, as well in terms of the associ-
ated metadata. As a consequence, we showed that the
derived networks, such as retweet and mention net-
works, also exhibit substantial differences relevant to
a research design.
This paper extends our previous study by exam-
ining the differences between data samples extracted
from two different machines running at the same ge-
ographical location (i.e., intra-location differences).
For this purpose, we distinguish between two types
of data collections: 1) an incomplete collection re-
sults from at least one dataset not being fully retrieved
due to various server errors; 2) a complete collection
results from all available data having been received
from the Twitter API endpoint in a proven manner.
The remainder of this paper is structured as fol-
lows. Section 2 gives an overview of the background
information fundamental to this paper. Section 3 then
describes our technical approach for mining Twit-
ter data in an orchestrated manner. Next, Section 4
presents key findings and limitations. Section 5 con-
cludes the paper.
2 BACKGROUND
2.1 Twitter Data Model
For each request, the Twitter Search API v1.1 returns
tweets containing a wide variety of attributes. These
attributes include data related to the tweet itself (e.g.
creation time), geographical information (e.g. loca-
tion), a collection of the entities within the tweet (e.g.
urls), and data related to the user who published it
(e.g. screen name). According to Twitter API’s docu-
mentation
12
certain attributes are expected to change
over time (e.g. retweet count) while others remain
static (e.g. status id).
1
https://developer.twitter.com/en/docs/twitter-api/v1/
data-dictionary/object-model/tweet
2
All links last accessed on March 7th, 2023
2.2 Network Derivation
Combinations of the received attributes can be used
to derive various types of networks (e.g., mention
and retweet networks). Retweet networks represent
retweet activity and retweet frequency. In a retweet
network, each message (i.e., each retweet) is rep-
resented via a separate vertex and each retweet is
connected to the original message being retweeted.
Mention networks depict interactions between users
based on the @-mentions included in their respective
tweets. The derived networks can be used for per-
forming different types of network analysis tasks (see,
e.g., Kwak et al. 2010; Xiong et al. 2019; Gruzd and
Roy 2014; Ku
ˇ
sen and Strembeck 2021).
3 APPROACH
3.1 Infrastructure
For the simultaneous collection of multiple datasets,
we created a distributed infrastructure of virtual ma-
chines (VMs) deployed in various geographical lo-
cations (see Figure 1). We created ten VMs in five
availability zones offered by Amazon Web Services
(AWS) at the time, each hosting two VMs (we will
use the term geolocation pair for referring to the vir-
tual machines running at the same geographical loca-
tion): Frankfurt (Germany), Mumbai (India), Sydney
(Australia), Seoul (South Korea), and Virginia (USA).
The selection of these five availability zones followed
the rationale of covering different geographical loca-
tions worldwide.
The collection process was coordinated by an ad-
ditional host located in Vienna (Austria) acting as the
orchestrator. Furthermore, a second host in Vienna
served as a central and permanent storage device for
the datasets collected from the five different geoloca-
tions (see Figure 1). Each collection was initiated via
the orchestrator by sending collection scripts to each
VM. The only variation in these scripts resulted from
distinct Twitter developer credentials used for the in-
dividual API calls. We set all developer accounts’ lo-
cations to correspond to the respective geolocations
of the AWS VMs to reduce potential bias. The exe-
cution time for the collection procedure was synchro-
nized within the infrastructure, meaning that all 10
VMs would begin requesting data from the Twitter
API at the same time. The individual requests were
done using the RTweet package
3
, which by default
collects a mixture of popular and most recent tweets.
3
https://cran.r-project.org/web/packages/rtweet/rtweet.
pdf
Examining the Intra-Location Differences Among Twitter Samples
95
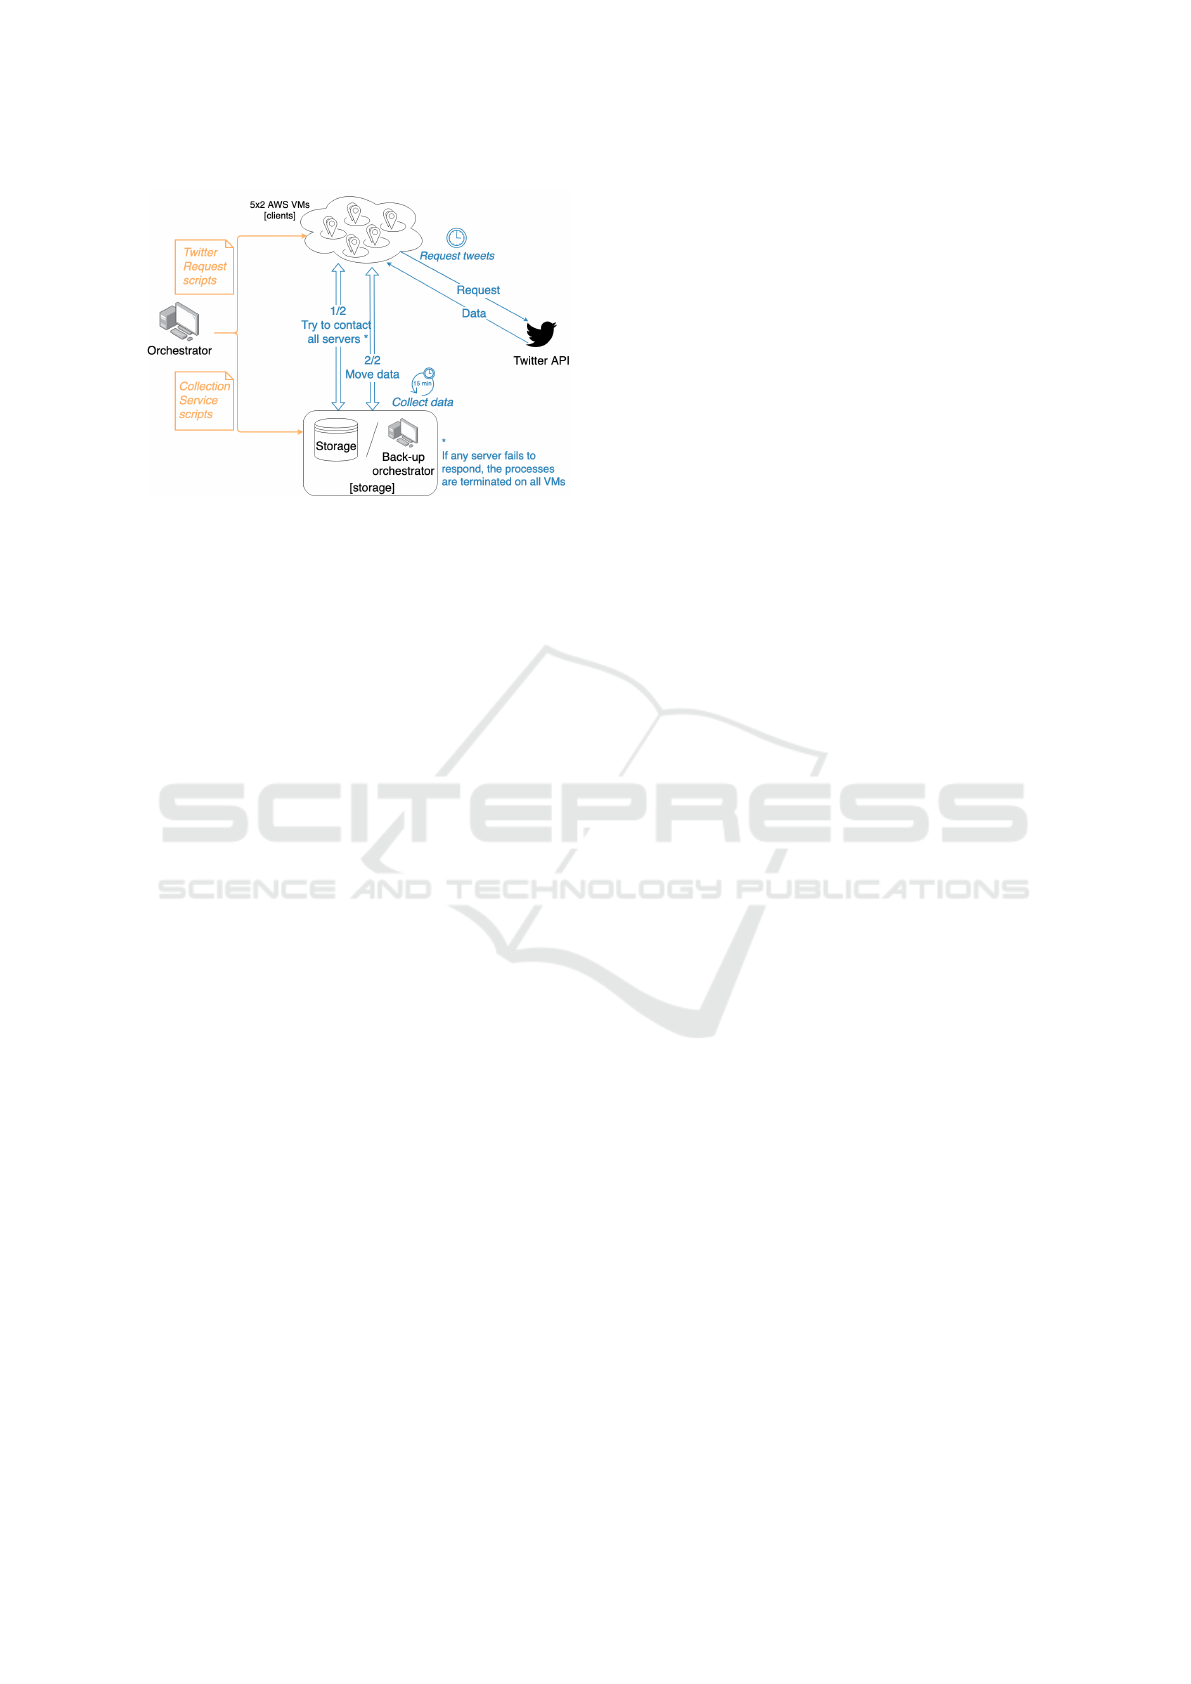
Figure 1: Infrastructure for multi-site Twitter mining;
Adapted from Ivanova et al. (2022, Figure 1).
For the purposes of this paper, we assumed two
general collection types: 1) “complete” collections
and 2) “incomplete” collections. An incomplete
dataset is a collection of Twitter messages where at
least one machine received a smaller data sample due
to some interruption (e.g. timeout, over capacity). A
complete dataset is one that includes all messages that
Twitter’s API delivers for a particular set of search pa-
rameters.
3.2 Datasets
Table 1 depicts the 14 collections that have been ex-
tracted for our study, the requested hashtags, the max-
imum number of tweets received, the tweets’ publi-
cation period, and the respective collection date. The
hashtag selection aims to cover a wide variety of glob-
ally discussed topics (e.g. pop culture, conflicts) and
dataset sizes. A detailed overview of the number of
tweets collected per VMs for each topic is presented
in Table 2. The asterisk superscript of the collection
number indicates that at least one of the data sam-
ples was interrupted and the corresponding collection
is incomplete.
4 FINDINGS
For the purposes of this paper, we analyze the data
alongside the following aspects. First, we focus on
the tweet IDs (i.e., unique tweet identifiers) in each
collection. We then examine whether the tweet at-
tributes are consistent. Finally, we explore the char-
acteristics of retweet and mention networks derived
from our collections.
4.1 Node Level
Figures 2 and 3 depict the (dis-)similarities for the 14
data collections between the pairs of Internet nodes
at each of the five geolocations in our study (Frank-
furt, Mumbai, Sydney, Seoul and Virginia). The exact
overlap (see Figure 2) refers to tweets that include the
same attributes for the same tweet ID. In contrast, the
partial overlap (see Figure 3) refers to tweets that have
the same ID but exhibit partial differences in attribute
values, such as unequal retweet counts.
The overlap values offer a clear glance into the
similarities between intra-location datasets. Yet, it
is essential to consider the effects of an incomplete
dataset. For the interrupted collection C05*, we ob-
serve a considerable drop in the exact overlap value
for all five locations. Furthermore, for the geolocation
Seoul we find an even lower value of the exact overlap
(i.e., < 1%), which occurs because Seoul 1 received
a considerably smaller dataset than Seoul 2. A rela-
tively low exact overlap can also be found across all
geolocations for C02, yet in this case all data sam-
ples are complete. However, the reason for the exact
overlap varying from 26.29% for Seoul to 93.47% for
Frankfurt remains unclear.
For the two locations without interruptions (i.e.,
Sydney and Virginia), the partial overlap is close to
100% for all collections. In some cases, such as the
interrupted collection C09* in Frankfurt, we see a
similar drop in the partial and the exact overlap per-
centages, affected by the incomplete collection for
Frankfurt 1. However, in other cases, such as C05*,
a similar correlation is noticeable despite the datasets
within the geolocation pairs being complete. The lo-
cation Seoul stands out in this regard, as we find the
most differences in terms of varying overlap values
for the individual collections, yet merely three collec-
tions have been categorized as being incomplete (i.e.,
C05, C10, and C13).
There is a noteworthy indication of a potential pat-
tern in the overlap values, which can be found across
all locations. Overall, we observe low exact-overlap
values for the eight out of 14 collections: C02, C05,
C06, C09, C11, C12, C13, C14. However, with the
exception of C02 and C06, the rest of the collections
appear to be prone to API errors.
4.2 Attribute Level
We take a closer look at the partial overlaps by ex-
amining the individual attributes of the overlapping
tweets. We match the tweets across databases based
on their tweet IDs, thus assuming it to be a constant
attribute. The frequent variation of attribute values in
COMPLEXIS 2023 - 8th International Conference on Complexity, Future Information Systems and Risk
96
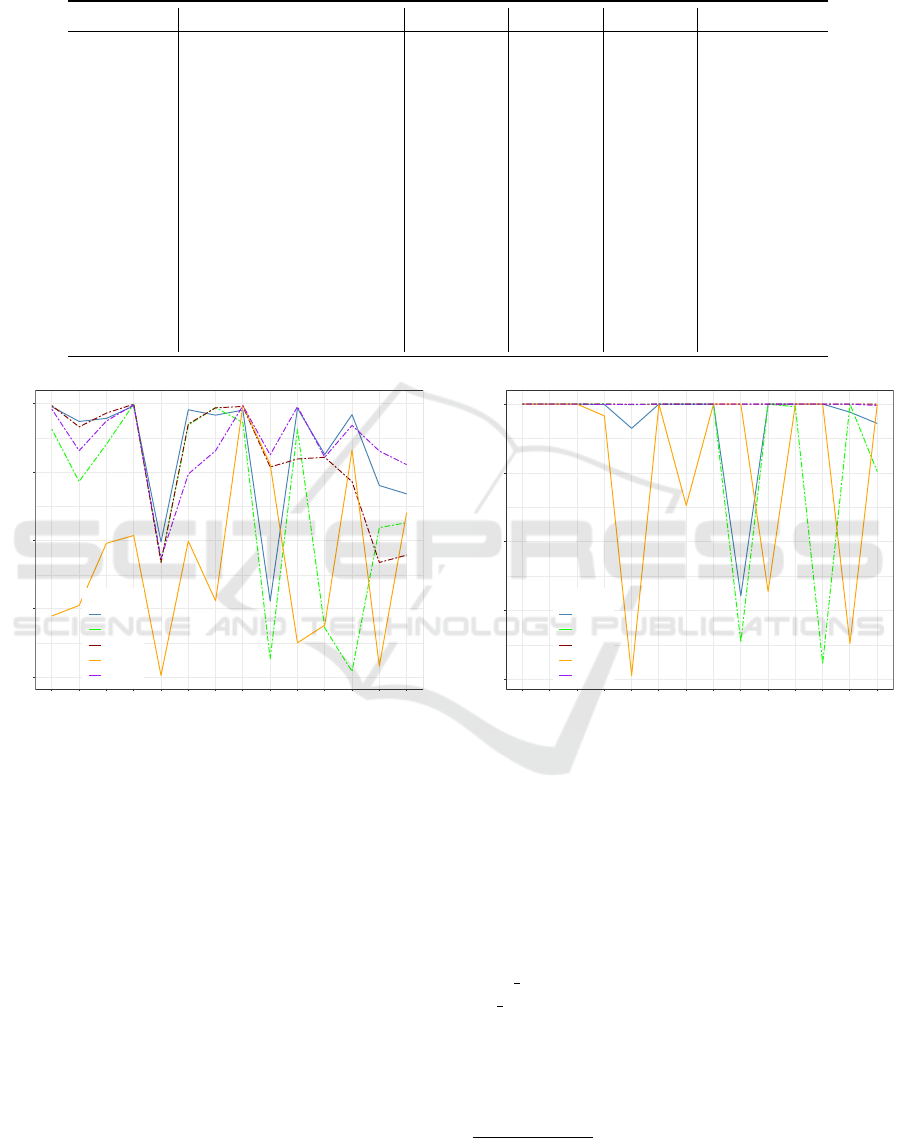
Table 1: Summary of tweet collections including the used hashtag, maximum number of tweets collected (i.e., #T), time
window for data collection, and date of collection. An asterisk denotes that the collection is incomplete. Adapted from
Ivanova et al. (2022, Table 1).
Collection Hashtag #T (max) From Until Collected on
C01 covid19 310.879 18.11.21 21.11.21 25.11.21
C02 BlackFriday 550.361 26.11.21 28.11.21 01.12.21
C03 Omicron 526.927 29.11.21 03.12.21 06.12.21
C04 HongKong 18.957 19.12.21 24.12.21 29.12.21
C05* HappyBirthdayTaehyung 2.577.930 29.12.21 01.01.22 04.01.22
C06 Djokovic 218.966 04.01.22 08.01.22 11.01.22
C07 tsunami 125.793 14.01.22 20.01.22 24.01.22
C08 Ukraine 85.641 18.01.22 22.01.22 25.01.22
C09* SuperBowl 1.826.490 13.02.22 15.02.22 20.02.22
C10* Putin 197.941 21.02.22 23.02.22 27.02.22
C11* Ukraine 436.420 21.02.22 23.02.22 25.02.22
C12* Putin 590.680 23.02.22 25.02.22 01.03.22
C13* Ukraine 1.144.923 10.03.22 13.03.22 17.03.22
C14* Ukraine 1.474.915 15.03.22 20.03.22 23.03.22
0.00 0.25 0.50 0.75 1.00
C01
C02
C03
C04
C05*
C06
C07
C08
C09*
C10*
C11*
C12*
C13*
C14*
Collections
Overlap in %
Legend
Frankfurt
Mumbai
Sydney
Seoul
Virginia
Figure 2: Exact intra-location overlap of the tweet popula-
tions per collection (i.e., identical attribute values).
tweets extracted at Seoul (as depicted by the orange
line in Figure 3) is also visible within the attribute-
level analysis. Table 3 depicts one such example of
the count-related attributes (e.g. retweet count) in col-
lection C10*. In this case, the number of differences
found between the two VMs in Seoul is considerably
higher than within the rest of the geolocations. A sim-
ilar pattern can also be found in other collections such
as collection C02 (see Table 4), which is categorized
as a complete collection.
User Object. In addition to count variables (e.g.
retweet count or like count) which are expected to
have variations over time, we also examined the con-
sistency of user-object attributes. Table 5 depicts the
difference within these attributes based on collection
0.00 0.25 0.50 0.75 1.00
C01
C02
C03
C04
C05*
C06
C07
C08
C09*
C10*
C11*
C12*
C13*
C14*
Collections
Overlap in %
Legend
Frankfurt
Mumbai
Sydney
Seoul
Virginia
Figure 3: Partial intra-location overlap of the tweet popula-
tions per collection (i.e., same tweet id, variations of other
attribute values).
C02. The column “Expected change” is based on the
official Twitter’s API documentation for the respec-
tive user-object attributes. This documentation char-
acterizes attributes as either “relatively constant” or
as expected to change frequently (over time), such
as the number of tweets the account has posted “sta-
tuses count” and its number of followers “follow-
ers count”
4
. Based on the fact that some of the at-
tributes are described as non-constant, we can safely
assume that other count values are assumed subjected
to changes over time (referred to via ”l.yes” in the re-
spective tables). The remaining attributes are marked
as “unknown”. The number of total changes for col-
4
https://developer.twitter.com/en/docs/twitter-api/v1/
data-dictionary/object-model/user
Examining the Intra-Location Differences Among Twitter Samples
97

Table 2: Number of tweets collected per location per hashtag and their respective logged messages. An asterisk denotes that
the collection is incomplete. Adapted from Ivanova et al. (2022, Table 2).
Coll. Frankfurt 1 Frankfurt 2 Mumbai 1 Mumbai 2 Sydney 1 Sydney 2 Seoul 1 Seoul 2 Virginia 1 Virginia 2
C01 310.802 310.803 310.811 310.810 310.808 310.806 310.805 310.879 310.814 310.808
C02 550.321 550.312 550.361 550.361 550.332 550.339 550.330 550.313 550.310 550.304
C03 526.804 526.811 526.803 526.804 526.813 526.815 526.927 526.830 526.809 526.812
C04 18.886 18.868 18.366 18.366 18.371 18.371 17.883
1
18.532 18.935 18.957
C05* 2.351.611 2.577.831 2.574.730 2.577.930 2.575.355 2.574.470 38.985
2
2.577.219 2.575.290 2.576.477
C06 218.831 218.827 218.841 218.842 218.841 218.842 218.965 218.966 218.858 218.836
C07 125.789 125.793 78.711
1
78.711
1
78.710
1
78.712
1
124.518 78.714
1
125.779 125.788
C08 85.640 85.637 84.406 84.406 84.409 84.412 85.622 85.622 85.640 85.641
C09* 554.498
4
1.825.922 247.731
3
1.825.615 1.825.616 1.825.577 1.826.056 1.826.146 1.826.476 1.826.490
C10* 197.909 197.910 197.937 197.941 197.939 197.932 197.939 63.356
2
197.907 197.909
C11* 436.391 436.392 436.379 432.209
2
436.401 436.409 436.420 436.399 436.409 436.409
C12* 590.543 590.548 34.577
2
590.600 590.646 590.674 590.653 590.680 590.607 590.601
C13* 1.068.768 1.100.893 1.100.851 1.100.832 1.144.885 1.144.892 1.144.923 150.033
2
1.100.894 1.100.907
C14* 1.309.517
5
1.408.257 590.046
3
445.348
3
1.381.884 1.381.923 1.382.012 1.382.025 1.467.636 1.474.915
Logged messages:
1
Two confirmations that the script exited correctly
2
Error in curl::curl fetch memory(url, handle = handle) : OpenSSL SSL read: SSL ERROR SYSCALL, errno 104
3
Error in curl::curl fetch memory(url, handle = handle) : transfer closed with outstanding read data remaining
4
Killed
5
Over capacity - 130
Table 3: Absolute number of differences in count attributes
of overlapping tweets among geolocation pairs for C10*.
Note regarding abbreviations: FRA - Frankfurt, MUM -
Mumbai, SYD - Sydney, SEL - Seoul, VA - Virginia, rt -
retweet, qt - quoted.
Attribute FRA MUM SYD SEL VI
rt followers 520 1467 4288 18944 508
qt followers 216 291 756 1893 217
favourites 69 358 1272 13659 102
statuses 62 282 1193 3104 78
rt statuses 27 96 453 1775 40
followers 25 101 350 9144 38
rt friends 22 45 116 5579 11
friends 7 34 119 6637 29
qt statuses 5 9 37 171 8
retweet 3 1 14 73 1
rt favorite 3 10 29 2158 7
rt retweet 3 1 14 71 1
listed 1 1 9 1130 14
qt favorite 1 6 42 391 1
qt retweet 2 11 65
favorite 1 39 3
qt friends 1 4 340 1
lection C02 per location and per user-object attribute
is depicted in the respective columns.
4.3 Network Level
To better understand how intra-location differences
in the collected datasets may affect network analy-
ses, we take a closer look at two selected network
types that can be derived from the collected Twit-
ter datasets. In particular, we examine retweet and
Table 4: Absolute number of differences in count attributes
of overlapping tweets among geolocation pairs for C02.
Note regarding abbreviations: FRA - Frankfurt, MUM -
Mumbai, SYD - Sydney, SEL - Seoul, VA - Virginia, rt -
retweet, qt - quoted.
Attribute FR MU SY SE VI
rt followers 1826 9002 7926 67319 29239
favourites 1200 5081 4774 39875 14940
statuses 933 2740 2709 9855 14527
rt statuses 480 1926 2125 8906 12494
qt followers 399 900 899 3506 2297
followers 143 2508 2175 27482 3373
rt favorite 89 1316 1020 13825 3344
friends 60 2061 1744 21030 1667
retweet 53 76 28 524 1006
rt retweet 53 76 28 520 1003
listed 33 279 285 2761 401
qt statuses 33 83 100 444 855
rt friends 31 2471 2025 21622 1212
qt favorite 19 84 106 713 440
favorite 1 7 8 76 17
qt retweet 1 2 6 43 41
qt friends 61 53 706 35
mention networks. For each retweet or mention net-
work, we counted the number of vertices and edges,
calculated the number of connected components, and
compared degree distributions. Degree distributions
are contrasted using empirical quantile-quantile (QQ)
plots to highlight the (dis-)similarity of the network
structures.
Retweet Networks. We constructed retweet net-
works from all datasets and compared them per lo-
COMPLEXIS 2023 - 8th International Conference on Complexity, Future Information Systems and Risk
98

Table 5: User-object attributes as per Twitter’s API documentation and their actual variation per geolocation pairs for CO2.
Note regarding abbreviations: “l.yes” refers to a logically derived yes based on the Twitter API documentation.
Attribute Expected Frankfurt Mumbai Sydney Seoul Virginia
change
id no assumed to be constant (see 4.2)
screen name yes - - - - -
location yes 1 - - - -
url unknown - - 1 7 -
description yes 1 - - - 5
verified unknown - - - - -
followers count yes 143 2508 2175 27482 3373
friends count l.yes 60 2061 1744 21030 1667
listed count l.yes 33 279 285 2761 401
favourites count l.yes 1200 5081 4774 39875 14940
statuses count yes 933 2740 2709 9855 14527
created at no - - - 200 -
profile banner url unknown - - - 1 3
profile image url https unknown - 1 - - 9
default profile unknown - - - - -
default profile image unknown - - - - -
cation in terms of their network characteristics. It is
worth noting that we observe only one perfect match
between the network characteristics across all col-
lected complete collections (see C08)
5
.
The remainder of the complete collections contain
differences in at least one of the dataset pairs. Table 6
presents one such example based on collection C07.
Here, five of the VMs (i.e., Mumbai 1, Mumbai 2,
Sydney 1, Sydney 2, and Seoul 2) have retrieved less
tweets even though Twitter’s API did not produce any
error messages. An analysis of the extracted retweet
networks shows no differences between the datasets
collected at Frankfurt and at Mumbai. In Seoul, how-
ever, we notice mismatches regarding all network de-
scriptors. For the remaining two geolocations (Syd-
ney, Virginia) the differences in the number of ver-
tices and edges are comparatively minor (i.e., < 1%).
Lastly, we found that all incomplete collections
show differences in terms of all network character-
istics for the respective geolocations. As expected,
when a collection has been interrupted we found vari-
ations in all values and a mismatch in the graphical vi-
sualisation of the degree distributions. However, fur-
ther network differences can also be observed for the
geolocations with complete datasets.
Mention Networks. In addition to the retweet net-
works, we also derived mention networks and explore
the same network characteristics (e.g., number of ver-
tices). We established the existence of the same three
groups of collections as for retweet networks: perfect
5
Details on the exact network characteristics are
available as supplemental material at https://rivanova.org/
complexis2023.
match, complete collections with variations, incom-
plete collections with variations.
4.4 Limitations
This paper builds on our previous study (Ivanova
et al., 2022) by reusing some of the datasets. When
designing our infrastructure for tweet extraction (see
Section 3), our main goal was to implement the ex-
periment as reproducible as possible, while reducing
collection bias. The variety in the geographical loca-
tions was achieved via the use of a commercial cloud
platform (i.e., Amazon Web Services). We selected
five of AWS availability zones to maximize diversity
and global distribution (i.e., as many continents as
possible). We assume that the setup behind the in-
dividual VMs is equivalent (i.e., we assume AWS is
running comparable hardware at different locations),
yet further comparative research is needed in order to
conclude whether the use of another hosting platform
may yield different results. Furthermore, we used an
iterative collection approach. In particular, we col-
lected 200 messages every 10 seconds. Another op-
tion would be to request larger batches of tweets us-
ing longer time intervals. Investigating these sources
of possible variation is future work.
5 CONCLUSIONS
In this paper, we analyzed 14 Twitter data samples
collected simultaneously from five pairs of virtual
machines (VMs) running at five different geographi-
cal and network-topological locations (i.e., Frankfurt,
Mumbai, Sydney, Seoul and Virginia). We found vari-
Examining the Intra-Location Differences Among Twitter Samples
99

Table 6: Comparison of number of vertices, number of edges, number of connected components and degree distributions of
retweet networks per geolocation pair (two virtual machines) for C07 (i.e., a complete collection with differences).
Virtual |V| |E| Connected Degree distributions
machine Components
Frankfurt 1 124.704 118.296 6.408
Frankfurt 2 124.704 118.296 6.408
Mumbai 1
1
78.221 72.995 5.226
Mumbai 2
1
78.221 72.995 5.226
Sydney 1
1
78.220 72.994 5.226
Sydney 2
1
78.221 72.995 5.226
Seoul 1 123.464 117.067 6.397
Seoul 2
1
78.220 72.994 5.226
Virginia 1 124.696 118.288 6.408
Virginia 2 124.706 118.298 6.408
1
Two confirmations that the collection script exited correctly, yet less tweets
ations among the data samples from the pairs running
at the same geolocation. These differences manifest
in terms of the collected tweet IDs, tweet attribute val-
ues, and the characteristics of the derived networks.
In addition, we split the collections into two
groups – complete collections that contain all tweets
provided via Twitter’s API, and incomplete col-
lections that stopped prematurely by Twitter’s API
throwing an error message.
Our findings show that complete collections tend
to have a similar number of received tweets varia-
tions regarding the exact tweets (matched based on
their tweet IDs) that have been collected. The over-
lap between the tweets has an observed range from
63.21% to 100% with a median of 99.97%. For in-
complete collections, we confirmed that the result-
ing collections exhibited considerable differences in
terms of number of collected tweets. In this case, the
fractions of overlapping tweet IDs ranged from 1.51%
to 99.98% with a median of 13.56%.
When looking at the attributes of the collected
tweets, we found that count attributes, such as retweet
count, may be different regardless of whether the col-
lection was complete or incomplete. While Twitter’s
API documentation states that count attributes are ex-
pected to change over time, we found that there are no
consistency guarantees when retrieving datasets even
in a synchronized manner.
For our analysis, we also created retweet and men-
tion networks from the collected datasets. Upon ex-
amining the networks’ characteristics, we observed
variations for complete and incomplete collection.
Within the complete collections, we discovered exact
intra-location matches for only one collection. For
COMPLEXIS 2023 - 8th International Conference on Complexity, Future Information Systems and Risk
100

the remaining six collections, we found rather small,
yet noticeable variations in the number of vertices,
number of edges, number of connected components,
and the degree distribution. As expected, all incom-
plete collections showed differences in terms of net-
work characteristics. However, we also found smaller
network-level differences regarding certain network
characteristics for some complete collections.
Based on our study, we derive the following rec-
ommendations for researchers using Twitter’s free-
of-charge API. First, the status codes and error mes-
sages issued by Twitter’s API must be handled and
documented properly in order to avoid incomplete
data samples. Second, we suggest researchers to be
cautious when relying on attribute values which are
expected to change in time and in space, such as
count attributes (e.g. retweet count or like count). In
addition, our previous research on (dis-)similarities
between individual geolocations (see Ivanova et al.
2022) recommended the use of three or more geolo-
cations for accessing the Twitter API in parallel, and
the use of a three-day delay.
REFERENCES
Boutyline, A. and Willer, R. (2017). The social struc-
ture of political echo chambers: Variation in ideologi-
cal homophily in online networks. Political Psychology,
38(3):551–569.
Broniatowski, D. A., Jamison, A. M., Qi, S., AlKulaib,
L., Chen, T., Benton, A., Quinn, S. C., and Dredze, M.
(2018). Weaponized health communication: Twitter bots
and Russian trolls amplify the vaccine debate. American
Journal of Public Health, 108(10):1378–1384.
Campan, A., Atnafu, T., Truta, T. M., and Nolan, J. (2018).
Is data collection through Twitter streaming API useful
for academic research? In Proc. IEEE International
Conference on Big Data, pages 3638–3643. IEEE.
Grinberg, N., Joseph, K., Friedland, L., Swire-Thompson,
B., and Lazer, D. (2019). Fake news on Twitter during the
2016 US presidential election. Science, 363(6425):374–
378.
Gruzd, A. and Roy, J. (2014). Investigating political po-
larization on Twitter: A Canadian perspective. Policy &
Internet, 6(1):28–45.
Ivanova, R. V., Sobernig, S., and Strembeck, M. (2022).
Does geographical location have an impact on data sam-
ples extracted from Twitter? In Proc. 9th International
Conference on Social Networks Analysis, Management
and Security (SNAMS) (in press). IEEE.
Kim, Y., Nordgren, R., and Emery, S. (2020). The story
of Goldilocks and three Twitter’s APIs: A pilot study
on Twitter data sources and disclosure. International
Journal of Environmental Research and Public Health,
17(3):864.
Ku
ˇ
sen, E. and Strembeck, M. (2021). Building blocks of
communication networks in times of crises: Emotion-
exchange motifs. Computers in Human Behavior, 123.
Kwak, H., Lee, C., Park, H., and Moon, S. (2010). What
is Twitter, a social network or a news media? In Proc.
19th International Conference on World Wide Web, pages
591–600. ACM.
Morone, F. and Makse, H. A. (2015). Influence maximiza-
tion in complex networks through optimal percolation.
Nature, 524(7563):65–68.
Morstatter, F., Pfeffer, J., Liu, H., and Carley, K. M. (2013).
Is the sample good enough? comparing data from twit-
ter’s streaming API with twitter’s firehose. In Kiciman,
E., Ellison, N. B., Hogan, B., Resnick, P., and Soboroff,
I., editors, Proc. International AAAI Conference on Web
and Social Media, pages 400–408. The AAAI Press.
Pfeffer, J., Mayer, K., and Morstatter, F. (2018). Tampering
with Twitter’s sample API. EPJ Data Science, 7(1):50.
Pfeffer, J., Mooseder, A., Hammer, L., Stritzel, O., and Gar-
cia, D. (2022). This sample seems to be good enough!
assessing coverage and temporal reliability of Twitter’s
academic API. CoRR, abs/2204.02290.
Timoneda, J. C. (2018). Where in the world is my tweet:
Detecting irregular removal patterns on Twitter. PloS
one, 13(9).
Wang, Y., Callan, J., and Zheng, B. (2015). Should we
use the sample? analyzing datasets sampled from twit-
ter’s stream api. ACM Transactions on the Web (TWEB),
9(3):1–23.
Xiong, Y., Cho, M., and Boatwright, B. (2019). Hashtag
activism and message frames among social movement
organizations: Semantic network analysis and thematic
analysis of Twitter during the #MeToo movement. Pub-
lic Relations Review, 45(1):10–23.
Examining the Intra-Location Differences Among Twitter Samples
101
