
ASMS: A Metrics Suite to Measure Adaptive Strategies of
Self-Adaptive Systems
Koen Kraaijveld
1
and Claudia Raibulet
1,2 a
1
Vrije Universiteit Amsterdam, Computer Science Department, De Beolelaan 1111, 1081HV, Amsterdam, The Netherlands
2
University of Milano-Bicocca, DISCo-Dip. di Informatica, Sistemistica e Comunicazione, Viale Sarca 336, Milan, Italy
Keywords:
Self-Adaptive System, Evaluation, Software Metrics, Adaptive Strategy, Architecture-based Self-Adaptation.
Abstract:
In the last two decades, research in Self-Adaptive Systems (SAS) has proposed various approaches for induc-
ing a software system with the ability to change itself at runtime in terms of self-adaptation strategies. For the
wider adoption of these strategies, there is a need for a framework and tool support to enable their analysis,
evaluation, comparison, and eventually their selection in overlapping cases. In this paper, we take a step in
this direction by proposing a comprehensive metric suite, i.e., the Adaptive Strategies Metric Suite (ASMS), to
measure the design and runtime properties of the adaptive strategies for SAS. ASMS consists of metrics that
can be applied through both static and dynamic code analysis. The metrics pertaining to static code analysis
have been implemented as a plugin for Understand tool.
1 INTRODUCTION
Self-adaptive systems (SAS) have represented an ac-
tive research in the past twenty years, with the overall
goal to make systems more robust to runtime faults
and threats, as well as to optimize their performances
while running (Cheng et al., 2009). Several adapta-
tion strategies have been proposed following different
paradigms, e.g., search-based, optimization, control-
theory, architecture-based (Krupitzer et al., 2015).
Despite this progress, it is still a challenge to eval-
uate whether an adaptation strategy brings the ex-
pected benefits that outweigh the costs of designing
and implementing it (Gerostathopoulos et al., 2022),
(Raibulet et al., 2017). For the same reason, it is
hard to compare strategies based on their design and
runtime properties. Having a framework that guides
such evaluation and comparison is important for the
maturity of the field and in particular for the indus-
trial adoption of the proposed self-adaptation strate-
gies (Masciadri and Raibulet, 2009).
With the overall goal of providing a framework for
the evaluation and comparison of adaptation strate-
gies, in this paper we focus on measuring their de-
sign and runtime properties after they they have been
implemented. Our approach can be seen as comple-
mentary to the top-down evaluation approaches that
a
https://orcid.org/0000-0002-7194-3159
measure e.g., how well a strategy satisfies an adap-
tation goal (e.g., minimize response time). Our ap-
proach also acknowledges that adaptive strategies are
software programs and can be analyzed for their qual-
ity using proven techniques for software evaluation.
This paper focuses on producing high-level com-
putable metrics targeted towards adaptive strategies.
Metrics capture a particular design or runtime prop-
erty. The research question (RQ) this paper centers
around asks:
In what meaningful ways can we measure the
design and runtime properties of the adaptive
strategies belonging to a SAS?
Towards answering this RQ, we propose the
Adaptive Strategies Metric Suite (ASMS): a compre-
hensive metrics suite that measures different design
and runtime features of a SAS adaptive strategies.
ASMS blends static and dynamic code analysis ap-
proaches that are split into 5 categories, each of which
focuses on a particular facet of an adaptive strategy’s
operation. Each ASMS metric is supported by a con-
crete formulae or method for their computation.
Our approach to ASMS leverages several different
methodologies. First, we conduct a case study analy-
sis of various SAS that implement one or more adap-
tive strategies. In order to limit the scope of which
case studies have been examined, we have specifically
chosen systems programmed in the smart mobility ap-
238
Kraaijveld, K. and Raibulet, C.
ASMS: A Metrics Suite to Measure Adaptive Strategies of Self-Adaptive Systems.
DOI: 10.5220/0011992800003464
In Proceedings of the 18th International Conference on Evaluation of Novel Approaches to Software Engineering (ENASE 2023), pages 238-249
ISBN: 978-989-758-647-7; ISSN: 2184-4895
Copyright
c
2023 by SCITEPRESS – Science and Technology Publications, Lda. Under CC license (CC BY-NC-ND 4.0)

plication domain. Second, observations made from
the case studies are used in the design of the metric
suite. Third, these metrics are implemented into a
plugin
1
designed for the static code analysis tool Un-
derstand, provided by Scientific Toolworks.
For the purposes of this paper, we focus on sys-
tems that employ architecture-based self-adaptation.
The architecture of SAS consists of two components:
managing system and managed system (Weyns et al.,
2010). The managing system decides which adaptive
changes need to be executed to achieve adaptation. It
does this by adapting them into the controllable man-
aged system, which then in turn effects these changes
into the surrounding, non-controllable environment.
To decide the changes to be performed, the managing
system uses a MAPE-K feedback loop that consists
of four steps: Monitor, Analyze, Plan and Execute,
which operate on a pool of shared Knowledge (Gar-
lan et al., 2009), (Weyns and Iftikhar, 2019).
The paper is structured as follows. Section 2 in-
troduces the examined case studies and their self-
adaptation. Section 3 covers the guidelines and con-
straints under which the metrics have been designed.
Section 4 presents the metric suite by explaining its
design. Section 5 covers the key parts behind the
implementation of the plugin. Section 6 outlines the
evaluation of the plugin by presenting and discussing
its results after being applied to an exemplar. Section
7 discusses the current and future developments of
ASMS. Related work is addressed in Section 8. Sec-
tion 9 summarizes the conclusions and future work.
2 CASE STUDIES
Various case studies have been examined to explore
which design and runtime properties occur frequently
in the adaptive strategies of several SAS. They have
been analyzed on the basis of their code (through the
Understand tool) and their respective papers. In par-
ticular, we have considered the following SAS (pre-
sented in alphabetical order):
• ATRP (Automated Traffic Routing Problem)
(Wuttke et al., 2012) presents a traffic routing sim-
ulator that enables the evaluation and comparison
of different self-adaptive methods that try to solve
the automated traffic routing problem. Several ve-
hicles traverse across a map and try to reach a
target destination given a starting point. During
their travel, they may be restricted by complica-
tions such speed limits or traffic accidents. Adap-
tivity is related to how vehicles can deal with these
1
ASMS-https://github.com/Koen-Kraaijveld/ASMS
imposed restrictions to reliably reach their desti-
nation in a minimal amount of time.
• Dragonfly (Maia et al., 2019) focuses on the self-
adaptive behaviour of drones. Specifically, it is
centered around how a drone can reliably reach its
destination when under pressure from limited re-
sources and environmental hazards. This includes
factors such as monitoring battery life or analyz-
ing safe locations where the drone may potentially
land. Adaptivity is related to how a drone maxi-
mizes reliability in response to travel issues.
• TRAPP (Traffic Reconfigurations via Adaptive
Participatory Planning) (Gerostathopoulos and
Pournaras, 2019) is focused on the optimization
of a city’s traffic flow. As ATRP, it provides a de-
centralized approach for vehicles that must each
make decisions on how to best navigate a city.
Adaptivity is related to how an individual vehi-
cle can optimize itself to improve upon different
factors, such as trip travel times.
2.1 Self-Adaptation Details
Table 1 provides details of each case study in rela-
tion to their self-adaptation details by highlighting the
main steps from MAPE-K loops.
Table 1: Case Study Self-Adaptation Details.
Exemplar
Main steps of the MAPE-K loop
Monitor Analyze Plan Execute
ATRP Traffic
status
Resource
con-
sump-
tion
Quality
of
service
(perfor-
mance,
depend-
ability,
safety)
Adaptive
changes
in
planned
routes
Adapted
navigation
Dragonfly Remain-
ing
battery
life
Distance
to desti-
nation
Single
reference
values
Predefi-
ned
adaptive
changes
Flying
direction
TRAPP Traffic
status
Street
utiliza-
tion
Trip
travel
times
Quality
of
service
(perfor-
mance,
depend-
ability,
safety)
Adaptive
strategy
parameter
tuning
Adapted
naviga-
tion
Adaptive
plan-
ning
fre-
quency
ASMS: A Metrics Suite to Measure Adaptive Strategies of Self-Adaptive Systems
239

2.2 Observations and Considerations
Several key observations can be made when examin-
ing how exemplars execute their adaptive strategies.
Small vs. Large Impact. Executing certain adap-
tive strategies may result in more behavioural changes
in the system over other strategies, or may require a
larger degree of computational effort from the sys-
tem. Carrying out a low-impact strategy would not
need, for example, to spend a significant amount of
resources on adapting the managed system, or would
result in minimal changes in the system’s behaviour.
By contrast, the execution of a high impact strategy
may, for example, need to analyze greater amounts of
sensor data before formulating a plan, or the strategy
may need to perform significantly more changes in
the managed system to achieve the adaptation goals.
In this sense, impact is observed as the repercussions
imposed on the system during the execution of an
adaptive strategy.
Sequential vs. Concurrent. If any two adap-
tive strategies do not interfere with each other, they
may be executed concurrently. However, when a
clash arises between the two, they are performed se-
quentially. The conflicts that threaten the possibility
for concurrent execution between two strategies may
stem from various factors, e.g.,. incompatible depen-
dencies on certain system states, or resource costs that
exceed what a system can feasibly handle altogether.
Dependent vs. Independent. Dependencies between
two adaptive strategies form when one depends on
the functionality of the other. In the case studies
where this notion applies, adaptive strategies would
be programmed as classes, from which another strat-
egy could use inheritance to assume some of the func-
tionality given by other strategies. By contrast, strate-
gies that do not inherit from others do not form any
dependencies and can be considered as independent.
Dependencies on Time. Several properties related
to adaptive strategies can be observed over time, e.g.,
how often an adaptive strategy needs to be performed
(e.g., frequent vs. infrequent) or the preferred range
of strategies that a system tends to execute over a
given period of time.
3 METRIC DESIGN GUIDELINES
Before going into detail on the design behind ASMS,
we discuss preliminary information that shows un-
der which circumstances the metrics have been con-
structed. We do this by outlining the requirements
behind the metrics, the role that static and dynamic
code analysis plays, and the application of subtypes.
3.1 Requirements
Each of the proposed metrics in this work should sat-
isfy the following requirements (Rawat et al., 2012),
(Reinecke et al., 2010):
Comparability. The metric suite should enable the
comparison between any two or more given self-
adaptive systems. It should be able to express the ex-
istence of an equality relation between these systems.
Validity. The metric suite should clearly measure
what it is intended to measure.
Robustness. The computational output of the metric
should not be vulnerable to being significantly altered
when small changes are implemented into the system
that the metric running on.
Computational Efficiency. The metric calculation
should not result in high resource costs or take a sig-
nificant amount of time to process.
3.2 Static vs. Dynamic Code Analysis
To capture relevant design and runtime properties, we
present a metrics suite that blends static and dynamic
code analysis. The type of analysis used defines the
resources and tools at a metric’s disposal with which
it can compute its output. Each type presents several
advantages and disadvantages, which we now outline.
Static Code Analysis is useful when measuring var-
ious design properties. This type of analysis is per-
formed without the execution of the source code,
meaning that the extracted data can only come from
the scripting language files themselves (Hande and
Rao, 2017). One of its main advantages is the ex-
haustive analysis of code.
The first advantage that we focus on when using
static code analysis is its ability to examine the struc-
tural elements of a codebase. The static approach of-
fers various resources to aid in this, such as control-
flow and data-flow analysis, which are useful when
trying to understand how the components of a system
are composed (Kritzinger, 2017). These resources
may take into account the entirety of a system’s code-
base, whereas dynamic analysis can only analyze the
code it is executing. The second advantage is that
it can also provide generalized information on how
code fragments behaves, e.g., count its number of ex-
ecutable statements (Gomes et al., 2009). The ASMS
metrics exploit the benefits of both these advantages.
Dynamic Code Analysis is useful when examin-
ing the runtime properties of a system. Contrary to
static analysis, the dynamic analysis is possible dur-
ing the execution of code, which means that measur-
ing the features of a system is performed in a runtime
environment (Gomes et al., 2009). The main bene-
ENASE 2023 - 18th International Conference on Evaluation of Novel Approaches to Software Engineering
240
fit of this type of analysis is being able to use re-
sources such as memory snapshots and runtime API
data, which enables a deeper and more accurate study
of how the system operates (Hande and Rao, 2017).
However, a disadvantage is the non-deterministic na-
ture of sequential code executions. There is no guar-
antee that the results produced by dynamic code anal-
ysis will be the same for all future executions (Gomes
et al., 2009). The metrics we devise using dynamic
analysis focus on the properties of adaptive strategies
that can only be measured reliably during runtime.
3.3 Subtypes
For a subset of the our metrics, we split them into
subtypes that represent slight variations on the general
method used to calculate their outputs. This is done
in an effort to foster additional customizability and
extendability to future developments of metrics.
4 ASMS
We now present the metrics and how they operate.
They are divided into 5 categories, each focusing on
a design or runtime property. The categories are Lo-
cality, Concentration of Impact, Elementarity, Main-
tainbility and Time-related.
4.1 Locality Metrics
The metrics in Locality category, i.e., Impact Radius
and Concurrency Capacity, are designed to measure
the impact-related properties of an individual strategy.
4.1.1 Impact Radius
This metric calculates the computational effort re-
quired by the system when an adaptive strategy will
be executed. We do this by counting the total num-
ber of executable statements that the system will pro-
cess. Using executable statements over other types of
statements to quantify impact is preferred because ex-
ecutable statements may include behavioural changes
in the system since it requires the processing of an ac-
tion (Pollack and Cytron, 2003). Counting the num-
ber of executable statements for a given code frag-
ment is a process that can be done without code exe-
cution, therefore this metrics needs static analysis.
The main source that the Impact Radius uses to
compute its output is the call graph of an adaptive
strategy. In the codebase of a system, if a given strat-
egy is programmed as a function, we traverse each
node in its call graph and then sum up the number
of executable statements. In cases where the strategy
is programmed as a class, we perform the same op-
eration, but instead applied to each of the strategy’s
methods and summing up their outputs instead.
We differentiate the metric’s calculation based on
two subtypes: Local and Global. When counting the
number of executable statements in the call graph of a
given strategy, the Local Impact Radius (LIR) is inter-
ested in nodes that are directly connected to the root
node (i.e., the strategy the metric is running on). The
Global Impact Radius (GIR) is interested in all the
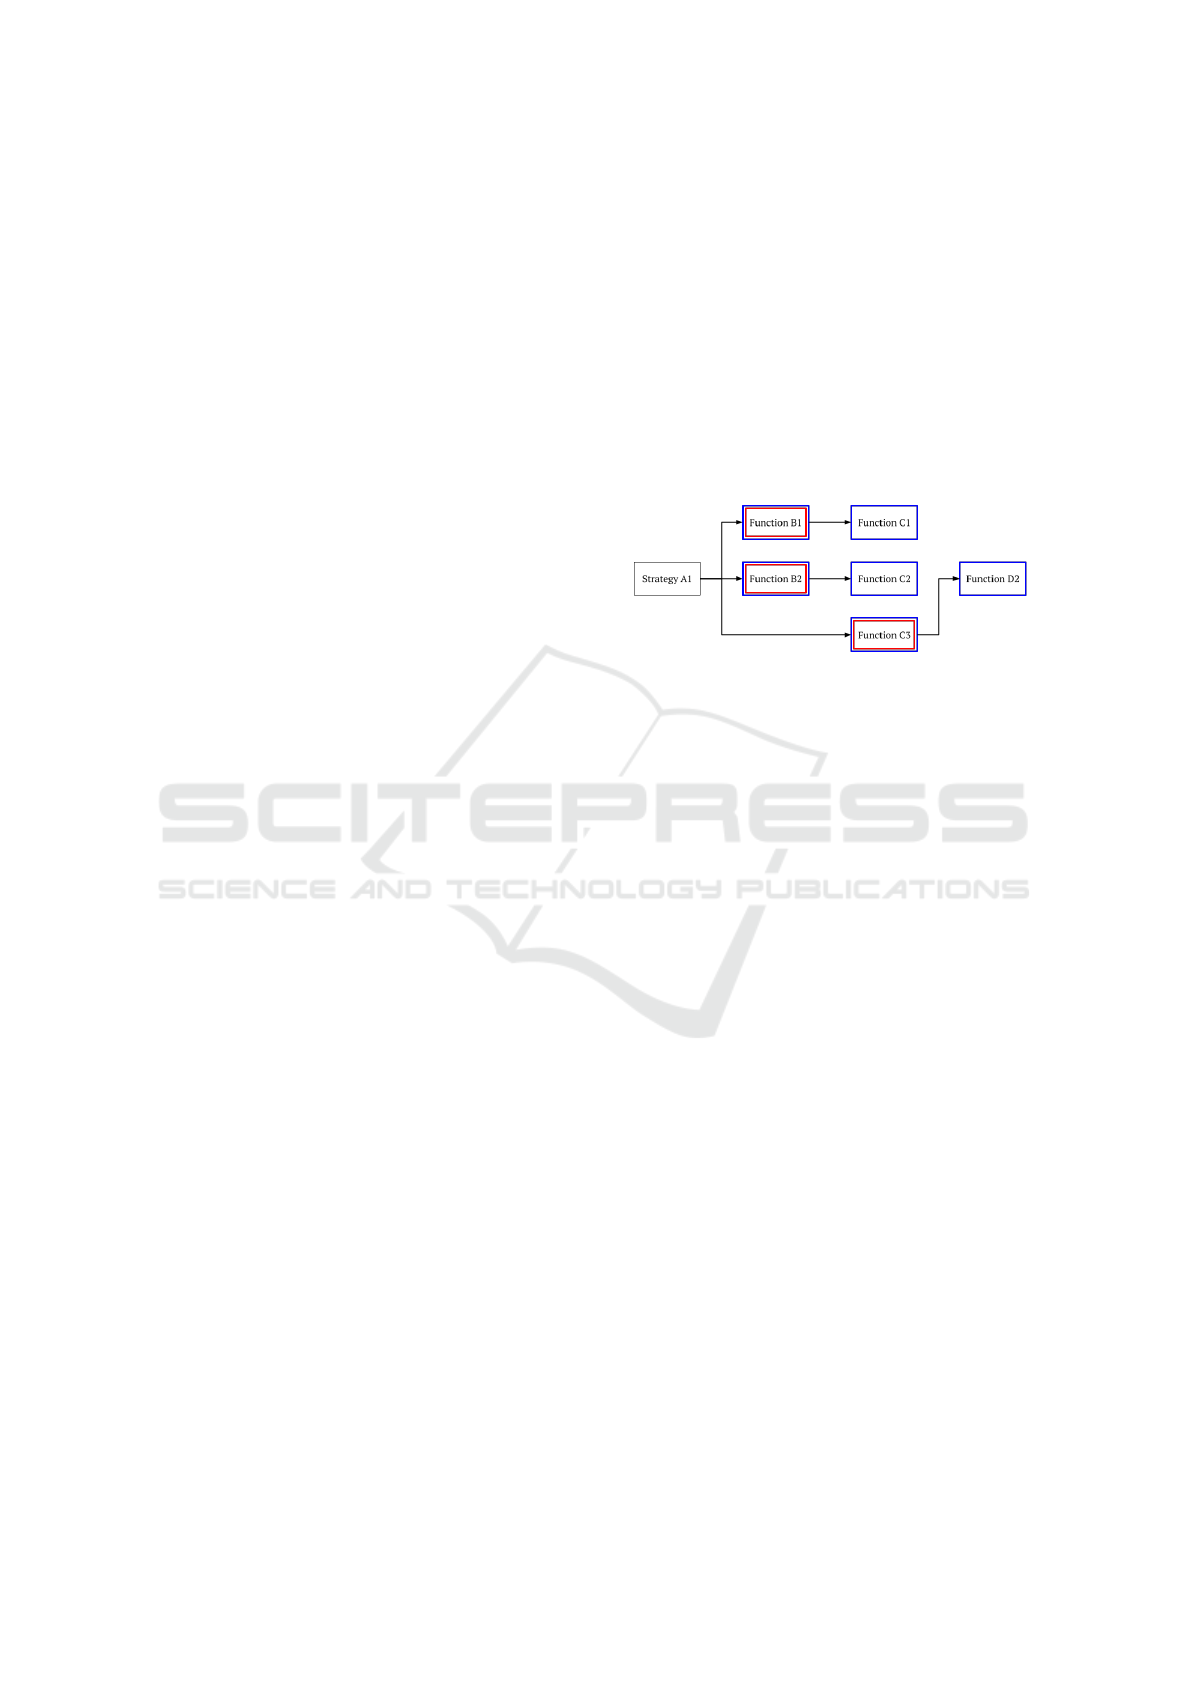
nodes of a strategy’s call graph. Fig. 1 shows the
distinction between these subtypes using a call graph.
Figure 1: Diagram showing a call graph, starting from an
adaptive strategy called Strategy A1. The red color denotes
all the methods that are locally reachable, while the blue
color denotes all the methods that are globally reachable.
In more formal terms, the general formula used
to derive the Impact Radius and its subtypes is as fol-
lows. Let E(m) return the number of executable state-
ments belonging to a function f and let L( f ) return
the set of methods that are directly connected to a
function f in its call graph. Then, the Local Impact
Radius (LIR) of a strategy s can be defined as:
LIR(s) = E(s) +
∑
f ∈L(s)
E( f ) (1)
By contrast, the Global Impact Radius (GIR) can
be defined as follows. Let G( f ) return the set of func-
tions in which a path can be formed from f to any
other function in the call graph of f . Then, the GIR
of a strategy s can be defined as:
GIR(s) = E(s) +
∑
f ∈G(s)
E( f ) (2)
4.1.2 Concurrency Capacity
This metric measures the extent to which adaptive
strategies may be performed concurrently. Since this
is a task that can best be measured during execution,
this metric is designed for dynamic analysis. We de-
fine the metric using two subtypes: Index and Ratio.
The Concurrency Capacity Index (CCI) computes
the number of adaptive strategies in a set of strategies
that can be performed concurrently with others. It can
be defined as the following. Let C(s, S) be a function
ASMS: A Metrics Suite to Measure Adaptive Strategies of Self-Adaptive Systems
241

that returns true if an individual input strategy s can
be performed concurrently with any other strategy in
the set of adaptive strategies S. Then, for a given set
of adaptive strategies S, we have.
CCI(S) = | {s | C(s, S), ∀s ∈ S} | (3)
The Concurrency Capacity Ratio (CCR) com-
putes the ratio of the number of adaptive strategies
that can be performed concurrently, over the total
number of available strategies. It is defined as the fol-
lowing. For a set of adaptive strategies S, we have:
CCR(S) =
| {s | C(s, S), ∀s ∈ S} |
| S |
(4)
4.2 Concentration of Impact Metrics
The Concentration of Impact metrics make use of el-
ements from the Impact Radius, but differ in that they
are designed to measure impact-related properties in
a group of adaptive strategies, rather than individual
ones. In particular, these included the Global Impact
Radius Distribution (GIRD) and Global Impact Ra-
dius Statistics (GIRS).
4.2.1 Global Impact Radius Distribution
This metric takes advantage of the Impact Radius
metric by computing the GIR of each adaptive strat-
egy. Using this information, it is possible to produce a
distribution used to compare the impact of each strat-
egy. For a set of adaptive strategies that belong to a
system, each value in the distribution corresponds to a
strategy in the set. The value is calculated as the ratio
of an adaptive strategy’s GIR to the summed total of
each adaptive strategy’s GIR in the set.
In more formal terms, we define the GIRD as the
following. We first define a function R(s, S) that cal-
culates the ratio of the GIR of an adaptive strategy s
to the total GIR of all adaptive strategies in the set S.
This is written as:
R(s, S) =
GIR(s)
∑
s
′
∈S
GIR(s
′
)
(5)
Then, for the set of adaptive strategies S on which
the metric will run, we have:
GIRD(S) = {R(s, S) | ∀s ∈ S} (6)
4.2.2 Global Impact Radius Statistics
By performing statistical analysis on the GIRD, we
can obtain more insights into how adaptive strategies
relate to each other in regards to their impact. This is
what the GIRS metric tries to do by computing several
statistics on the distribution from the GIRD metric.
The metric consists of five subtypes, each corre-
sponding to commonly calculated statistics. They are
defined as follows:
• Maximum. This metric subtype returns the adap-
tive strategy which has the largest GIRD value.
This can be defined as the following, where the
function R is established in (5).
GIRS
max
(S) =
s∈S
R(s, S) (7)
• Minimum. By contrast, this metric subtype re-
turns the adaptive strategy which has the smallest
value in the GIRD. We define it as the following:
GIRS
min
(S) =
s∈S
R(s, S) (8)
• Mean. This metric subtype may be expressed
through following formula, where S is a set of
adaptive strategies:
GIRS
mean
(S) =
∑
r∈GIRD(S)
r
| GIRD(S) |
(9)
• Median. This metric subtype may defined through
following formula, where S is a set of adaptive
strategies and n is the number of elements in the
set GIRD(S). If n is odd, then:
GIRS
med,odd
(S) = GIRD(S)
n+1
2
(10)
If n is even, then we have:
GIRS
med,even
(S) =
GIRD(S)
n
2
+ GIRD(S)
n
2
+1
2
(11)
• Standard Deviation. Lastly, with regards to the
Standard Deviation subtypes, its calculation is
based on the sample standard deviation. It may
be defined as the following for a set of adaptive
strategies S:
GIRS
std
(S) =
s
∑
r∈GIRD(S)
(r − GIRS
mean
(S))
2
| GIRD(S) | −1
(12)
4.3 Elementarity Metrics
The metrics in the Elementarity category follow the
idea of measuring how elementary an adaptive strat-
egy is relative to others in the system. This is done by
computing the dependencies between strategies, i.e.,
the Dependency Degree.
ENASE 2023 - 18th International Conference on Evaluation of Novel Approaches to Software Engineering
242
4.3.1 Dependency Degree
In this metric, we can measure the dependencies
that form between the adaptive strategies of a sys-
tem. We define a dependency as any strategy that
assumes the functionality of another through means
such as class inheritance. Since we detect dependen-
cies through data-flow analysis, this metric is imple-
mented in static code analysis.
Using this notion, it is possible to construct a tree
where each node represents an adaptive strategy in
a system. Edges connecting any two nodes indicate
a dependency between the strategies associated with
those nodes. Parent nodes show which strategies a
given strategy depend on, while child nodes show
which strategies a given strategy are depended on by.
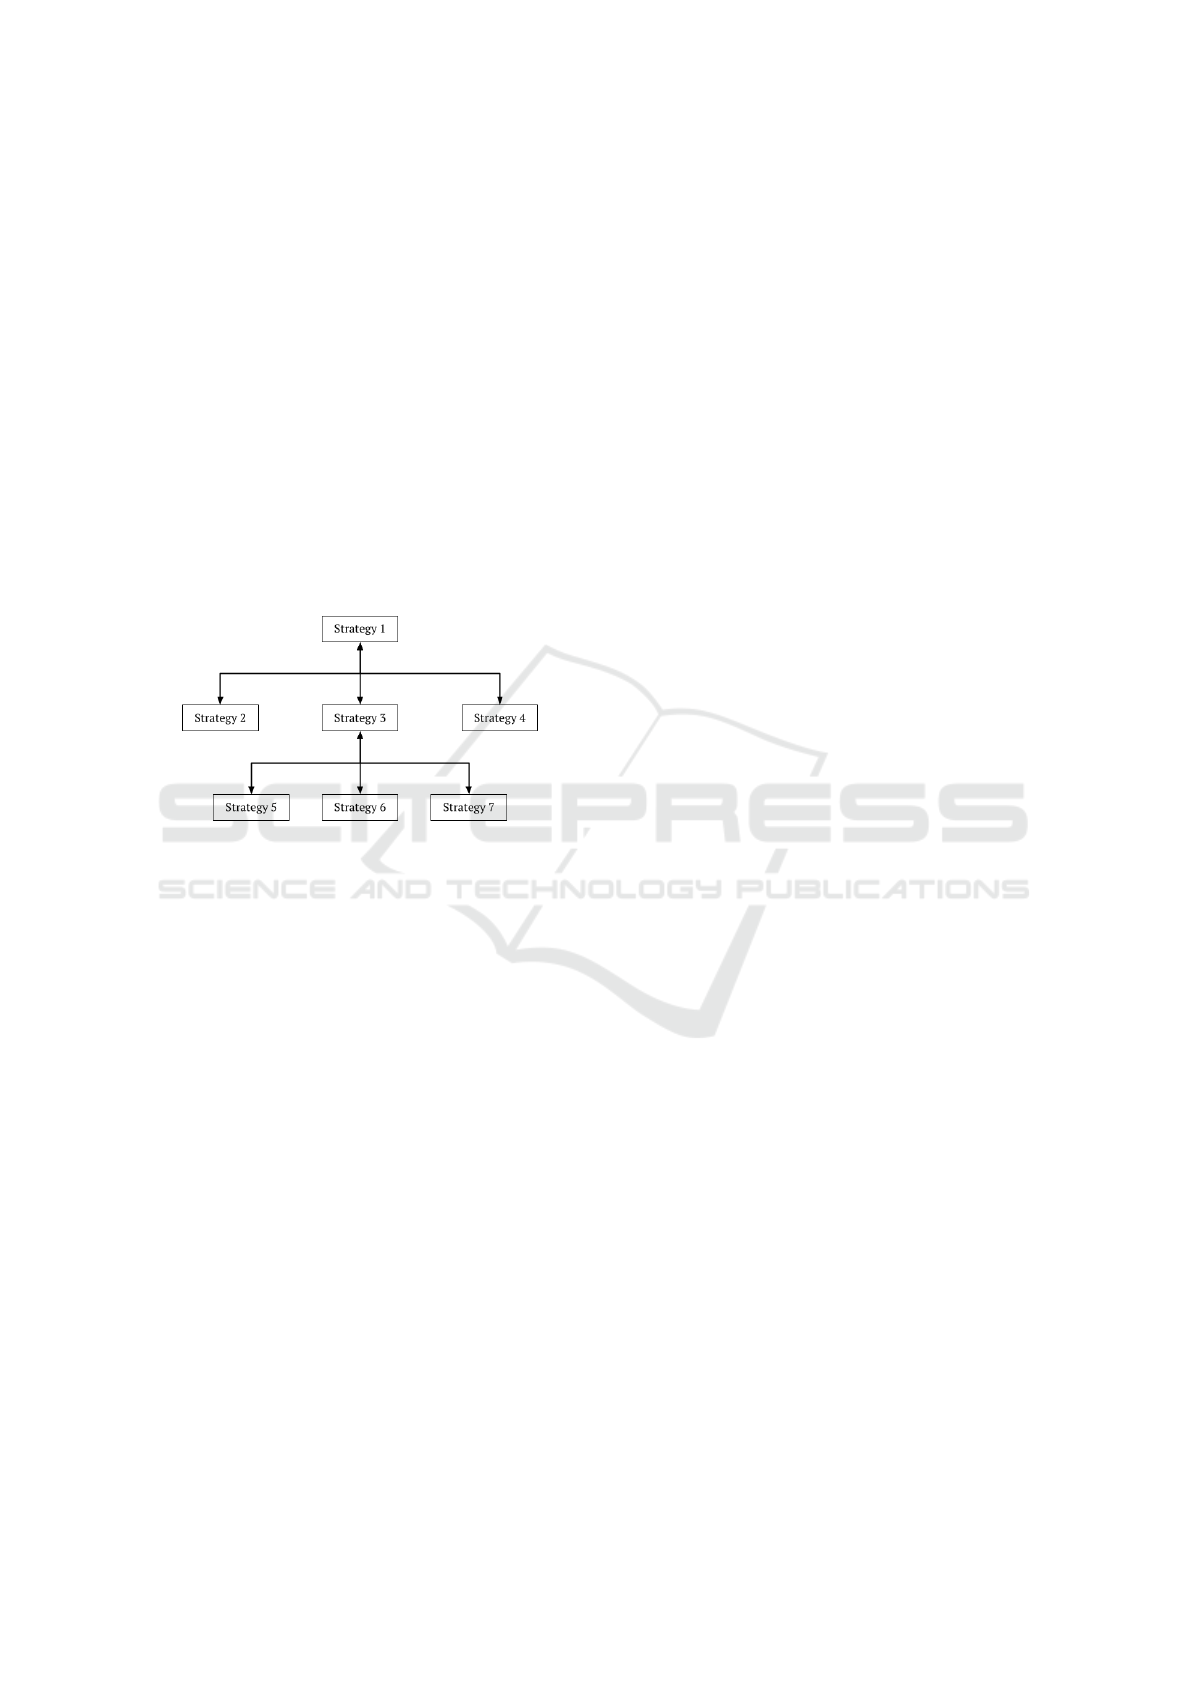
Fig. 2 shows such a tree for an example set of adap-
tive strategies belonging to a SAS.
Figure 2: A tree visualization of the Dependency Degree
metric from an example set of adaptive strategies.
There are two subtypes that the Dependency De-
gree metric consists of, which are named Bottom-up
and Top-down. Both of these base their calculation
on the constructed tree. For a given input adaptive
strategy that corresponds to a node in the tree, the
Bottom-up Dependency Degree subtype counts the to-
tal number of edges it takes to reach the root from the
given node. This output represents the total number
of strategies that the given strategy depends on. The
Top-down Dependency Degree subtype calculates its
total number of child nodes. This output represents
the total number of strategies that a given strategy is
depended on by.
To illustrate this with greater clarity, we give an
example that uses the tree in Fig. 2. Lets calcu-
late both Dependency Degree subtypes for Strategy 1.
We can see that the node for Strategy 1 has six child
nodes, which means that it is depended on by six other
strategies. This would be the output for the Top-down
Dependency Degree subtype. Oppositely, Strategy 1
has no parent node (being the root) and would depend
on zero strategies, so the output for the Bottom-up
Dependency Degree subtype would be zero.
4.4 Maintainability Metrics
The Maintainability metrics are designed to measure
the properties pertaining to the complexity and mod-
ifiability of an adaptive strategy. They leverage sev-
eral established metrics often employed in static code
analysis (Turetken, 2013): Complexity and Modifia-
bility metrics.
4.4.1 Complexity
This metric measures the complexity of an adaptive
strategy in relation to its control-flow; it does this by
calculating its Cyclomatic Complexity. It consists of
two subtypes: Cyclomatic (CC) and Strict Cyclomatic
(SCC). Since these metrics can be measured using
control-flow analysis, this metric is implemented in
static code analysis.
The CC metric, which corresponds to the first sub-
type, counts the number of linearly independent paths
through the control flow graph of a code (McCabe,
1976). It treats conditional statements as a singu-
lar branching path that contributes to the final sum.
By contrast, the second subtype (SCC) performs the
same calculation, but treats the variables involved in
the conditional’s boolean expression as their own in-
dependent paths. The code below shows an example
of a basic if-else statement. The CC of this code is 1,
while its SCC is 3.
Begin
if (a AND b OR c) {
...
}
End.
4.4.2 Modifiability
The Modifiability metric measures the extent to which
the adaptive strategies can be changed to ensure mini-
mal conflicts occur with other components of the sys-
tem. In particular, we focus on how well the adaptive
strategy is connected internally and externally. These
include calculations based on two subtypes: the Class
Coupling (CCM) and the Lack of Cohesion (LCOM).
Since these metrics focus on structural properties of
strategies, they are implemented using static analysis.
The LCOM subtype on the other hand, calcu-
lates how an adaptive strategy is internally connected.
Given an adaptive strategy that is implemented in the
code as a class, LCOM calculates the percentage of
the average number of the strategy’s instance vari-
ables that are not used by any of that strategy’s meth-
ods. The formula for this metric is as follows.
Let I(c) return the set of instance variables be-
longing to a class c and let M(c) return the set of
ASMS: A Metrics Suite to Measure Adaptive Strategies of Self-Adaptive Systems
243

methods that belong to a class c. Let Uses(c, i) re-
turn the set of all methods belonging to a class c and
that use an instance variable i belonging to c. Then,
for a class c, we have,
LCOM(c) = 100 · (1 −
∑
i∈I(c)
|Uses(c,i)|
|M(c)|
| I(c) |
) (13)
4.5 Time-Related Metrics
The Time-related metrics involve measuring the prop-
erties of an adaptive strategy with respect to time.
These metrics are the Frequency, Volatility Ratio, Av-
erage Duration, and Uptime. They all require the use
of dynamic code analysis due to their focus on time.
1) Frequency (F) is designed to calculate how
many times an adaptive strategy is executed in a sys-
tem over a period of time. In this instance, the metric
treats the ‘execution’ of an adaptive strategy as any
strategy that has started executing or is currently be-
ing executed over a specified time period. Since a
strategy may take a significant amount of time to per-
form fully, it does not have to finish its execution in
order for it to be counted in the metric. The general
calculation for this metric takes as input a time period
t and can be expressed through the following.
F(t) =
Number of strategies executed during t
t
(14)
2) Volatility Ratio (VR) is designed to calculate
how many unique adaptive strategies are executed
over a specified period of time. It can show if a system
relies mostly on a small or large number of strategies,
depending on the value of t.
The metric takes as input a time period t and can
be expressed through the following.
V R(t) =
Number of unique strategies executed during t
Total number of available strategies
(15)
3) Average Duration (AD) is designed to calculate
the average amount of time that adaptive strategies are
being performed over a period of time. This includes
the time from when a strategy starts executing to when
it has finished executing.
The way a strategy may be executed depends on
the system. For example, it may be carried instantly,
for a period of time or for the lifetime of the system
(Cheng et al., 2009). The AD metric can help illus-
trate what a system looks like in this regard. It can be
expressed using the following formula.
Let S be the set of adaptive strategies executed
over the course of a time period t. Let D(s) return
the duration of the execution of an adaptive strategy
s. Then, for an input time period of t, we have,
AD(t) =
∑
s∈S
D(s)
| S |
(16)
4) Adaptation Uptime (AU) is designed to calcu-
late how much time a system spends on performing
adaptive strategies over a period of time. The met-
ric can show how much a system relies on its adaptive
strategies. It can be expressed using the following for-
mula using an input time period of t.
AU(t) =
Time spent executing strategies during t
t
(17)
5 IMPLEMENTATION
We now cover the relevant details to the Understand
tool as well as some of the details behind the plugin
that implements the designed metrics from Section 4.
5.1 The Understand Tool and Its API
Understand, developed by Scientific Toolworks, is a
static code analysis tool that allows users to analyze
their code through source code comprehension, graph
visualizations, and software metrics. It supports up
to 12 different programming languages, e.g., Java,
Python and C/C++. It boasts a comprehensive and
easy to use API that allows users to implement their
own metrics, graphs and code style scripts.
5.2 Understand API: Relevant Details
Understand offers several ways for users to program
their own scripts that take advantage of its API. Our
implemented plugin uses the Interactive Reports (IRe-
port) feature because it provides an accessible and in-
tuitive means to display information. When executing
an IReport, Understand renders a UI box containing
data based on the plugin script, which can be pre-
sented in various formats. An IReport can also be
programmed through many languages, with the most
comprehensive API languages being Perl and Python.
For each, Understand uses a simplified compiler and
a different file format.
5.3 Understand vs. Other Tools
The other considered candidate for the development
of the plugin was SonarQube. This is a program that
ENASE 2023 - 18th International Conference on Evaluation of Novel Approaches to Software Engineering
244
is capable of competing with Understand in its func-
tionality and provides a rich library of plugins to draw
from. It is also a program that has already been used
in other studies related to SAS (Raibulet et al., 2020).
However, Understand was chosen due to its enhanced
data visualizations, expansive software metrics and
broad, yet accessible options offered by the API.
5.4 Technical Details of the Plugin
The plugin has been implemented in Python. While
this decision has been made in part due to its familiar-
ity, it also proved to be the more stable choice over
Perl, with development suffering from less crashes
and technical issues. As mentioned previously, the
plugin has been implemented using Understand’s
IReport feature. This is due to its simplicity and com-
prehensiveness, as it enables quickly getting started
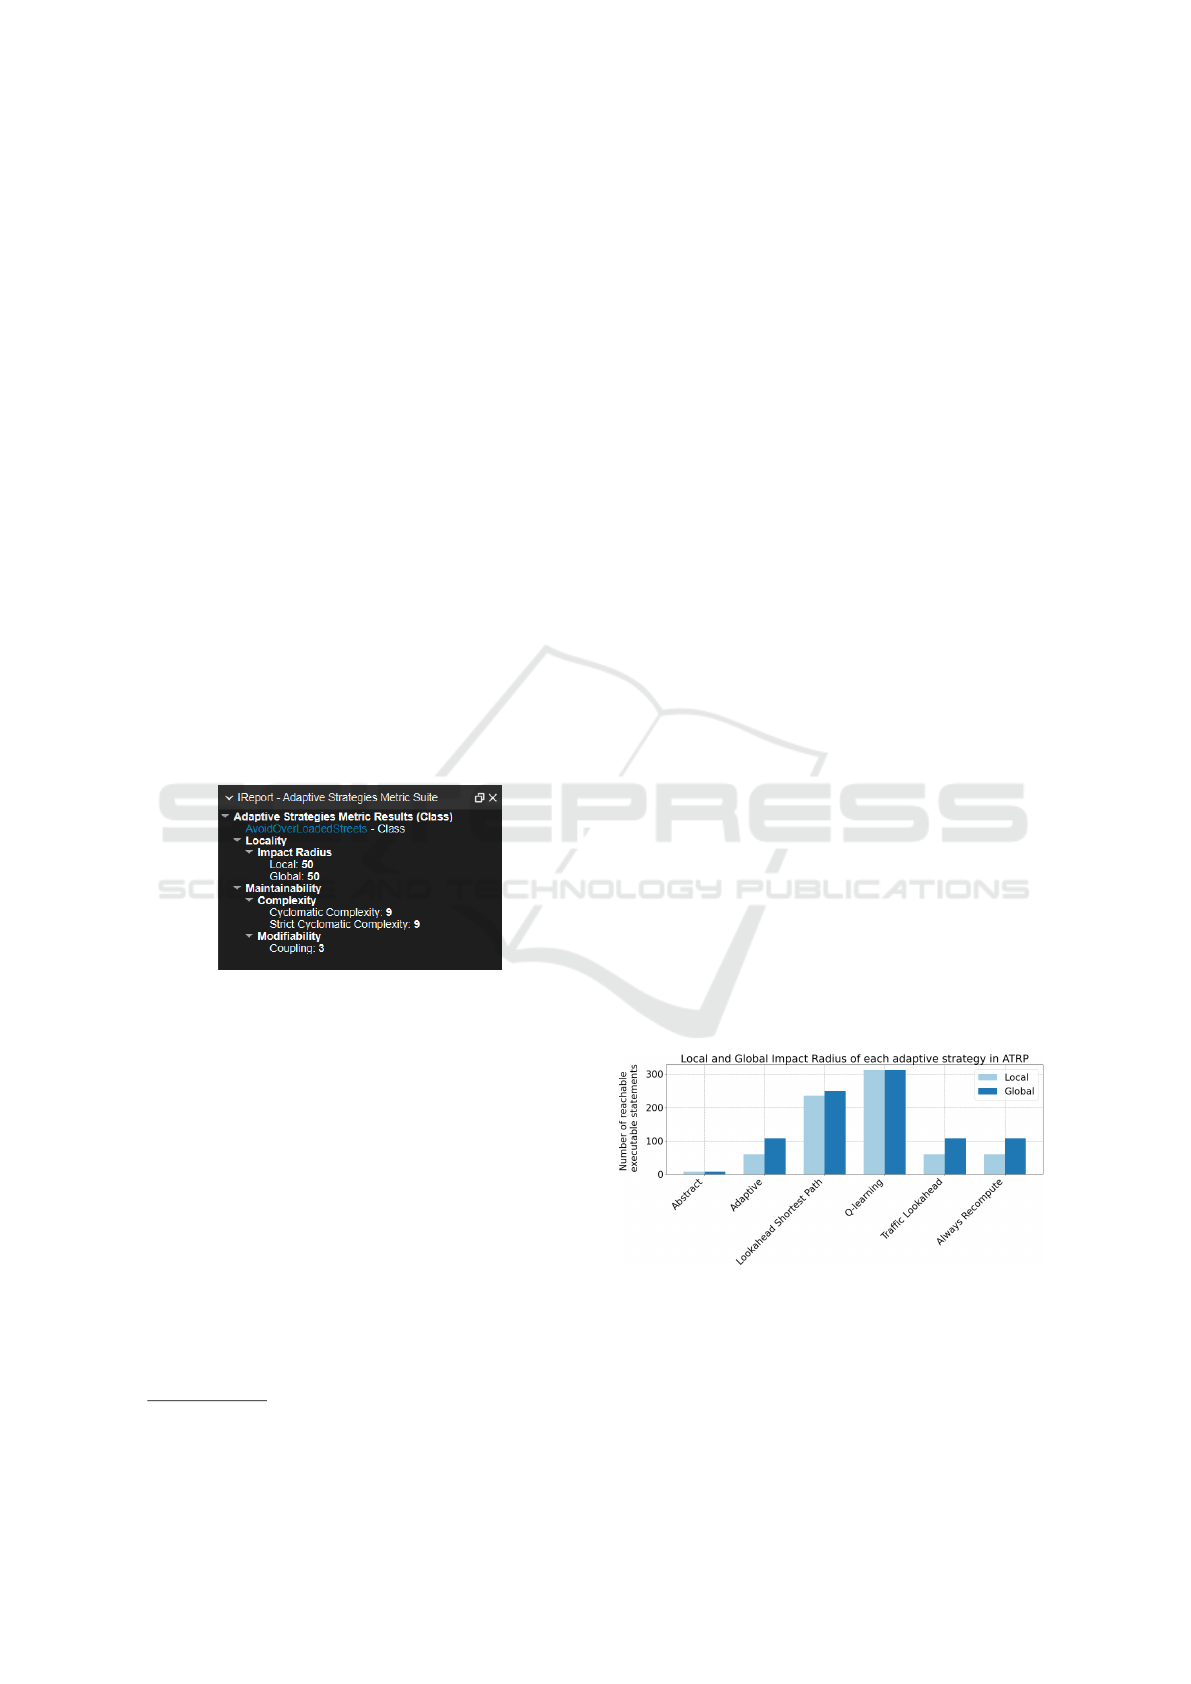
with development. Fig. 3 shows the output that
Understand produces when running the plugin on an
adaptive strategy from the TRAPP exemplar. This
particular output only generates the results that apply
to metrics designed for an individual adaptive strat-
egy. The code for the plugin and the instructions on
how to run it are available at the GitHub repository
2
.
Figure 3: TRAPP exemplar: metric results when running
the pugin on an adaptive strategy.
6 EVALUATION
We now focus on the evaluation of the metrics suite
by applying them to an exemplar, thereby giving a
grounded understanding in the value and limitations
that the metrics can offer. We first delineate the setup
for the evaluation and then move on the to its results.
6.1 Setup
The exemplar that has been selected to evaluate on is
ATRP. The adaptive strategies of ATRP are all pro-
grammed in Java and are implemented as classes.
2
ASMS repository: https://github.com/
Koen-Kraaijveld/ASMS
These strategies are named as follows: Abstract,
Adaptive, Lookahead Shortest Path, Q-learning, Traf-
fic Lookahead, Always Recompute.
In ATRP, the strategies represent the options that
the cars have in navigating the city to reach their des-
tination. These incorporate self-adaptation to tell the
managed system on how to respond to incoming en-
vironmental and internal changes at runtime, such as
traffic accidents or congestion.
The justification for why ATRP has been picked
to evaluate on is because it uses the largest number
of adaptive strategies from the examined case studies.
Additionally, all strategies in ATRP are programmed
as classes, which allows metrics that need to run on
classes to be included in the evaluation. These reasons
allow the evaluation to cover a diverse set of scenar-
ios in which the metrics can operate, which can then
highlight of their potential value and limitations.
The evaluation is based on the following metrics
designed for static code analysis that are implemented
in the plugin for the Understand tool. They include
all their respective subtypes and will be presented in
the following order: Impact Radius (Locality), Global
Impact Radius Distribution and Statistics (Concentra-
tion of Impact), Dependency Degree (Elementarity),
and Complexity and Modifiability (Maintainability).
The following sections present the results from
each of these listed metrics when applied to the adap-
tive strategies of the ATRP exemplar.
6.2 Locality Metric Results
6.2.1 Impact Radius Results
This experiment applies the Local and Global Impact
Radius to ATRP using the methods discussed in Sec-
tion 4.1. The results are shown in Fig. 4.
Figure 4: Double bar chart for the Local and Global Impact
Radius of each adaptive strategy in ATRP, with the num-
ber of reachable executable statements on the y-axis and the
adaptive strategies on the x-axis.
From Fig. 4, it is clear that the Q-learning strat-
egy is able to reach the most executable statements,
followed by Lookahead Shortest Path. This tells us
ASMS: A Metrics Suite to Measure Adaptive Strategies of Self-Adaptive Systems
245
that both of these have the greatest potential to effect
change in the system. Other outstanding properties
may be observed in the discrepancies between the LIR
and GIR of an adaptive strategy. For example, Adap-
tive (among others) has a clear difference between the
number of executable statements that may be reached
locally versus globally. This indicates that the strat-
egy has a much greater impact on the more distant
parts of the system. By contrast, Q-learning has no
difference between its LIR and GIR, which means its
impact is restricted to the parts of the system that are
closely associated with it.
6.3 Concentration of Impact Metric
Results
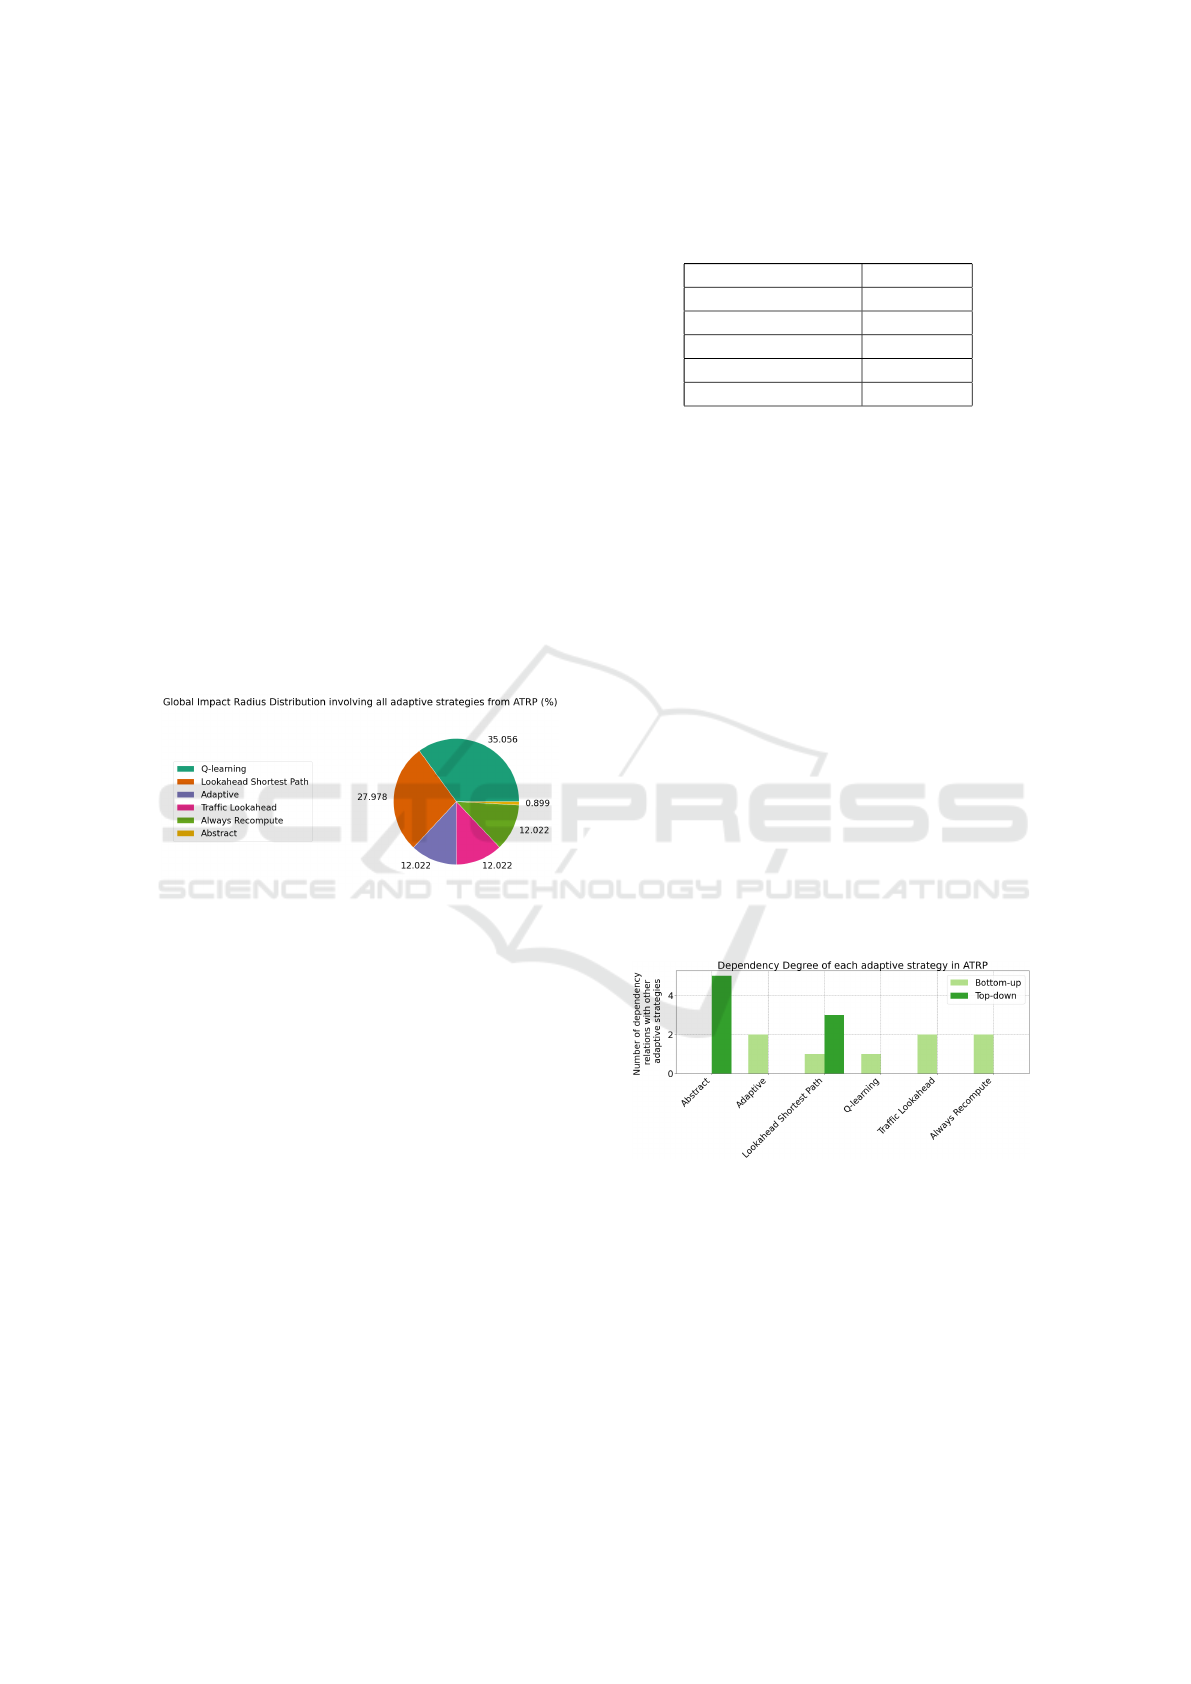
6.3.1 Global Impact Radius Distribution
This experiment applies the GIRD metric to ATRP
using the methods discussed in Section 4.2. Results
are shown as a pie chart in Fig. 5.
Figure 5: Pie chart showing the results from Global Impact
Radius Distribution metric involving all adaptive strategies
in ATRP, expressed as a percentage.
In contrast to the Locality metrics, this approach
can provide an alternate view on how much impact an
adaptive strategy has on a system relative to others.
However, many of the same observations made in the
section above apply here as well.
6.3.2 Global Impact Radius Statistics
The usefulness of the GIRD metric can be exempli-
fied in how we can use it to calculate statistics, which
is provided by the GIRS metric. This includes statis-
tics that show the adaptive strategy with the maximum
and minimum GIR, as well as the mean, median and
standard deviation of the GIRD. Table 2 shows the
outputs for this metric.
From this table, we can see how GIRS provides
some unique interpretations to the GIRD’s data. First,
it can concretely give the adaptive strategy that has
the maximum or minimum GIR through the first two
statistics. Second, the Mean and Median subtypes
Table 2: Global Impact Radius Statistics of ATRP, includ-
ing the Maximum, Minimum, Mean, Median and Standard
Deviation subtypes.
GIRS Subtype ATRP
Maximum Q-learning
Minimum Abstract
Mean 0.17
Median 0.12
Standard Deviation 0.12
can show around which values the GIRD of the adap-
tive strategies tend to exist. The difference between
these two values is also particularly useful in getting
an idea of how the strategies are distributed in regards
to their GIR, since the Mean may be greatly affected
by extreme values, while the Median is not. Third, it
can show how spread out the GIR are of the adaptive
strategies. If this statistic is high, it may point to the
existence of one or more adaptive strategies that can
reach significantly more executable statements rela-
tive to the other strategies in the system.
6.4 Elementarity Metrics Results
6.4.1 Dependency Degree Results
This experiment applies the Dependency Degree met-
ric to ATRP using the methods discussed in Section
4.3. Fig. 6 shows the results for this metric. From
these results, we can see that Abstract is depended on
by most of the strategies, while several others depend
on none. On the other hand, few strategies depend on
the most of the other strategies.
Figure 6: Double bar chart showing the Top-down and
Bottom-up subtypes when applied to ATRP, with the num-
ber of dependency relations a given adaptive strategy has on
the y-axis and the adaptive strategies on the x-axis.
There are a number of properties implied by this
data. First, since Abstract depends on zero strategies,
while being depended on by 5 (i.e., all other strate-
gies), it indicates that it has influence over all other
strategies in the set. Since each strategy in this set is a
class, this means that each extends functionality from
Abstract through inheritance. Second, every strategy
that is depended on by zero others, but does depends
ENASE 2023 - 18th International Conference on Evaluation of Novel Approaches to Software Engineering
246
on at least one, constitutes a strategy that is not inher-
ited from. These two notions are reflected in Fig. 7,
which shows the tree representation of all the depen-
dency relations between each of the adaptive strate-
gies. The strategy that is depended on by all others,
but does not depend on any, forms the root of the tree.
The strategy that is not depended on by any, but does
depend on at least one forms a leaf in the tree.
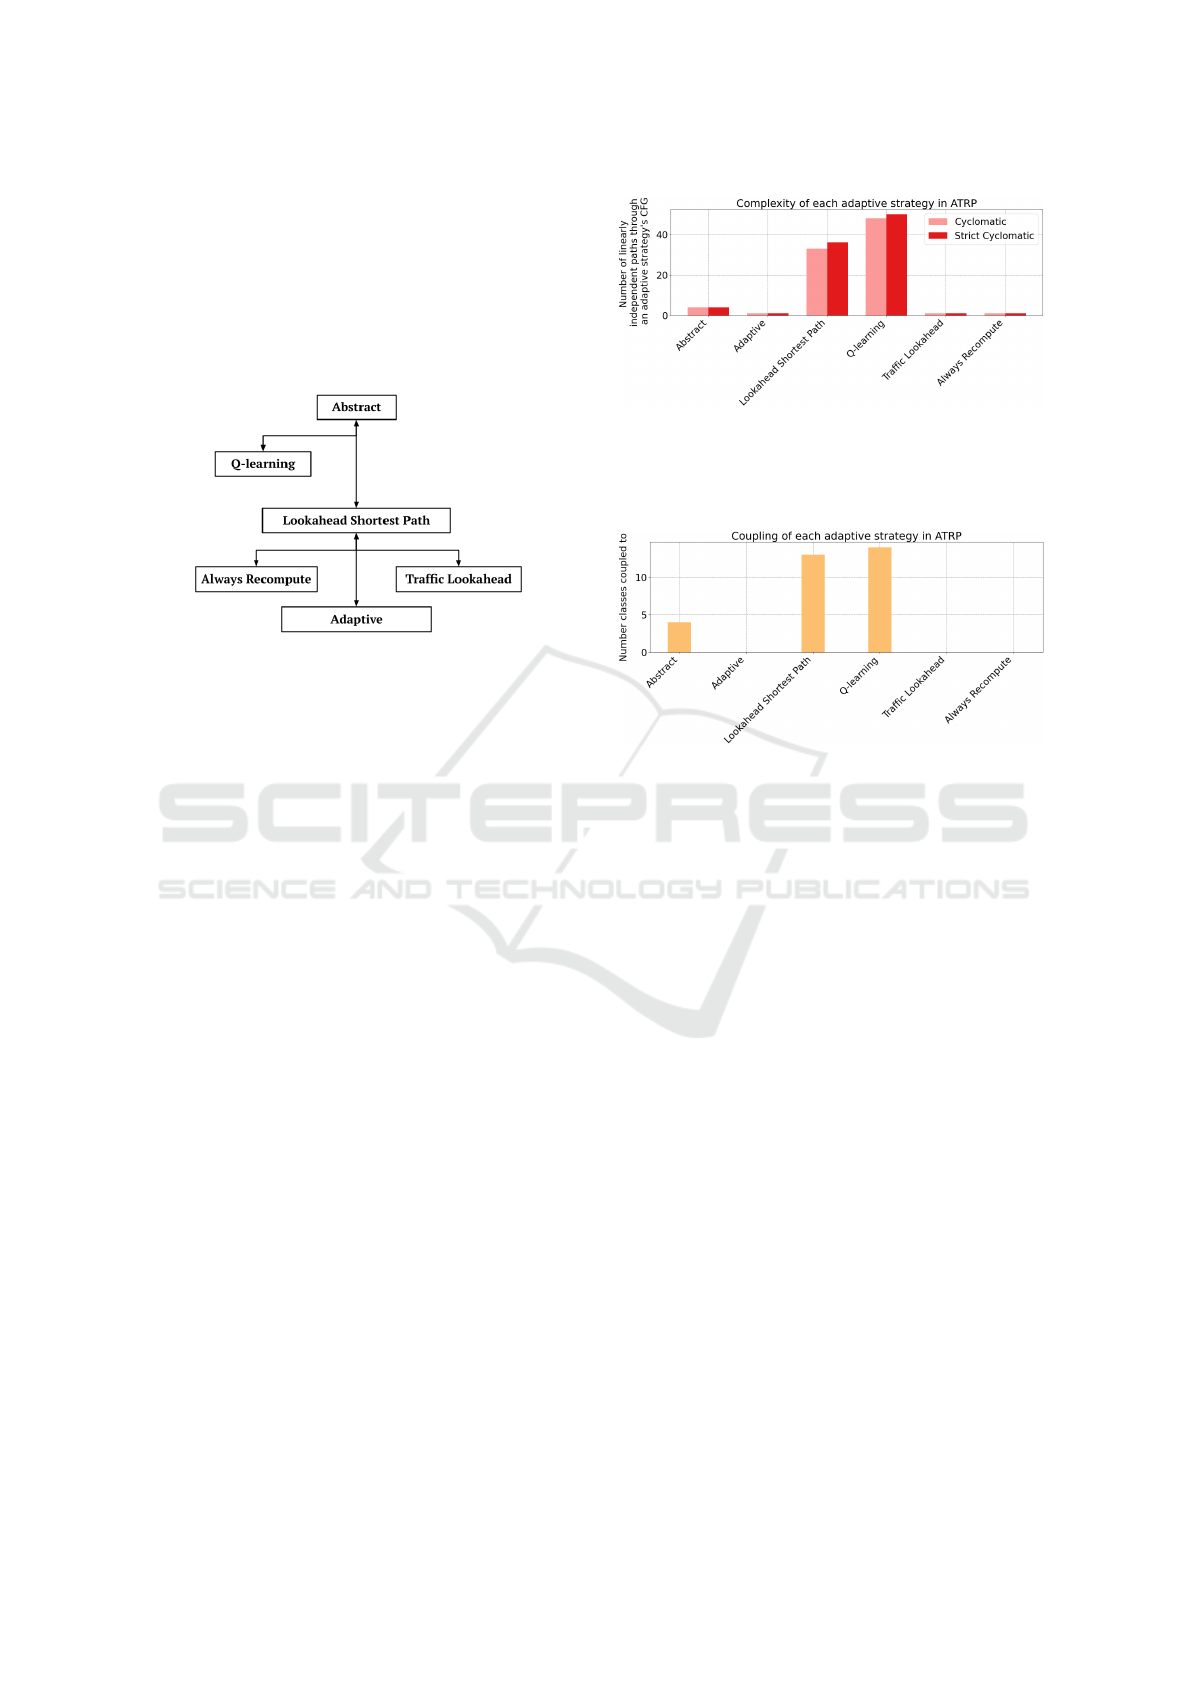
Figure 7: The Dependency Degree tree of the ATRP adap-
tive strategies, with parent nodes representing the strategy
a given strategy depends and child nodes representing the
strategies a given strategy are depended on by.
6.5 Maintainbility Results
6.5.1 Complexity
This experiment applies the Complexity metric to
ATRP using the methods discussed in Section 4.4 (see
Fig. 8). From Fig. 8, it is clear that Q-learning and
Lookahead Shortest Path are the most complex out of
all the adaptive strategies. One indication that this ob-
servation provides is that these strategies will require
significantly more effort to test appropriately. By con-
trast, all other strategies have a CC and SCC of less
than 5, which will be less costly to test. On closer in-
spection of this result, it can be observed when com-
paring the results of this metric to that of the Local
and Global Impact Radius (Fig. 8 compared to Fig.
4). Putting both these results side by side, we can see
that there are similarities and overlaps between them.
This can be explained in part due to the fact that more
complex classes and functions have a greater chance
to contain executable statements, since there will be
more branching paths that may be followed.
6.5.2 Modifiability Results
This final experiment applies the Modifiability metric
of the ATRP exemplar, as shown in Fig. 9.
From Fig. 9, Lookahead Shortest Path and Q-
learning are the adaptive strategies in ATRP that have
the highest coupling. For these strategies, it indicates
Figure 8: Double bar chart showing the Cyclomatic and
Strict Cyclomatic Complexities of the ATRP adaptive
strategies; y-axis represents the number of linearly indepen-
dent paths through an adaptive strategy’s control flow graph
and x-axis represents the names of the adaptive strategies.
Figure 9: Graph showing the Coupling of each ATRP adap-
tive strategy, with the y-axis representing the number of
components in the system it is coupled to and the x-axis
representing the names of the adaptive strategies.
that some of them are externally more connected than
others. When it comes to the modifiability of a self-
adaptive system, it would be optimal for its adaptive
strategies to score low in this metric, since a change
in one of them would require less changes in other
components in the system (Kukreja, 2015).
Additionally, Fig. 10 presents the LCOM of each
adaptive strategy in ATRP. The same strategies that
score high on Coupling also score high on Lack of
Cohesion. Similar to Coupling, it is considered bet-
ter to score low in this metric, since it implies that
a given class is internally well-connected and there-
fore more cohesive (Kukreja, 2015). The reason why
some strategies have 0% LCOM is because their cor-
responding classes do not have any instance variables.
7 DISCUSSION
ASMS provides metrics for the practitioners to ana-
lyze adaptive strategies (1) from the design point of
view through static analysis of code, and (2) from the
runtime point of view through dynamic analysis. The
current version of ASMS is implemented as a plug-in
for Understand, which is widely used both in industry
ASMS: A Metrics Suite to Measure Adaptive Strategies of Self-Adaptive Systems
247

Figure 10: The Lack of Cohesion of each ATRP adaptive
strategy; y-axis represents the average number of class in-
stance variables that are not used by its methods; x-axis rep-
resents the names of the adaptive strategies.
and academia for software quality assessment.
A subset of the proposed metrics rely on classes,
hence on the object-oriented paradigm. This may be
considered a limitations, since not all the metrics de-
fined by ASMS may be applied to adaptive strategies
written in non object-oriented languages.
The ASMS plugin analyzes Java software. How-
ever, Understand supports other programming lan-
guages. Therefore, we plan to extend ASMS to
analyze software written in other programming lan-
guages (e.g., C++, Python used by other SEAMS ex-
emplars). The current version of ASMS implements
those metrics which can be computed through a static
analysis of code. One of the next steps is to proceed
with the implementation of the metrics requiring the
dynamic analysis of self-adaptive strategies.
8 RELATED WORK
Several works focus on the main features and devel-
opment aspects of SAS. They provide insights into
the various design and runtime properties of a self-
adaptive system that this paper has applied to adap-
tive strategies. For example, Cheng et. al (Cheng
et al., 2009) provides a comprehensive summary in
how state-of-the-art self-adaptive systems are engi-
neered today. Most notably, the authors have included
a number of different modeling dimensions that cor-
respond to the possible properties that a self-adaptive
system may have. Their list provides a basis to iden-
tify what kind of metrics may be developed to capture
these properties. The authors, however, do not pro-
vide a means to calculate such properties. Salehie and
Tahvildari (Salehie and Tahvildari, 2009) provide an
overview on self-adaptive software and a taxonomy of
self-adaptation which may inspire analysis and eval-
uation approaches for SAS. Raibulet (Raibulet, 2018)
proposes a taxonomy for the evaluation approaches
of SAS by considering what (e.g., scope, perspective,
level), how (e.g., mechanisms, type) and when (e.g.,
time, recativity) should it be evaluated. Turetken
(Turetken, 2013) provides a thorough summary of
the SIG Maintainability Model, which is used to map
source code properties onto the maintainability char-
acteristic of the ISO/IEC 9126 software quality at-
tributes. This is useful in determining which prop-
erties belonging to a piece of code have an influence
on the maintainability of software. In particular, the
author details how the model relates code complexity
and coupling to software testability and modifiability.
On the other hand, there are several papers fo-
cusing on the evaluation of SAS. For example, some
of the available evaluation approaches are summa-
rized in (Raibulet and Fontana, 2017). They con-
sider static and/or dynamic aspects of SAS. Perez-
Palacin et al. (Perez-Palacin et al., 2014) evaluates
architectural aspects at design time through the Sys-
tem Adaptability and Adaptability of Services metrics
in component-based systems. While, Reinecke et al.
(Reinecke et al., 2010) evaluate behavioural aspects
of SAS through the Adaptive metric, which collects
various performance aspects at rumtime. Kaddoum
et. al (Kaddoum et al., 2010) proposes a metric suite
based on four categories: methodological, architec-
tural, intrinsic, and runtime evaluation. Part of the
metrics identify ways to measure the quality of a SAS
design. For several of these metrics, they provide con-
crete formulas, methods or examples in how to cal-
culate them, but do not provide tool support. Ex-
cept (Perez-Palacin et al., 2014), none of the cited
approaches provides tool support for the computation
of the proposed evaluation approaches. This may be
considered a limitation in the adoption and applica-
tion of the proposed metrics in practice.
In this paper, we propose (1) a novel set of metrics
complementary to the existent ones, and (2) a plug-in
for a well known and spread tool in software devel-
opment (i.e., Understand) for the computation of our
proposed metrics requiring static code analysis.
9 CONCLUSIONS AND FUTURE
WORK
This paper centered around answering the question In
what meaningful ways can we measure the design and
runtime properties of the adaptive strategies belong-
ing to a self-adaptive system?. We have provided an
answer to this question through the proposal the new
ASMS metrics suite, which consists of five different
categories of metrics capturing various aspects of the
self-adaptive strategies. The proposed metrics requir-
ing static code analysis have been implemented in the
ENASE 2023 - 18th International Conference on Evaluation of Novel Approaches to Software Engineering
248

Understand tool. The plugin is used to gather the re-
sults for the evaluation, which involved applying the
metrics to one of the SAS exemplars.
In regards to future work, combining the ap-
proaches of static and dynamic code analysis could
lead to a more fruitful space in which to design met-
rics. Tackling the RQ with hybrid code analysis, for
example, could accomplish this. In addition to this,
further developing and implementing the metrics that
are based on dynamic code analysis would make the
suite more comprehensive and complete.
REFERENCES
Cheng, B. H. C., de Lemos, R., Giese, H., Inverardi, P.,
Magee, J., Andersson, J., Becker, B., Bencomo, N.,
Brun, Y., Cukic, B., Serugendo, G. D. M., Dustdar, S.,
Finkelstein, A., Gacek, C., Geihs, K., Grassi, V., Kar-
sai, G., Kienle, H. M., Kramer, J., Litoiu, M., Malek,
S., Mirandola, R., M
¨
uller, H. A., Park, S., Shaw, M.,
Tichy, M., Tivoli, M., Weyns, D., and Whittle, J.
(2009). Software engineering for self-adaptive sys-
tems: A research roadmap. In Software Engineering
for Self-Adaptive Systems, LNCS 5525, pages 1–26.
Garlan, D., Schmerl, B., and Cheng, S.-W. (2009). Soft-
ware Architecture-Based Self-Adaptation, pages 31–
55. Springer.
Gerostathopoulos, I. and Pournaras, E. (2019). Trapped in
traffic? a self-adaptive framework for decentralized
traffic optimization. In Intl Symposium on Sw Eng for
Adaptive and Self-Managing Systems, pages 32–38.
Gerostathopoulos, I., Raibulet, C., and Alberts, E. (2022).
Assessing self-adaptation strategies using cost-benefit
analysis. In 19th Intl Conference on Software Archi-
tecture Companion (ICSA-C), pages 92–95.
Gomes, I. V., Morgado, P., Gomes, T., and Moreira, R. M.
L. M. (2009). An overview on the static code analysis
approach in software development.
Hande, N. and Rao, P. V. (2017). A comparative study of
static, dynamic and hybrid analysis techniques for an-
droid malware detection. International Journal of En-
gineering Development and Research, 5:1433–1436.
Kaddoum, E., Raibulet, C., Georg
´
e, J.-P., Picard, G., and
Gleizes, M.-P. (2010). Criteria for the evaluation of
self-* systems. In ICSE Workshop on Software Eng
for Adaptive and Self-Managing Systems, page 29–38.
Kritzinger, D. (2017). 9 - development assurance. In
Kritzinger, D., editor, Aircraft System Safety, pages
193–324. Woodhead Publishing.
Krupitzer, C., Roth, F. M., VanSyckel, S., Schiele, G.,
and Becker, C. (2015). A survey on engineering ap-
proaches for self-adaptive systems. Pervasive Mob.
Comput., 17:184–206.
Kukreja, N. (2015). Measuring software maintainability,
https://quandarypeak.com/2015/02/measuring-
software-maintainability/.
Maia, P., Vieira, L., Chagas, M., Yu, Y., Zisman, A., and
Nuseibeh, B. (2019). Dragonfly: a tool for simulat-
ing self-adaptive drone behaviours. In Intl Sympo-
sium on Software Engineering for Adaptive and Self-
Managing Systems (SEAMS).
Masciadri, L. and Raibulet, C. (2009). Frameworks for
the development of adaptive systems: Evaluation of
their adaptability feature through software metrics. In
4th International Conf on Software Engineering Ad-
vances, pages 309–312. IEEE Computer Society.
McCabe, T. (1976). A complexity measure. IEEE Transac-
tions on Software Engineering, SE-2(4):308–320.
Perez-Palacin, D., Mirandola, R., and Merseguer, J. (2014).
On the relationships between qos and software adapt-
ability at the architectural level. Journal of System and
Software, 87:1–17.
Pollack, S. V. and Cytron, R. K. (2003). Executable State-
ment, page 683–684. John Wiley and Sons Ltd., GBR.
Raibulet, C. (2018). Towards a taxonomy for the evaluation
of self-* software. In 3rd Intl Workshops on Founda-
tions and Applications of Self* Systems, pages 22–23.
Raibulet, C., Arcelli Fontana, F., Capilla, R., and Carrillo,
C. (2017). Chapter 13 - an overview on quality evalu-
ation of self-adaptive systems. pages 325–352.
Raibulet, C., Arcelli Fontana, F., and Carettoni, S. (2020). A
preliminary analysis of self-adaptive systems accord-
ing to different issues. In Software Quality Journal,
volume 28, pages 1213–1243.
Raibulet, C. and Fontana, F. A. (2017). Evaluation of self-
adaptive systems: a women perspective. In 11th Euro-
pean Conference on Software Architecture, pages 23–
30.
Rawat, M. S., Mittal, A., and Dubey, S. K. (2012). Sur-
vey on impact of software metrics on software quality.
Journal of Advanced CS and Applications, 3(1).
Reinecke, P., Wolter, K., and van Moorsel, A. (2010). Eval-
uating the adaptivity of computing systems. Perfor-
mance Evaluation Journal, 67(8):676–693.
Salehie, M. and Tahvildari, L. (2009). Self-adaptive soft-
ware: Landscape and research challenges. Trans on
Autonomous and Adaptive Systems, 4(2):14:1–14:42.
Turetken, O. (2013). Towards a maintainability model for
business processes: Adapting a software maintainabil-
ity model. In Workshop on Communicat., pages 1–4.
Weyns, D. and Iftikhar, M. U. (2019). Activforms: A
model-based approach to engineer self-adaptive sys-
tems. ACM TOSEM, 10(10):1–59.
Weyns, D., Schmerl, B. R., Grassi, V., Malek, S., Mi-
randola, R., Prehofer, C., Wuttke, J., Andersson, J.,
Giese, H., and G
¨
oschka, K. M. (2010). On patterns for
decentralized control in self-adaptive systems. In Soft-
ware Engineering for Self-Adaptive Systems, pages
76–107.
Wuttke, J., Brun, Y., Gorla, A., and Ramaswamy, J. (2012).
Traffic routing for evaluating self-adaptation. In Intl
Symposium on Software Engineering for Adaptive and
Self-Managing Systems, pages 27–32.
ASMS: A Metrics Suite to Measure Adaptive Strategies of Self-Adaptive Systems
249
