
Extracting Queryable Knowledge Graphs from User Stories: An
Empirical Evaluation
Ayodeji Ladeinde
1 a
, Chetan Arora
1 b
, Hourieh Khalajzadeh
2 c
, Tanjila Kanij
1 d
and John Grundy
1 e
1
Department of Software Systems and Cybersecurity, Monash University, Clayton, Melbourne, Australia
2
School of Info Technology, Deakin University, Melbourne Burwood Campus, Australia
Keywords:
Requirements Engineering, Modeling, User Stories, Natural Language Processing, Querying.
Abstract:
User stories are brief descriptions of a system feature told from a user’s point of view. During requirements
elicitation, users and analysts co-specify these stories using natural language. A number of approaches have
tried to use Natural Language Processing (NLP) techniques to extract different artefacts, such as domain
models and conceptual models, and reason about software requirements, including user stories. However, large
collections of user story models can be hard to navigate once specified. We extracted different components
of user story data, including actors, entities and processes, using NLP techniques and modelled them with
graphs. This allows us to organise and link the structures and information in user stories for better analysis by
different stakeholders. Our NLP-based automated approach further allows the stakeholders to query the model
to view the parts of multiple user stories of interest. This facilitates project development discussions between
technical team members, domain experts and users. We evaluated our tool on user story datasets and through
a user study. The evaluation of our approach shows an overall precision above 96% and a recall of 100%. The
user study with eight participants showed that our querying approach is beneficial in practical contexts.
1 INTRODUCTION
User stories are a semi-structured Natural Lan-
guage (NL) notation to capture software require-
ments (Wautelet et al., 2014). User stories are gaining
attention as the format for specifying requirements in
the software industry, due to the increased adoption
of agile development methodologies (Lucassen et al.,
2016). Figure 1 shows a typical notation and struc-
ture of user stories and an example user story. In this
notation, the Role (Who?) represents the functional
role who wants a functionality; the Goal (What?) is
what functionality the user or stakeholder requires the
system to provide; and some Reason/Benefit (Why?)
why this functionality is needed. The reason part in
the user story is optional.
A user story describes functionality that is valu-
able to a given user role. User stories are subject
a
https://orcid.org/0000-0002-6239-9665
b
https://orcid.org/0000-0003-1466-7386
c
https://orcid.org/0000-0001-9958-0102
d
https://orcid.org/0000-0002-5293-1718
e
https://orcid.org/0000-0003-4928-7076
Who?
As a UI designer, I want to redesign the resources page,
so that it matches the new broker design styles.
As a <Role>, I want to <Goal>, so that <Reason/Benefit>.
What?
Why?
Figure 1: Example User Story and Structure.
to several kinds of analysis in the early development
stages by different stakeholders. Multiple stakehold-
ers and teams rely on the user stories for develop-
ing quality software. For instance, customers count
on user stories as their requirements from the sys-
tem, whereas, designers and developers see them as
their development guide (Cohn, 2004). Even a mod-
erate size project contains hundreds or even thou-
sands of user stories specified during the requirements
engineering (RE) phase. Due to the sheer number
of user stories, managing and analysing them can
be very challenging for project stakeholders. Nav-
igating through these large documents by multiple
groups is inefficient, error prone, and often leads to
delays in important development and quality assur-
684
Ladeinde, A., Arora, C., Khalajzadeh, H., Kanij, T. and Grundy, J.
Extracting Queryable Knowledge Graphs from User Stories: An Empirical Evaluation.
DOI: 10.5220/0011994400003464
In Proceedings of the 18th International Conference on Evaluation of Novel Approaches to Software Engineering (ENASE 2023), pages 684-692
ISBN: 978-989-758-647-7; ISSN: 2184-4895
Copyright
c
2023 by SCITEPRESS – Science and Technology Publications, Lda. Under CC license (CC BY-NC-ND 4.0)

ance tasks (Lucassen et al., 2017; Arora et al., 2019).
To enhance communication between stakeholder
groups and facilitate the analysis of user story-based
requirements documents, a more efficient way of
managing user stories is required. This should pro-
vide a proper knowledge representation that captures
and stores all the information necessary for the scope
of the software they are developing. Our main objec-
tive in this work is to evaluate use of a graph-based
model stored in a graph database that closely matches
the narrative found in user stories. We want to con-
nect the simple abstractions of nodes and relation-
ships into connected structures that are simpler and
more expressive than those created in prior research
work (see (G
¨
unes¸ and Aydemir, 2020; Lucassen et al.,
2017)). For this purpose, we extract from user sto-
ries of a given project a set ofknowledge graphs that
represent a network of (real-world) entities (Lu et al.,
2017). Figure 2 illustrates an example knowledge
graph for three user stories (identifier US1, US13 and
US15). For illustration purposes we only show the
who and the what parts in this example.
Prior work on Agile and NLP for requirements en-
gineering has developed heuristic techniques for de-
tecting entities and relationships whenever the text
meets specified language patterns (Lucassen et al.,
2017). Furthermore, the advancement in Natural Lan-
guage Processing (NLP) techniques has facilitated the
automation of information extraction from user sto-
ries. We wanted to build on the existing work to ex-
tract meaningful knowledge graph models from re-
quirements represented as user stories. We further fo-
cused on facilitating stakeholders by allowing them
to query these models, as models extracted as-is from
the user story documents can be cluttered and can ren-
der the model extraction moot.
For example, the Figure 2 is a queried version of a
complete user story document. If we were to present
the entire knowledge graph extracted from a given
document, it would potentially contain hundreds or
even thousands of nodes, which are extremely diffi-
cult for users to navigate and use. Figure 2 shows the
model queried for a given user role (UI designer) and
only for who and what parts. This representation can
easily help a stakeholder realise the responsibilities of
the UI designer for the given system and can help in
several use cases during software development, e.g.,
analysing requirements, writing acceptance test cases,
and assigning responsibilities in a project.
Numerous works have used models extracted us-
ing NLP techniques to represent the structure of soft-
ware requirements and the key relationships among
them (Arora et al., 2016; Horkoff et al., 2019; Saini
et al., 2020). However, these approaches lack flexibil-
US1 US13 US15
UI
Designer
resources
page
admin
page
user
testing
redesign
design
schedule
Figure 2: Example Knowledge Graph.
ity, their extracted requirements models are not query-
able (except (Saini et al., 2020)), and they are limited
to extracting specifically formatted models. Many are
focused only on a single notation pattern (see (Lu-
cassen et al., 2017; Zaki-Ismail et al., 2022)), such as
the one described above. This limits their applicabil-
ity to real-life scenarios. In this work, we aimed to ex-
plore using NLP techniques to extract rich knowledge
graphs (KGs) from user stories. We wanted to use a
combination of NLP techniques and KGs to help re-
quirements engineers to extract meaningful informa-
tion from a user story document and query the model.
Adopting such an approach would enable us to rep-
resent each user story in its core elements. It further
enables requirement engineers to determine the role
of each key constituent entity in the project. It would
store the result, allowing us to traverse and query the
graph to enhance requirements analysis.
We provide an overview of our approach for ex-
tracting user stories’ constituent parts and represent-
ing them using query-able KGs. Our approach relies
on KGs for visualising the models and also return-
ing the queried models in textual or tabular formats.
Our tool aims to help foster incremental and continual
communication required to develop a shared under-
standing of the problem and potential solution among
agile teams (Sanders-Blackman, 2021). We use a
large set of user stories to evaluate our extraction tech-
nique, and a user evaluation to evaluate the usability
and usefulness of our approach. The key contribu-
tions of this work include:
• We develop a novel NLP-based extraction ap-
proach to convert user stories into KGs;
• We describe different scenarios on how user story
KGs can be queried by requirements engineers to
better understand software requirements from a
range of perspectives;
• We evalute the accuracy of our approach for ex-
tracting and querying the relevant parts. We fur-
Extracting Queryable Knowledge Graphs from User Stories: An Empirical Evaluation
685
ther conduct a user study with eight participants
to evaluate the feasibility of our approach.
2 RELATED WORK
RE is arguably the most critical stage in software de-
velopment (Pohl, 2010). Requirements can be spec-
ified using different formats, e.g., natural language
(NL) shall-style statements, (NL) user stories, for-
matted use cases, UML models, and formal mathe-
matical notations. Natural language is the most com-
mon medium for specifying requirements (Mich et al.,
2004; Abualhaija et al., 2020), and user stories are
among the most common formats, especially in agile
development scenarios (Abrahamsson et al., 2011).
With limited resources available for RE processes and
the focus on code-first approach, automated solutions
are required to justify any efforts spent in require-
ments analysis. NLP provides computational sup-
port for requirement analysts to (semi-)automatically
process all the information gathered when engaging
users, and perform several analysis tasks to classify,
prioritise, quality assurance, translate to more formal
specifications, extract and visualise NL requirements
constituent parts (Casamayor et al., 2012).
Several approaches have been proposed in the RE
literature for the automated extraction of model el-
ements from NL requirements (Yue et al., 2011).
These approaches range from extracting domain mod-
els (Arora et al., 2016; Saini et al., 2020), use case
models (Nguyen et al., 2015; Elallaoui et al., 2018),
goal models (G
¨
unes¸ and Aydemir, 2020), formal mod-
els (Zaki-Ismail et al., 2022), and conceptual mod-
els (Ali et al., 2010; Lucassen et al., 2017). Only a
handful of approaches have leveraged the user stories
format for the extraction of models or elements for re-
quirements analysis, including (Lucassen et al., 2017;
Dalpiaz et al., 2019; G
¨
unes¸ and Aydemir, 2020).
While our approach leverages the NLP rules dis-
cussed in these prior strands of work on user stories,
our approach aimed at using patterns that can account
for the flexibility in the writing of user stories, which
is generally the case in practice and can be easily ex-
tended (as we discuss in Section 3). We further aim to
support requirements engineers and other stakehold-
ers to efficiently query the models, based on their task
at hand and provide them with different views of the
models. none of the previous approaches for model
extraction and visualisation from user stories provide
the interactive support via model querying.
In software engineering, knowledge graphs have
been used for test case generation (Nayak et al., 2020)
and as a mean for the adaptation of conceptual mod-
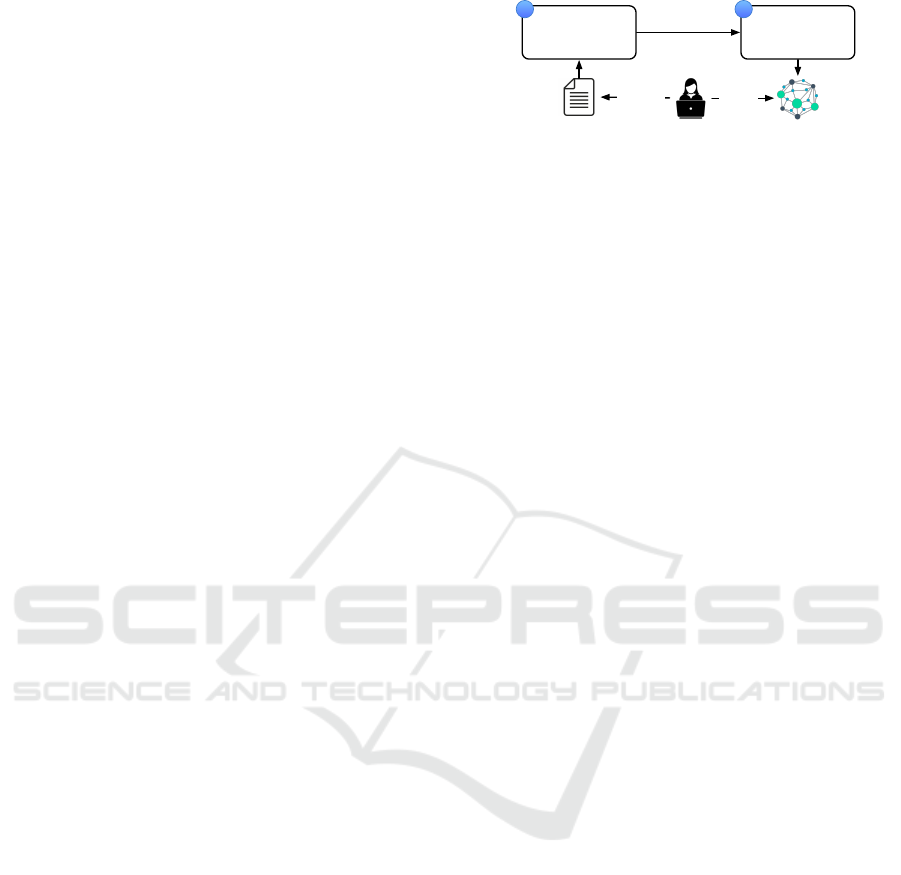
Constituent
Parts Extraction
Knowledge
Graph Modelling
1 2
User Story
Document
Knowledge
Graph
specify
query
Figure 3: Approach Overview.
els (Smajevic and Bork, 2021). To the best of our
knowledge, none of the previous works in software
engineering and other domains, have used knowledge
graphs for the visualisation of requirements elements,
and specifically for user stories.
3 APPROACH
We discuss our novel approach for the extraction and
visualisation of the query-able knowledge from user
stories. Figure 3 depicts the key steps in our user
story analysis, extraction, modelling and querying ap-
proach. In our two step approach, we first extract
the constituent parts of user stories using NLP and
a set of heuristics. In the second step, we convert the
constituent parts into a knowledge graph, representing
all the user stories for a given document. We enable
requirement engineers to query the knowledge graph
using a graph querying approach, and derive insights
from the knowledge graph from various perspectives.
Below we discuss these steps.
3.1 Step 1: Constituent Parts Extraction
In Step 1, we processed each user story in our cor-
pus by extracting the role in the WHO part, the main
verb, the main object and other free-form text in the
WHAT, and the free-form text in the WHY part for the
stories that contained one (see Figure 1). Prior work
(G
¨
unes¸ and Aydemir, 2020) used regular expressions
to remove the special keywords of the template from
each user story and split each story into three parts
using limited indicators of each part, i.e., the ‘As a’,
‘want to’ and ‘so that’. Other prior work on user
story analysis (Lucassen et al., 2017) used indicators
as identified by (Wautelet et al., 2014) to do the ex-
traction: As / As a(n) for the role, I want (to) / I can /
I am able / I would like for the What, and so that for
the ends part. Step 1 builds upon these existing works
and extends them to include more structural indica-
tors, e.g., filler works such as ‘only want’ instead of
‘want’ in a user story. The rationale for adding ad-
ditional identifies in our approach is to account for
the common flexibility of user stories and the liber-
ENASE 2023 - 18th International Conference on Evaluation of Novel Approaches to Software Engineering
686

ties that requirement engineers take while specifying
them. Step 1 implements two key procedures called
extractComponents and patternMatcher presented
in detail in an online repository
1
.
3.2 Step 2: KG Modelling
The second step of our approach focuses on mod-
elling the constituent parts of a user story as a KG.
We store and query the knowledge graphs using the
Neo4j graph data platform (Neo4j, 2012). For each
user story document, we maintain the reference to all
the user stories. For each user story, we maintain the
reference to its constituent parts, i.e., Role, Goal and
Benefits, in a file. Below Listings 1–3 show the code
for setting up the Who, What and Why parts, i.e., the
roles, goals and rationales in the Neo4j platform.
1 LOAD CSV WI TH HEA D E R S FROM ’<
file _ u rl > ’ AS r ow
2 WITH DISTINCT row . w h o _ i d AS who_ id ,
3 row . WHO AS Who
4 MERGE ( w : Who { c ode : to I nte g e r ( who_id )
})
5 ON CREATE SE T w . name = Who
Listing 1: Roles in Neo4j.
1 MATCH ( w : Who { c ode : to I nte g e r ( r ow .
who_id ) })
2 C R E A T E (wh : W h at )
3 SET wh . n a me = row . Enti ty ,
4 wh . T e x t = ro w . W HAT
5 C R E A T E (w) -[: WANT { t i t l e : r ow .
Re l a t ion s h i p }] - >( w h )
Listing 2: Goals in Neo4j.
1 C R E A T E (r: Why )
2 SET r. name = row . Enti ty ,
3 r. Text = r ow . WHY
4 C R E A T E (wh ) -[: So _ t hat ] - >( r )
Listing 3: Rationale in Neo4j.
Furthermore, in recognizing constituent parts of
the user stories within our corpus, we created a Name-
dEntity node. This node stores those entities for
which one or many tokens stand consistently for
something in the domain that the token or combina-
tion of token signifies. Then, we created a PARTIC-
IPATE IN relationship between the token nodes and
the NamedEntity node. The NamedEntity nodes are
created only once for repeated occurrences of entities
found in our dataset corpus. However, what consti-
tutes a Named Entity type varies depending on the do-
main. Named Entities are commonly people, places,
1
https://doi.org/10.6084/m9.figshare.22261537.v1
and organizations, but they can also be street ad-
dresses, times, chemical formulas, mathematical for-
mulas, gene names, etc. (Negro, 2021).
Querying. Our approach allows requirements engi-
neers to query their user story knowledge graph mod-
els. Listing 4 shows an example query, written in the
Neo4j platform query language. This example query
identifies all of the goals of the UI designer role, along
with their rationale. We can use queries that suit dif-
ferent tasks for different stakeholders, where they can
use the pre-written queries and simply edit the param-
eters. For example, “UI designer” in Listing 4 can
be replaced by “developer”. We also plan to provide
a press button implementation for different types of
queries for end users of our approach.
1 MATCH ( n : Who ) -[: WANT ] - >( w h : What ) -[:
So_tha t | HAS_E N T I T Y ] - >( m : W hy ) -[:
HA S _ E N T ITY ]- >( k : E n t i t y )
2 WHERE n . name = " U I desig n e r "
3 R E T U R N n , wh , m , k
Listing 4: Example Query.
4 EVALUATION
To evaluate our proposed approach, we developed the
following research questions (RQs):
RQ1 - To What Extent Can NLP Techniques Extract
Relevant Segments from User Stories? We aim to
evaluate the performance of the NLP techniques that
we have adopted in identifying each user story and
extracting WHO, WHAT and WHY components. The
analysis helps to know how well our technique works
with commonly used user story formats.
RQ2 - How Can User Story Graph Models Be
Queried to Better Understand Software Require-
ments from a range of Perspectives? We want a
graph model that enables us to store and query our
user story corpus from a range of perspectives.
RQ3 - How Valuable Do Human Analysts Find Our
Knowledge Graph Models? We want to understand
1) how the relationship representation between the
user story segments aids the comprehension of the
context of the entities in the segments; and 2) to what
level the representation of each segment using nodes
helps to understand the relationships between them.
4.1 Dataset Features
In this section, we briefly describe the publicly avail-
able dataset we used to answer RQ1. The dataset used
in this study is presented by (Dalpiaz, 2018). It is a
collection of 22 datasets with 50+ requirements each,
expressed as user stories that align with the format
Extracting Queryable Knowledge Graphs from User Stories: An Empirical Evaluation
687

described by (Cohn, 2004). The authors of (Dalpiaz,
2018) stated that they obtained the dataset from an on-
line repository or retrieved from software companies.
These user stories served as the input corpus into our
framework Step 1 in Figure 3. Table 1 and 2 sum-
marises the lexical characteristics of each dataset.
Table 1: Lexical characteristics of each dataset.
Dataset Σn
word
Σn
ent
Σn
rel
Σn
tmpl
Σn
us
g02-federalspending 2099 255 2097 648 92
g03-loudoun 2590 220 1590 517 58
g04-recycling 1622 170 1290 431 51
g05-openspending 1648 181 1647 458 53
g08-frictionless 1762 185 1761 526 66
g10-scrumalliance 4825 248 2589 762 97
g11-nsf 2034 208 1758 573 73
g12-camperplus 2378 138 1422 422 55
g13-planningpoker 1480 145 1477 423 53
g14-datahub 2715 174 1849 557 67
g16-mis 1546 216 1543 335 66
g17-cask 3012 144 1637 342 66
g18-neurohub 2220 262 2216 561 102
g19-alfred 3868 257 2448 717 138
g21-badcamp 4738 221 1879 577 69
g22-rdadmp 2256 214 2251 714 83
g23-archivesspace 878 122 878 273 56
g24-unibath 3405 176 1455 423 53
g25-duraspace 2028 189 2010 500 100
g26-racdam 2856 233 2139 739 100
g27-culrepo 8185 456 3386 794 115
g28-zooniverse 1064 141 1064 309 60
To understand the datasets, we computed the total
numbers of the components of the datasets in Table 1,
the averages of the elements of the datasets, and the
user story writing style as shown in Table 2. In Ta-
Table 2: Averages & Conceptual density of each Dataset.
Dataset Averages Conceptual density
¯x
word
¯x
ent
¯x
rel
ρ
ent
ρ
rel
ρ
conc
g02-federalspending 22.82 2.77 22.79 0.18 1.45 1.62
g03-loudoun 44.66 3.79 27.41 0.11 0.77 0.87
g04-recycling 31.80 3.33 25.29 0.14 1.08 1.23
g05-openspending 31.09 3.42 31.08 0.15 1.38 1.54
g08-frictionless 26.70 2.80 26.68 0.15 1.42 1.57
g10-scrumalliance 49.74 2.56 26.69 0.06 0.64 0.70
g11-nsf 27.86 2.85 24.08 0.14 1.20 1.35
g12-camperplus 43.24 2.51 25.85 0.07 0.73 0.80
g13-planningpoker 27.92 2.74 27.87 0.14 1.40 1.53
g14-datahub 40.52 2.60 27.60 0.08 0.86 0.94
g16-mis 23.42 3.27 23.38 0.18 1.27 1.45
g17-cask 45.64 2.18 24.80 0.05 0.61 0.67
g18-neurohub 21.76 2.57 21.73 0.16 1.34 1.49
g19-alfred 28.03 1.86 17.74 0.08 0.78 0.86
g21-badcamp 68.67 3.20 27.23 0.05 0.45 0.50
g22-rdadmp 27.18 2.58 27.12 0.14 1.46 1.60
g23-archivesspace 15.68 2.18 15.68 0.20 1.45 1.65
g24-unibath 64.25 3.32 27.45 0.06 0.49 0.55
g25-duraspace 20.28 1.89 20.10 0.12 1.32 1.44
g26-racdam 28.56 2.33 21.39 0.11 1.01 1.12
g27-culrepo 71.17 3.97 29.44 0.06 0.46 0.52
g28-zooniverse 17.73 2.35 17.73 0.19 1.41 1.60
ble 1, Σn
word
represents the total number of words
contained in each of the dataset, Σn
ent
is the total
number of named entities, the cummulative number
of relations is Σn
rel
, the sum of words contained in
each user story template Σn
tmpl
, and the number of
user stories is represented by Σn
us
. The entity density
ρ
ent
is the ratio of the number of entities contained
in each story to the difference between the number of
words and the number of words in the user story tem-
plate, i.e.,
ρ
ent
=
Σn
ent
Σn
word
− Σn
templ
(1)
while the relationship density ρ
rel
is the ratio of
the number of relationships contained in each story to
the difference between the number of words and the
number of words in the user story template i.e.
ρ
rel
=
Σn
rel
Σn
word
− Σn
templ
(2)
The concept density is the addition of the entity and
relationship densities (Lucassen et al., 2017).
ρ
conc
= ρ
ent
+ ρ
rel
(3)
While g27-culrepo dataset had the highest aver-
age number of words, g21-badcamp and g24-unibath
datasets ranked second and third, respectively. The
datasets that contained the least average number
of terms are g25-duraspace, g28-zooniverse, and
g23-archivesspace, in that order. g27-culrepo also
ranked second to the g05-openspending, while g23-
archivesspace was also the least in terms of the aver-
age number of relations. The average number of iden-
tified entities per user stories contained in the datasets
were between two and four with g27-culrepo dataset
containing the most entities. In terms of conceptual
density per data set, g23-archivesspace dataset is the
richest, while g21-badcamp ranks the least.
4.2 Evaluation Method
Algorithm Evaluation. To be able to provide answers
to our first research question, RQ1, our evaluation ob-
jective was to determine quantitatively to what extent
we can use NLP techniques to extract relevant seg-
ments from user stories. To achieve this, we evalu-
ated the feasibility of our approach and heuristic accu-
racy by applying our algorithm to twenty-two datasets
from real-world projects, described in Section 4.1.
We determined the correctness of our implementa-
tion by comparing the algorithm’s outputs to the man-
ual labelling of each user story contained in the data
sets. Our evaluation objective is to quantitatively de-
termine to what extent can NLP techniques be used in
extracting relevant segments from user stories.
ENASE 2023 - 18th International Conference on Evaluation of Novel Approaches to Software Engineering
688

To conduct the manual labelling, we followed a
four-step rigorous approach. Firstly, the first two
authors independently applied the extractComponent
and patternMatcher algorithms to the user stories to
identify all the Functional roles, Goals and Bene-
fits. The second author compared the input and output
documents, and noted all the discrepancies between
the documents. Both authors resolved the discrepan-
cies by discussing and agreeing to the correct applica-
tion of the algorithms. Finally, computed the metrics.
In computing the metrics, we determine the Pre-
cision, Recall, and F
1
Score for each of the compo-
nents (Functional roles, Goals and Benefits) retrieved
by the algorithm from each user story contained in
each dataset corpus as:
1. Precision (P): Ratio of the number of relevant
components retrieved to the number of retrieved
items.
2. Recall (R): Ratio of the number of relevant com-
ponents retrieved to the number of relevant items.
3. F
1
Score: The weighted harmonic mean of P & R.
Graph Model Evaluation: Qualitative. To evaluate
how well our user story graph model can be queried to
better understand software requirements from a range
of perspectives, we used a user study by engaging an-
alysts for their opinions. We obtained ethics approval
from the University Human Research Ethics Commit-
tee, and recruited volunteer analysts.
During an interview session with each participant,
we introduced the concept of user story analysis us-
ing KG to the analysts. We obtained their demo-
graphic information and their level of knowledge/ex-
pertise in using SQL and cypher querying languages.
They were also shown how to query the model for an-
swers from the processed user story datasets.
They were requested to select and examine one of
our 22 datasets. Based on their choice, we developed
queries, such as: (i) find user stories with a common
role and a verb but a different object, or different verbs
and objects; (ii) find user stories with common ob-
jects (G
¨
unes¸ and Aydemir, 2020); (iii) functional role
count; and (iv) answering the question “What type
of data do users require?” The participants were re-
quired to do the activity manually using a spreadsheet
to confirm the output of our query.
5 RESULTS
In this section, we present the results of evaluating
our extraction algorithm (RQ1) and analyst user eval-
uation of our KG approach (RQ2 and RQ3).
5.1 Evaluation - Extraction Algorithm
Table 3 reports our user story extraction algorithm’s
accuracy in extracting the components within each
user story in each corpus. The table has three macro-
columns: Role, Goal, and Benefits, and each macro-
column possesses three sub-columns to signify Preci-
sion (PRC), Recall (RCL), and F
1
Score (F
1
).
Table 3: Analysis of user story Component retrieval.
Dataset Role Goal Benefits
PRC RCL F
1
PRC RCL F
1
PRC RCL F
1
g02-federalspending 98.99 100 99.49 96.94 100 98.45 94.00 100 96.91
g03-loudoun 98.28 100 99.13 98.28 100 99.13 98.28 100 99.13
g04-recycling 100 100 100 100 100 100 100 100 100
g05-openspending 100 100 100 100 100 100 98.11 100 99.05
g08-frictionless 86.36 100 92.68 90.77 100 95.16 98.41 100 99.20
g10-scrumalliance 95.88 100 97.89 94.85 100 97.35 100 100 100
g11-nsf 100 100 100 100 100 100 100 100 100
g12-camperplus 100 100 100 92.73 100 96.23 100 100 100
g13-planningpoker 100 100 100 96.23 100 98.08 98.11 100 99.05
g14-datahub 98.51 100 99.25 97.01 100 98.48 34.30 100 51.10
g16-mis 98.48 100 99.24 100 100 100 100 100 100
g17-cask 100 100 100 100 100 100 100 100 100
g18-neurohub 90.20 100 94.85 96.08 100 98.00 100 100 100
g19-alfred 100 100 100 98.55 100 99.27 100 100 100
g21-badcamp 100 100 100 92.75 100 96.24 100 100 100
g22-rdadmp 98.80 100 99.39 97.59 100 98.78 100 100 100
g23-archivesspace* 98.21 100 99.10 98.21 100 99.10
g24-unibath 98.00 100 99.05 96.23 100 98.08 100 100 100
g25-duraspace* 97.96 100 98.97 98.00 100 98.99
g26-racdam 99.00 100 99.50 96.00 100 97.96 100 98.81 99.40
g27-culrepo 100 100 100 98.26 100 99.12 96.92 100 98.44
g28-zooniverse 100 100 100 100 100 100 100 100 100
Average 98.12 100 99.02 97.20 100 98.56 95.91 99.94 97.11
Our algorithm was the least precise in extract-
ing relevant aspects of the functional role and
Goal components for the user stories in the g08-
frictionless dataset instance. The role extraction
achieved 86.36% compared to 100% achieved in
ten of the datasets (i.e. g12-camperplus, g21-
badcam, g13-planningpoke, g27-culrep, 19-alfred,
g05-openspending, g04-recycling, g11-nsf, and g17-
cask). The precision of our algorithm for the goal
extraction had the least performance on the g08-
frictionless dataset. The precision was 90.77% com-
pared to g28-zooniverse, g05-openspending, g05-
openspending, g04-recycling, g11-nsf, and g17-cask
datasets, upon which it achieved 100%. The failure of
the algorithm to achieve greater precision in detecting
these parts is due to the higher number of user stories
not following a common semi-structured format sup-
ported by our tool. For example: “As a Researcher,
working with data, I want an Microsoft Power BI
integration, so that I can import datasets without
downloading them locally.” The “working with data”
phrase was not required in the functional role.
In addition, our algorithm’s precision for the ben-
efits part extraction had low performance on the g14-
datahub dataset, with 34.3% precision and an F1 score
of 51.1%. However, it achieved an average of 99.53%
precision on other datasets. The poor result on the
g14-datahub dataset can be attributed to its high num-
ber of syntactically wrong user stories. For example:
“As a Consumer, I want to download the data pack-
Extracting Queryable Knowledge Graphs from User Stories: An Empirical Evaluation
689

age in one file, so that that I don’t have to download
descriptor and each resource by hand.” The indica-
tor before the benefits part has ”so that that.” Further-
more, the user stories in the g23-archivesspace and
g25-duraspace datasets contained no ‘benefits’ parts.
5.2 Evaluation - Analyst Interview
To answer RQ2 and RQ3, we interviewed eight an-
alysts in 60-minute individually. The analysts com-
prised five participants, who identified as female and
three as male. We asked our participants to reuse
some existing queries and also to write some queries
on their own. This would show us how well ana-
lysts can develop these queries to get insights from
the decomposed dataset. However, we found out
that none of the participants had prior skills in us-
ing Cypher, i.e., the programming language used for
querying KGs, however, they did have between 3-
7 years of work experience using SQL, a relational
database management system, similar to Cypher.
Since none of the analysts had prior experience
with Cypher queries and/or KG use, they were un-
able to draft the query because it was hard to do and
confusing. Consequently, we helped to draft sam-
ple questions based on the set of sample user stories
from (G
¨
unes¸ and Aydemir, 2020) and showed them
the manual output. With this, they had a more explicit
objective for our approach to the analysis.
Six of the participants said that the way the dataset
node and user story nodes were shown helped them
understand the graph model, while two had different
views. All eight agreed that the model helped them
quickly obtain the appropriate answers to questions.
However, when we showed the graph model with
all token nodes, all 8 participants stated that the KG
visualization was convoluted and complex because
each token was represented by a node.
5.3 Discussion
RQ1 - To What Extent Can NLP Techniques Be
Used in Extracting Relevant Segments from User
Stories? Our algorithm’s precision is high, its re-
call is positive, and F
1
score is also high in most in-
stances where we have applied it to extract the func-
tional roles, goals, and benefits from each dataset.
It achieved an overall average P, R, and F
1
score of
98.12%, 100% and 99.02%, respectively in extracting
the functional role from the datasets. Similarly, the
overall average precision, recall and F
1
score when
used to extract the goals were 97.20%, 100% and
98.56%, respectively. At the same time, we achieved
95.91%, 99.94% and 97.11% in extracting the ben-
efits. The applicability of the algorithm to extract-
ing these components from real-world scenarios to
help analysts extract roles, goal models, and benefits
is promising for user stories that are compliant with
the ASD template. But because we programmed it to
extract parts of the story based on a set of rules, it
doesn’t work well with user stories that don’t follow
those rules.
RQ2 - How Can User Story Graph Models Be
Queried to Better Understand Software Require-
ments from a Range of Perspectives? We assessed
this question through the qualitative data we collected
during our user study participant interviews. Using
our KG model as a guide, we came up with queries
that helped participants learn from the user story
dataset. The feedback we got indicated that the
responses to the queries we drafted were good and
helped facilitate more discussion between software
development teams. As a participant stated, “It is
more beneficial than using Microsoft Excel to seek
stories with similar roles, actions and objects”, thus
aiding better comprehension of their relationships.
RQ3 - How Valuable Do Human Analysts Find the
KG Models? Our feedback from interviews showed
that none of the participants had ever used a KG
database. As such, most of them would have preferred
a more user-friendly interface they could easily relate
to instead of using the Neo4j querying interface. A
participant wanted more value regarding the approach
of being able to check for duplicate user stories, those
that contradicted another, or those that were depen-
dent on the implementation of other stories. A partici-
pant suggested that the user story node should include
a priority property to enable a user to assess the stories
in a specified order. A graphical user interface built
on top of our KG representation of the user story data
sets serving as a database would help the analysts to
be able to extract insights and goal models in a more
relatable manner to using the queries via the Neo4j
platform. The user interface approach would enable
an analyst to input their queries using a combination
of natural language input in text boxes and push but-
tons to generate insights. Generating new textual user
stories from a returned graph query could be a useful
feature of this approach.
5.4 Threats to Validity
External Validity. Generalizability is always a con-
cern in any SE study. We evaluated our approach on
22 datasets and with eight participants. A wider eval-
uation is required to improve external validity.
Construct Validity. The intrinsic ambiguity of natu-
ENASE 2023 - 18th International Conference on Evaluation of Novel Approaches to Software Engineering
690

ral language is well known. While our precision and
recall for identifying the role, objective, and benefits
are high, we do not know if the information we wish
to extract is advantageous. Therefore, we believe a
larger-scale evaluation with practitioners may be re-
quired to determine the subjectivity of our algorithm.
Internal Validity. This category of threat in related to
experimental design. We manually retrieved the user
story role, objective, and benefits components from
these datasets. Since we utilised numerous human ex-
tractors, we feel that human error is unlikely to have
led to inaccurate analysis.
6 CONCLUSION
We propose an automated approach for extracting
roles, goals, and benefits from user stories and vi-
sualizing them as knowledge graphs. Our approach
leverages NLP techniques and Neo4j’s querying ca-
pabilities, increasing interactiveness and facilitating
communication between stakeholders. Evaluation of
our approach on 22 user story datasets showed 100%
recall and average precision of > 96% for extracting
parts. A user study with eight participants confirmed
the usefulness of the graph model but suggested a
more user-friendly GUI. Future work includes de-
veloping a more user-friendly interface, adding more
story properties, and conducting further user studies.
ACKNOWLEDGEMENTS.
Ladeinde, Kanij and Grundy are supported by ARC
Laureate Fellowship FL190100035.
REFERENCES
Abrahamsson, P., Fronza, I., Moser, R., Vlasenko, J., and
Pedrycz, W. (2011). Predicting development effort
from user stories. In 2011 International Sympo-
sium on Empirical Software Engineering and Mea-
surement. IEEE.
Abualhaija, S., Arora, C., Sabetzadeh, M., Briand, L. C.,
and Traynor, M. (2020). Automated demarcation
of requirements in textual specifications: a machine
learning-based approach. Empirical Software Engi-
neering, 25(6):5454–5497.
Ali, R., Dalpiaz, F., and Giorgini, P. (2010). A goal-based
framework for contextual requirements modeling and
analysis. Requirements Engineering, 15(4):439–458.
Arora, C., Sabetzadeh, M., Briand, L., and Zimmer, F.
(2016). Extracting domain models from natural-
language requirements: approach and industrial eval-
uation. In Conference on Model Driven Engineering
Languages and Systems.
Arora, C., Sabetzadeh, M., Nejati, S., and Briand, L. (2019).
An active learning approach for improving the accu-
racy of automated domain model extraction. ACM
TOSEM, 28(1):1–34.
Casamayor, A., Godoy, D., and Campo, M. (2012). Min-
ing textual requirements to assist architectural soft-
ware design: a state of the art review. Artificial In-
telligence Review, 38(3):173–191.
Cohn, M. (2004). User stories applied: For agile software
development. Addison-Wesley Professional.
Dalpiaz, F. (2018). Requirements data sets (user stories).
Mendeley Data, v1.
Dalpiaz, F., Van Der Schalk, I., Brinkkemper, S., Aydemir,
F. B., and Lucassen, G. (2019). Detecting terminolog-
ical ambiguity in user stories: Tool and experimenta-
tion. Information and Software Technology, 110:3–16.
Elallaoui, M., Nafil, K., and Touahni, R. (2018). Automatic
transformation of user stories into uml use case dia-
grams using nlp techniques. Procedia computer sci-
ence, 130:42–49.
G
¨
unes¸, T. and Aydemir, F. B. (2020). Automated goal model
extraction from user stories using nlp. In 28th Re-
quirements Engineering Conference (RE). IEEE.
Horkoff, J., Aydemir, F. B., Cardoso, E., Li, T., Mat
´
e, A.,
Paja, E., Salnitri, M., Piras, L., Mylopoulos, J., and
Giorgini, P. (2019). Goal-oriented requirements engi-
neering: an extended systematic mapping study. Re-
quirements engineering, 24(2):133–160.
Lu, H., Hong, Z., and Shi, M. (2017). Analysis of film
data based on neo4j. In 2017 IEEE/ACIS 16th In-
ternational Conference on Computer and Information
Science (ICIS), pages 675–677. IEEE.
Lucassen, G., Dalpiaz, F., van der Werf, J. M. E., and
Brinkkemper, S. (2016). The use and effectiveness
of user stories in practice. In International working
conference on requirements engineering: Foundation
for software quality, pages 205–222. Springer.
Lucassen, G., Robeer, M., Dalpiaz, F., Van Der Werf, J.
M. E., and Brinkkemper, S. (2017). Extracting con-
ceptual models from user stories with visual narrator.
Requirements Engineering, 22(3):339–358.
Mich, L., Mariangela, F., and Pierluigi, N. I. (2004). Mar-
ket research for requirements analysis using linguis-
tic tools. Requirements Engineering Journal (RE J),
9(1):40–56.
Nayak, A., Kesri, V., and Dubey, R. K. (2020). Knowledge
graph based automated generation of test cases in soft-
ware engineering. In 7th ACM IKDD CoDS and 25th
COMAD. ACM IKDD CoDS.
Negro, A. (2021). Graph-powered machine learning. Si-
mon and Schuster.
Neo4j (2012). Neo4j - the world’s leading graph database.
Nguyen, T. H., Grundy, J., and Almorsy, M. (2015). Rule-
based extraction of goal-use case models from text. In
Joint Meeting on Found. of Software Engineering.
Pohl, K. (2010). Requirements Engineering. Springer.
Extracting Queryable Knowledge Graphs from User Stories: An Empirical Evaluation
691

Saini, R., Mussbacher, G., Guo, J. L., and Kienzle, J.
(2020). Domobot: a bot for automated and interac-
tive domain modelling. In International conference
on model driven engineering languages and systems:
companion proceedings.
Sanders-Blackman, J. (2021). The 3 c’s of user stories are
missing a c.
Smajevic, M. and Bork, D. (2021). From conceptual models
to knowledge graphs: a generic model transformation
platform. In Conference on Model Driven Engineer-
ing Languages and Systems Companion. IEEE.
Wautelet, Y., Heng, S., Kolp, M., and Mirbel, I. (2014).
Unifying and extending user story models. In Inter-
national conference on advanced information systems
engineering. Springer.
Yue, T., Briand, L. C., and Labiche, Y. (2011). A system-
atic review of transformation approaches between user
requirements and analysis models. Requirements en-
gineering, 16(2):75–99.
Zaki-Ismail, A., Osama, M., Abdelrazek, M., Grundy, J.,
and Ibrahim, A. (2022). Rcm-extractor: an automated
nlp-based approach for extracting a semi formal repre-
sentation model from natural language requirements.
Automated Software Engineering, 29(1):1–33.
ENASE 2023 - 18th International Conference on Evaluation of Novel Approaches to Software Engineering
692
