
Latency-Aware Cost-Efficient Provisioning of
Composite Applications in Multi-Provider Clouds
Daniel Chaves Temp
1,3 a
, Igor Ferrazza Capeletti
3 b
, Ariel Goes de Castro
3 c
,
Paulo Silas Severo de Souza
2 d
, Arthur Francisco Lorenzon
4 e
, Marcelo Caggiani Luizelli
3 f
and
F
´
abio Diniz Rossi
1,3 g
1
Federal Institute Farroupilha, Alegrete, Brazil
2
Pontifical Catholic University of Rio Grande do Sul, Porto Alegre, Brazil
3
Federal University of Pampa, Alegrete, Brazil
4
Federal University of Rio Grande do Sul, Porto Alegre, Brazil
Keywords:
Cloud, Cost, Heuristics, Latency, Service Placement, Simulation.
Abstract:
Composite applications have the versatility of maintaining several functions and services geographically dis-
tributed but being part of the same application. This particular software architecture fits in very easily with
the model of distributed regions present in most cloud players. In this way, the search for leasing applications
at the lowest cost becomes a reality, given that the application services can be in different players at a lower
cost, as long as the performance metrics of the application as a whole are met. Performing provisioning de-
cisions considering the allocation cost of different providers and the latency requirements of applications is
not trivial, as these requirements are often conflicting, and finding good trade-offs involves the analysis of a
large-scale combinatorial problem. Accordingly, this paper presents Clover, a placement algorithm that em-
ploys score-based heuristic procedures to find the best provisioning plan for hosting composite applications in
geographically distributed cloud environments. Simulated experiments using real latency traces from Amazon
Web Services indicate that Clover can achieve near-optimal results, reducing latency issues and allocation cost
by up to 74.47% and 21.2%, respectively, compared to baseline strategies.
1 INTRODUCTION
In the context of cloud computing, composite ap-
plications (or decoupled applications) are built us-
ing, in general, microservices architecture (Katsuno
and Takahashi, 2015). In a microservices architec-
ture (Raj et al., 2023), an application is divided into
smaller, independent services that can be developed,
deployed, and scaled independently of each other. It
allows for greater flexibility and faster development
and deployment cycles, as each service can be up-
dated or changed without affecting the other services.
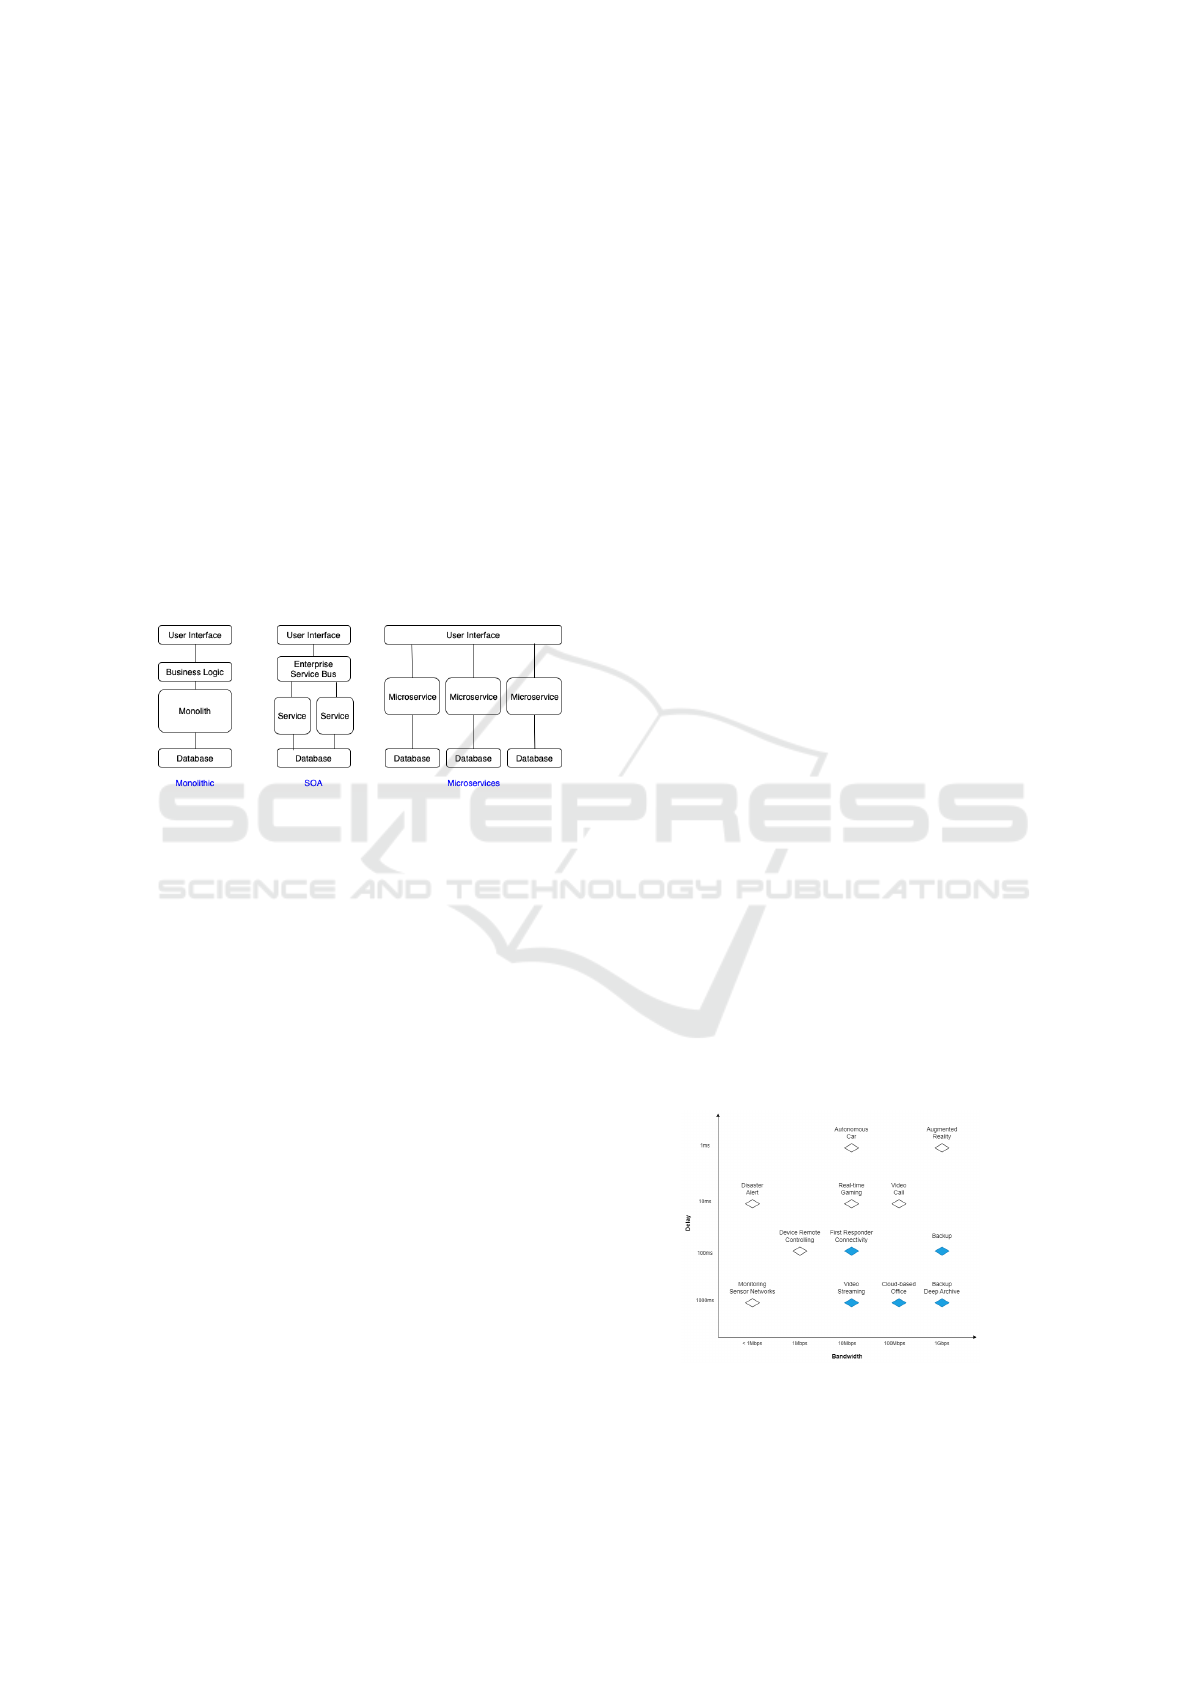
Figure 1 presents an evolution of software architec-
a
https://orcid.org/0000-0002-9724-1331
b
https://orcid.org/0000-0002-8712-2195
c
https://orcid.org/0000-0002-5391-5082
d
https://orcid.org/0000-0003-4945-3329
e
https://orcid.org/0000-0002-2412-3027
f
https://orcid.org/0000-0003-0537-3052
g
https://orcid.org/0000-0002-2450-1024
tures, starting from the monolith in which all soft-
ware functions and components are compiled into a
single block, which makes maintenance and scalabil-
ity issues more difficult. Software-Oriented Archi-
tectures (SOA) allow the separation of business rules
and interfaces so that the application is more flexible
in terms of scalability and maintenance, as the com-
ponents can be treated independently. Microservices
consist of an evolution of SOA, which operates at a
smaller granular level, and functions can be instanti-
ated and released on demand, allowing high perfor-
mance in addition to fast scalability and independent
maintenance. In SOA (Ilie et al., 2022), the decom-
position of the application into individual services
now allows creating, testing, and tuning of services
simultaneously, eliminating monolithic development
cycles. The problem is that centralizing communi-
cation on an Enterprise Service Bus (EBS) (Chaud-
hari et al., 2016) represented a single point of failure
for the entire system—basically, another monolithic
Temp, D., Capeletti, I., Goes de Castro, A., Severo de Souza, P., Lorenzon, A., Luizelli, M. and Rossi, F.
Latency-Aware Cost-Efficient Provisioning of Composite Applications in Multi-Provider Clouds.
DOI: 10.5220/0011995600003488
In Proceedings of the 13th International Conference on Cloud Computing and Services Science (CLOSER 2023), pages 297-305
ISBN: 978-989-758-650-7; ISSN: 2184-5042
Copyright
c
2023 by SCITEPRESS – Science and Technology Publications, Lda. Under CC license (CC BY-NC-ND 4.0)
297
structure that could congest the whole development
cycle. Unlike services in SOA, microservices can
communicate with each other, usually stateless, mak-
ing software more fault tolerant and less dependent
on a single ESB. In addition, microservices can com-
municate through application programming interfaces
(APIs). In terms of cost and scalability, the advan-
tage of this type of application lies on these microser-
vices may be hosted on different servers, in different
locations, and may even be built using different tech-
nologies, designed to communicate with each other
and work together to provide the desired functionality
(Blinowski et al., 2022). As this type of application
can be easily scaled and modified as needed without
requiring a complete overhaul of the entire applica-
tion, it makes them well-suited for use in cloud com-
puting environments, where resources can be added
or removed as needed to meet changing demand.
Figure 1: Software architectures.
Even more so, it is the ideal scenario for compos-
ite applications when we are working on cloud play-
ers that maintain data centers in geographically dis-
tributed regions but still maintain acceptable levels of
performance in terms of network latency between re-
gions, because a composite application presents a fea-
ture that can be used to reduce costs (Vu et al., 2019).
As the software architecture is decoupled, each piece
of software can be placed in a geographically dif-
ferent location as long as these entities’ latencies do
not exceed the service level agreement established
to the application (Pelle et al., 2019). This paper
presents Clover, a placement algorithm that employs
score-based heuristic procedures to reduce the alloca-
tion cost incurred by provisioning composite applica-
tions in geo-distributed cloud environments without
overlooking the application latency requirements. In
summary, we make the following contributions: (i)
We present a conceptual model that captures the cost
and latency requirements considered during the pro-
visioning of composite applications in geo-distributed
clouds (§4), (ii) we propose a novel placement algo-
rithm (Clover) that introduces score-based functions
for reducing allocation cost and latency issues during
the provisioning of composite applications (§5), and
(iii) we conduct simulated experiments using real la-
tency values from Amazon Web Services that demon-
strate that Clover achieves near-optimal results, re-
ducing cost and latency issues by up to 74.47% and
21.2%, respectively, compared to baseline strategies
(§6).
2 BACKGROUND
Cloud environments (De Donno et al., 2019) have be-
come a de facto standard in providing services via
the Internet. Services are distributed via the Internet
through a cloud services platform with per-use pric-
ing. Paying only for what the customer uses helps to
reduce operating costs, run processes more efficiently,
and make changes as the business needs evolve. One
of the most important benefits supplied by cloud com-
puting is the capacity to scale elastically, regardless of
geographic origin (Liu et al., 2018). It can provide a
much better experience to your customers simply and
quickly. But it is not always offering a minimal cost,
as it could be. Depending on the choices made by the
cloud operators, whoever deployed the service may be
paying more than they should. Public cloud providers
offer multiple regions that serve as access points dis-
tributed worldwide. These regions deliver for services
to be in places closer to customers in order to decrease
latency in accessing services. However, the values for
maintaining a hosted service differ from region to re-
gion (Kozina and Kozin, 2022). It is due to the lo-
cal cost of energy consumption, air conditioning, and
legislation, among others. It would always be advan-
tageous to host services in the cheapest regions if not
for the latency cost imposed by the distance that the
region may be from the customer. The inverse is also
a problem because if the cloud operators only con-
sider the service’s latency, they may be paying more
to maintain a minimum latency much higher than that
needed to offer the service.
Figure 2: Comparison of QoS requirements (bandwidth and
delay) for different cloud services.
CLOSER 2023 - 13th International Conference on Cloud Computing and Services Science
298

Therefore, a balance between cost and latency
is necessary for cost-benefit in the pay-per-use idea.
Figure 2 reinforces our argument. Many services are
delay tolerant as long as there is sufficient bandwidth.
In this way, applications can be placed in many ser-
vices, and their services could be placed in different
cheaper regions that are further away from the cus-
tomers so that the quality of service would not be
degraded. This distribution of the application at dif-
ferent points of the infrastructure is possible based
on composite applications. As we can see in Fig-
ure 1, software models and architectures that sepa-
rate frontends and backends into distinct elements of
the same application have benefited from the multi-
region environment of cloud players. Applications
developed under frameworks such as model-view-
controler (MVC) (Mufid et al., 2019) or model-view-
viewmodel (MVVM) (Sheikh and Sheikh, 2020), and
more recently Microservices, can be hosted in phys-
ically distributed locations but still be logically com-
posed.
3 RELATED WORK
Composite applications in cloud environments con-
nect several smaller services into a larger and more
complex application. The deployment of composite
applications that maintain an excellent quality of ser-
vice is a very complex action. Several works have
been studying the problem of placement of decom-
posed applications in several services (Wen et al.,
2017) (Mao et al., 2013). These composite applica-
tions can be deployed and operate in the cloud, taking
advantage of the scalability, flexibility, and other ad-
vantages cloud computing offers. Application decou-
pling is a microservices design pattern that increases
application scalability, availability, and efficiency is
more resilient to failures and can be scaled more effi-
ciently by splitting an application into minor services
that can be deployed independently (Shi et al., 2020).
One offering an application over multi-region
cloud environments also has the choice over which
cloud player their application will be deployed (War-
ren et al., 2016). Generally, this choice falls on just
one player, which offers the lowest price with accept-
able latency. It is a good practice when the applica-
tion is not composed of different entities. In compos-
ite applications, the choice of cloud player or players
becomes more granular and can further improve the
cost of application maintenance by distributing ser-
vices across different cloud players. In situations like
that, one of the main goals is finding the provision-
ing plan that incurs the smallest amount of different
cloud players’ resources so that the allocation cost is
as low as possible. To handle such a scenario, The
work (Faticanti et al., 2020) delivers an arrangement
strategy that assigns microservice-based applications
on federated cloud environments based on topological
sorting techniques that determine the order in which
microservices are allocated by their function in their
application’s workflow.
For administrators offering their applications,
choosing the right place to host them is essential
to balancing allocation cost and application perfor-
mance. Whereas allocating applications closer to the
customers guarantees low latency, high prices can
be imposed, and places with low costs can impose
high latencies. In such a scenario, the work (Mah-
mud et al., 2020) presents an allocation procedure that
specifies whether applications should be hosted by the
cloud resources to improve the profit while supply-
ing acceptable performance levels for end-users. The
work (Anglano et al., 2020) discusses an allocation
scheme where cloud providers collaborate to maxi-
mize their profit by sharing resources to process time-
varying workloads. The work (Li et al., 2022) gives
a placement and scheduling framework, which lever-
ages the collaboration between multiple cloud play-
ers to handle applications according to their deadline
and allocation cost. The review of the papers men-
tioned above indicates a need to investigate the ser-
vice deployment problem considering the response
time of composite applications to accurately measure
their real performance in multi-cloud.
4 SYSTEM MODEL
This section describes the composite application pro-
visioning scenario approached in this work. First, we
present the attributes and behaviors of the infrastruc-
ture’s elements. Then, we detail our optimization ob-
jective. Table 1 summarizes the notations.
The network infrastructure comprises a set of ge-
ographically distributed regions, following the global
infrastructure model employed by large-scale cloud
providers such as Amazon Web Services. The net-
work infrastructure is represented by an undirected
graph G = (R , L), where R represents the set of re-
gions and L denotes the set of network links that in-
terconnect the different regions. In this setting, a net-
work link is modeled as L
f
= {g
f
}, where g
f
repre-
sents L
f
’s latency. To facilitate the computation of
network operations, let us define three generic helper
functions. The first function, λ(E), encapsulates the
Dijkstra algorithm (Dijkstra et al., 1959) for finding
the shortest network path interconnecting a vector E
Latency-Aware Cost-Efficient Provisioning of Composite Applications in Multi-Provider Clouds
299

Table 1: Summary of notations used in this paper.
Symbol Description
G Network infrastructure
R Set of regions
L Set of network links
P Set of infrastructure providers
D Set of data centers
A Set of applications
S Set of services
U Set of users
g
f
L
f
’s latency
u
j
A
j
’s user
w
j
A
j
’s services
z
j
A
j
’s latency
s
j
A
j
’s latency SLA
n
j
A
j
’s communication path
h
k
S
k
’s demand
t
k
S
k
’s features specification
c
i
D
i
’s capacity
d
i
D
i
’s demand
r
i
D
i
’s region
x
i,k
Service placement matrix
λ(E) Shortest path finder
ψ(F ) Path’s accumulated delay
ξ(E1, E2, T ) Delay threshold compliance test
α(D
i
, S
k
) Cost for hosting S
k
on D
i
β(A
j
) A
j
’s SLA compliance
φ(D
i
) D
i
’s capacity limit compliance
representing any two or more elements within the in-
frastructure (e.g., users, services, regions, etc.). The
second function, ψ(F ), calculates the accumulated
delay of any network path F found with λ(E). The
third function, ξ(E1, E2, T ) (Eq. 1), checks whether
the delay between two elements (E1 and E2) is less
than equal a given threshold T .
ξ(E1, E2, T ) =
(
1 if ψ(λ([E1, E2])) 6 T
0 otherwise.
(1)
In our modeling, the computing infrastructure
hosts a set of applications A, which are accessed
by a set of users U, distributed across the vari-
ous existing regions. An application is denoted as
A
j
= {u
j
, w
j
, z
j
, s
j
, n
j
}. This structure carries two at-
tributes referencing other model components: u
j
ref-
erences A
j
’s user, and w
j
references A
j
’s list of ser-
vices. Complementarily, z
j
represents A
j
’s latency in-
curred in the communication between the services in
w
j
, and s
j
denotes A
j
’s latency Service Level Agree-
ment (SLA), which indicates the maximum accept-
able latency. The inter-service communication related
to an application A
j
is represented by a list n
j
pop-
ulated by the region where A
j
’s user is located and
the regions where A
j
’s services are provisioned. The
shortest network path connecting the elements in n
j
is found through λ(n
j
) and z
j
is calculated through
ψ(λ(n
j
)). In this context, β(A
j
), described in Eq. 2,
determines whether A
j
experiences an SLA violation
based on its SLA and its actual latency. Although
this modeling has certain simplifications (e.g., each
user accessing a single application, as in (Souza et al.,
2022)), it can represent several provisioning scenarios
since applications can be composed of single or mul-
tiple services with diverse communication patterns.
β(A
j
) =
(
1 if z
j
> s
j
0 otherwise.
(2)
The application provisioning consists of mapping
a set of services S to a set of data centers D owned
by a set of providers P . We represent a service
as S
k
= {h
k
,t
k
}, where h
k
is the computational de-
mand required to provision S
k
and t
k
is the specifica-
tion of S
k
’s features. A data center is represented as
D
i
= {c
i
, d
i
, r
i
}, where attributes c
i
, d
i
, and r
i
repre-
sent D
i
’s capacity, demand, and region, respectively.
Based on this, the service placement is represented by
x
i,k
(Eq. 3).
x
i,k
=
(
1 if data center D
i
hosts S
k
0 otherwise.
(3)
As providers can define different cost policies
according to the specifications of hosted services,
α(D
i
, S
k
) represents the cost to host a service S
k
in
a data center D
i
. In addition, as data centers have
limited capacity, the helper function φ(D
i
), described
in Eq. 4, checks whether a given placement scheme
respects the capacity constraints of a data center D
i
(i.e., if services are not provisioned in such a way that
D
i
’s demand does not exceed its capacity).
φ(D
i
) =
(
1 if
∑
|S|
k=1
h
k
· x
i,k
> c
i
0 otherwise.
(4)
We consider a twofold objective function (Eq. 5),
which minimizes the number of SLA violations of ap-
plications in A while reducing the allocation cost of
services in S , subject to two constraints. While the
first constraint (Eq. 6) ensures that each service is pro-
visioned only in one data center, the second constraint
(Eq. 7) ensures that the data centers’ demands do not
exceed their capacity.
Min: norm
|A|
∑
j=1
β(A
j
)
!
+ norm
|D|
∑
i=1
|S|
∑
k=1
α(D
i
, S
k
) · x
i,k
!
(5)
Subject to:
|D|
∑
i=1
x
i,k
= 1, ∀k ∈ {1, ..., |S|} (6)
CLOSER 2023 - 13th International Conference on Cloud Computing and Services Science
300

φ(D
i
) = 0, ∀i ∈ {1, ..., |D|} (7)
5 CLOVER DESIGN
This section presents Clover, an algorithm that performs
cost and latency optimized decisions while provisioning
composite applications in geo-distributed data centers.
Algorithm 1: Clover algorithm.
1 A
0
= Applications sorted by Eq. 8 (desc.)
2 foreach A
j
∈ A
0
do
3 foreach S
k
∈ w
j
do
4 D
0
= Data centers sorted by Eq. 15
(desc.)
5 foreach D
i
∈ D
0
do
6 if c
i
≥ d
i
+ h
k
then
7 Provision S
k
on D
i
8 break
9 end
10 end
11 end
12 end
Clover employs a depth mapping approach, pro-
visioning all the services of a given application be-
fore moving on to the services owned by the others.
Consequently, one of Clover’s main decisions is to de-
fine the application provisioning order since a careless
application arrangement might cause applications to
be improperly provisioned, occupying resources that
others could better use. Clover employs a score func-
tion (Eq. 8) that defines the application provisioning
order based on two factors: (i) the network proximity
of an application’s user to the data centers and (ii) the
potential allocation cost reduction achieved by priori-
tizing an application’s provisioning (Alg. 1, line 1).
∂(A
j
) = norm(ρ(A
j
)) + norm(θ(A
j
)) (8)
The first application sorting criterion (Eq. 9) aims
to reduce SLA violations. For this, applications with
fewer nearby resources are prioritized since postpon-
ing their provisioning increases the chances of other
applications using those resources, forcing them to
be provisioned in distant data centers that would vi-
olate the SLAs. Although simply counting the num-
ber of data centers whose latency does not violate
the SLAs could work in homogeneous infrastructures,
geo-distributed environments can comprise data cen-
ters with different capacities—as such, solely looking
at the number of nearby data centers could bring mis-
leading insights. Therefore, Clover’s sorting criterion
evaluates the amount of resources close enough to the
application’s user to couple with the application’s la-
tency SLA.
ρ(A
j
) =
1
∑
|D|
i=1
(c
i
− d
i
) · ξ(r
i
, u
j
, s
j
)
(9)
The second application sorting criterion (Eq. 10)
aims to reduce the applications’ allocation cost. First,
Clover prioritizes applications composed of services
whose allocation costs vary significantly from one
data center to another (Eq. 11), as prioritizing them
can lead to higher cost savings than applications
whose allocation costs are similar for all data cen-
ters. In addition, this sorting criterion considers the
number of data centers with the lowest cost (Eq. 12)
since the smaller the number of cheap data centers,
the greater the risk of losing potential profit if other
applications use their resources.
θ(A
j
) =
∑
S
k
∈w
j
ν(S
k
) · µ(S
k
) (10)
ν(S
k
) = max(1, max(γ(S
k
)) − min(γ(S
k
))) (11)
µ(S
k
) =
1
|[b | b ∈ γ(S
k
) ∧ χ(b, γ(S
k
)) = 1]| · min(γ(S
k
))
(12)
χ(A, B) =
(
1 if A = min(B)
0 otherwise.
(13)
γ(S
k
) = {α(D
i
, S
k
) | D
i
∈ D} (14)
After sorting applications, Clover iterates over the
list of services of each application to host them within
the infrastructure (Alg. 1, lines 3–10). At this point,
Clover employs a score function (Eq. 15) that ranks
candidate data centers to host each service (Alg. 1,
line 4). Clover’s data center sorting approach is based
on two criteria: (i) whether the data center is close
enough to the application’s user and any previously
provisioned application service to respect the applica-
tion SLA, and (ii) the cost charged by the data center
to host the service. Clover assumes that data centers
cannot host services whose demand exceeds their ca-
pacity. Therefore, when iterating over the sorted list
of candidate data centers to host a given service, it
first checks whether it has sufficient available capac-
ity to host the service before starting the provisioning
procedure (Alg. 1, line 6).
ℵ(D
i
, A
j
, S
k
) = ξ(r
i
, w
j,k−1
, s
j
) + norm
1
α(D
i
, S
k
)
(15)
Latency-Aware Cost-Efficient Provisioning of Composite Applications in Multi-Provider Clouds
301
6 PERFORMANCE EVALUATION
This section details the experiments conducted to as-
sess Clover while provisioning composite applica-
tions on geo-distributed cloud data centers. First, we
describe our research methodology (§6.1). Then, we
present a sensitivity analysis that calibrates the con-
figurable parameters of NSGA-II—one of the base-
line strategies (§6.2). Finally, we discuss the obtained
results (§6.3).
6.1 Experiments Description
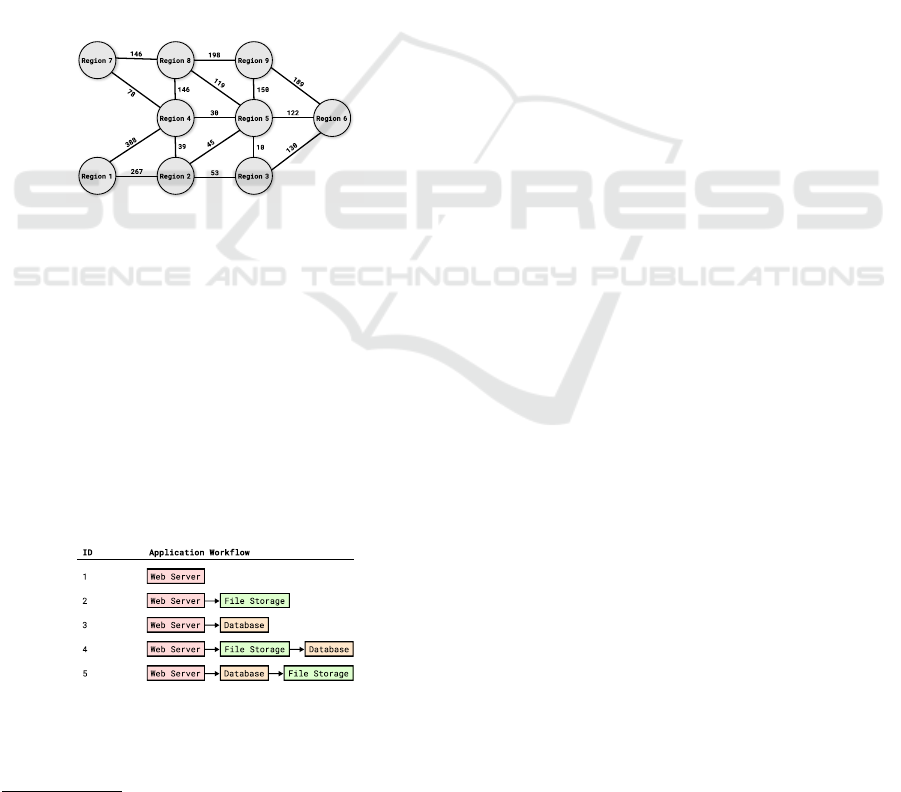
We consider a geo-distributed infrastructure com-
posed of nine regions interconnected by network links
whose latency values are specified in Figure 3. La-
tency values are provided by CloudPing
1
and repre-
sent the 50th percentile among annual observations
of latency between Amazon Web Services regions.
Figure 3: Network Latency between regions.
In our dataset, three infrastructure providers man-
age six data centers each. Data centers are evenly
positioned across the nine regions, with capacity =
{60, 120}—we consider such abstract units to rep-
resent data center capacities as real values could not
be found publicly. Data centers must host 60 com-
posite applications totaling 132 services. The sample
application workflow specifications used in the exper-
iments are presented in Figure 4. In this setting, ap-
plications have three distinct SLAs = {100, 150, 200},
and services have heterogeneous demands = {2, 4, 6,
8}, both uniformly distributed.
Figure 4: Application workflows used in the evaluation.
We compare Clover against three approaches. The
first two baseline strategies, Best Fit and Worst Fit,
1
https://www.cloudping.co/
allow us to evaluate the impact of extreme provision-
ing decisions on the infrastructure. While Best Fit
focuses on consolidating services on a subset of data
centers, Worst Fit does the opposite, distributing ser-
vices across the infrastructure as much as possible.
As both Best Fit and Worst Fit are naive strategies
that make no optimized decision for the addressed
scenario, our evaluation also considers a metaheuris-
tic called Non-Dominated Sorting Genetic Algorithm
II (NSGA-II) (Deb et al., 2002), which employs
a population-based search procedure to find Pareto-
optimal solutions. We chose NSGA-II over other al-
gorithms that find Pareto-optimal solutions as its effi-
ciency has been shown in many multi-objective prob-
lems (Deb et al., 2002; Aral et al., 2021). We com-
pare the analyzed strategies regarding latency SLA
violations and allocation cost (see Section 4 for de-
tails). Our simulations are primarily based on fea-
tures provided by NetworkX (Hagberg et al., 2008),
a well-known Python library that allows modeling
large-scale network topologies. Our research strives
to follow open science principles. Therefore, com-
panion material publicly available on GitHub
2
con-
tains the dataset, source code, and instructions for re-
producing our results.
6.2 NSGA-II’s Sensitivity Analysis
We conducted a sensitivity analysis to determine the
best parameters for the NSGA-II algorithm. Without
loss of generality, we define the population size as 400
and crossover probability to 100%. The algorithm
was configured with the Uniform Crossover and Poly-
nomial Mutation methods (Blank and Deb, 2020).
The initial population was set using a Random-Fit Al-
gorithm (Souza et al., 2022). Our analysis evaluates
different population sizes = {100, 200, 300, ..., 1500}
and mutation probabilities = {0%, 10%, 20%, 30%,
..., 100%}. Each parameter combination ω was ac-
cessed by a cost function ∆ (Eq. 16), which considers
both the normalized number of SLA violations and
the allocation cost achieved by the solutions. In total,
we evaluated 165 parameter combinations. As indi-
cated in Figure 5, the NSGA-II algorithm achieved
the lowest cost ∆ with 1200 generations and mutation
probability = 10%—accordingly, we used this config-
uration in the evaluation of Section 6.3.
∆(ω) = norm
ω
SLAViolations
+norm
ω
allocationCost
(16)
CLOSER 2023 - 13th International Conference on Cloud Computing and Services Science
302

Figure 5: NSGA-II sensitivity analysis results.
6.3 Results and Discussion
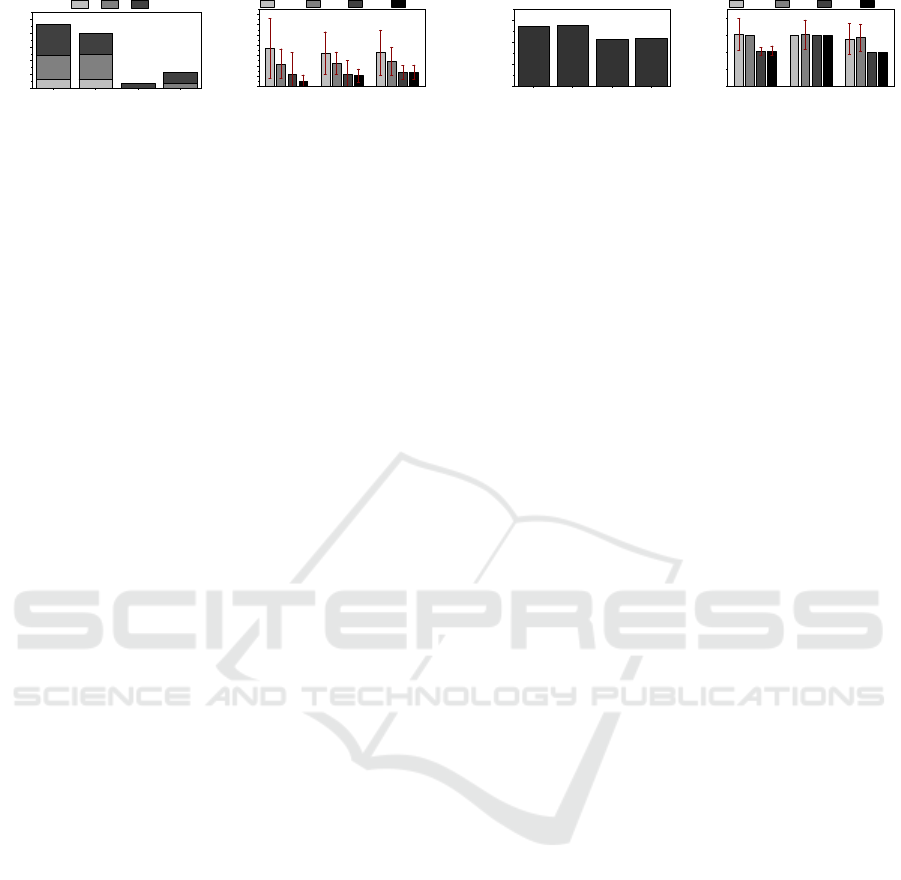
6.3.1 Latency SLA Violations
Figures 6 (a) and (b) present the number of SLA vio-
lations during the execution of the evaluated place-
ment strategies. As expected, the naive algorithms
(Worst Fit and Best Fit) showed the worst results,
with roughly 4x more SLA violations than Clover
and NSGA-II. Although Best Fit and Worst Fit do
not incorporate SLA-optimized allocations, we can
make some observations about the impact of certain
resource management decisions based on such results.
As shown in Figure 6 (a), Best Fit’s consolidation
led to better outcomes than Worst Fit’s spread strat-
egy, especially for applications with larger service
sets. While demand distribution brings several ben-
efits (e.g., high availability and mitigation of satura-
tions at specific points in the infrastructure), if not
accompanied by SLA-aware policies, it can signifi-
cantly degrade users’ experience due to excessively
long response times, which nullify any other potential
benefits. As the number of SLA violations is com-
puted per application, preventing violations from ap-
plications with fewer services is easier since they nat-
urally have lower overall demand than applications
with more services. That being said, while Worst
Fit and Best Fit had a balanced number of SLA vi-
olations regardless of the application size (i.e., num-
ber of services), we can observe that Clover bene-
fited from this, achieving results closer to NSGA-
II’s Pareto -optimal outcome. Figure 6 (a) shows
that Clover could reduce the number of SLA vio-
lations of smaller applications, completely mitigat-
ing the violations from applications with a single ser-
vice. In addition, Figure 6 (b) shows that Clover pro-
vides more steady latency for applications, reaching
outcomes close to NSGA-II’s, unlike the naive algo-
rithms, which displayed a high standard deviation.
6.3.2 Allocation Cost
Figures 6 (c) and (d) present the application cost allo-
cation results. Like the SLA violation analysis, Worst
2
https://github.com/paulosevero/clover
Fit and Best Fit delivered the worst outcomes. Unlike
Clover and NSGA-II, Best Fit and Worst Fit exhibited
a high standard deviation related to allocation cost per
service, as they overlook this target metric (Figure 6
(d)). Best Fit’s slightly higher overall cost allocation
probably comes from its consolidation approach. If
Worst Fit decides to allocate a service in an expensive
data center, chances are that it will not use that data
center excessively, given its demand-spreading ap-
proach. Conversely, a careless decision in terms of al-
location cost performed by Best Fit can cause a more
significant impact, as it tends to host as many services
as possible in the same data center. As shown in Fig-
ure 6 (c), Clover’s provisioning decisions resulted in
an allocation cost increase of only 1.06% compared
to NSGA-II’s Pareto-optimal outcome. This positive
result derives primarily from two resource manage-
ment decisions. First, Clover prioritizes applications
with greater cost-saving potential and with a smaller
number of cheap data centers. Consequently, it avoids
wasting (potentially scarce) cheap resources with ap-
plications whose probable cost reduction is negligi-
ble. Second, Clover’s data center sorting scheme pri-
oritizes hosting services in data centers with the low-
est allocation cost as long as they don’t meet latency
SLAs.
7 CONCLUSION AND FUTURE
WORK
A software architecture that allows decomposing the
application into pieces of software, such as microser-
vices, consists of an organization that is very well
suited to the context of cloud computing. It occurs
because using multiple cloud providers in several lo-
cations, especially when deploying composite appli-
cations like microservices, can deliver many cost ben-
efits. First, it enables excellent flexibility in select-
ing cost-effective alternatives for specific microser-
vices or geographic regions. Each microservice may
have distinct resource requirements and performance
needs, so using different providers for different mi-
croservices can be more cost-efficient. Then, us-
ing multiple cloud providers in different regions can
also help optimize data transfer and reduce egress
costs, which can be a high cost when transferring
data between different regions. This paper analyzes
the latency-aware cost-efficient composite applica-
tion placement problem, introducing a novel model
that captures these objectives during the provision-
ing procedure. To tackle this challenging scenario,
we present Clover, a novel algorithm that leverages
score-based functions to optimize the placement of
Latency-Aware Cost-Efficient Provisioning of Composite Applications in Multi-Provider Clouds
303
W o r s t F i t B e s t F i t N S G A - I I C l o v e r
0
1 0
2 0
3 0
4 0
5 0
S L A V i o l a t i o n s
A l g o r i t h m
1 2 3
(a) SLA Violations per
Chain Size.
1 0 0
1 5 0
2 0 0
0
1 0 0
2 0 0
3 0 0
4 0 0
5 0 0
6 0 0
7 0 0
L a t e n c y
W o r s t F i t B e s t F i t N S G A - I I C l o v e r
L a t e n c y S L A
(b) Latency per SLA.
9 6 0 0 0
9 6 7 0 0
7 5 4 0 0
7 6 2 0 0
W o r s t F i t B e s t F i t N S G A - I I C l o v e r
0
4 × 1 0
4
7 × 1 0
4
1 × 1 0
5
A l l o c a t i o n C o s t
A l g o r i t h m
(c) Overall Allocation Cost.
W e b S e r v e r
F i l e S t o r a g e
D a t a b a s e
0
5 0
1 0 0
1 5 0
2 0 0
A l l o c a t i o n C o s t
W o r s t F i t B e s t F i t N S G A - I I C l o v e r
S e r v i c e T y p e
(d) Allocation Cost per Ser-
vice Type.
Figure 6: Experimental results comparing the evaluated strategies.
composite applications in geo-distributed cloud data
centers. Simulated experiments using real latency
traces from Amazon Web Services demonstrate that
Clover can achieve near-optimal results, reducing la-
tency issues and placement costs by 74.47% and
21.2%, respectively, compared to baseline strategies.
As future work, we indent to extend our approach,
considering other objectives such as high availabil-
ity, protecting applications against unfortunate events
such as cyberattacks and power outages, and mitigat-
ing vendor lock-in.
ACKNOWLEDGEMENT
This work was financed in part by the Coordenac¸
˜
ao
de Aperfeic¸oamento de Pessoal de N
´
ıvel Superior
- Brasil (CAPES) – Finance Code 001. Also,
this work was partially supported by Conselho
Nacional de Desenvolvimento Cient
´
ıfico e Tec-
nol
´
ogico – CNPq – 313111/2019-7, 404027/2021-
0. This work also received funding from S
˜
ao
Paulo Research Foundation (FAPESP) – 2021/06981-
0, 2020/05183-0, 2020/05115-4; and Rio Grande do
Sul Research Foundation (FAPERGS) – 19/2551-
0001266-7, 19/2551-0001224-1, 19/2551-0001689-
1, 21/2551-0000688-9.
REFERENCES
Anglano, C., Canonico, M., Castagno, P., Guazzone, M.,
and Sereno, M. (2020). Profit-aware coalition forma-
tion in fog computing providers: A game-theoretic ap-
proach. Concurrency and Computation: Practice and
Experience, 32(21):e5220. e5220 cpe.5220.
Aral, A., Demaio, V., and Brandic, I. (2021). Ares: Re-
liable and sustainable edge provisioning for wireless
sensor networks. IEEE Transactions on Sustainable
Computing, pages 1–12.
Blank, J. and Deb, K. (2020). Pymoo: Multi-objective op-
timization in python. IEEE Access, 8:89497–89509.
Blinowski, G., Ojdowska, A., and Przybyłek, A. (2022).
Monolithic vs. microservice architecture: A perfor-
mance and scalability evaluation. IEEE Access,
10:20357–20374.
Chaudhari, N., Bhadoria, R. S., and Prasad, S. (2016). In-
formation handling and processing using enterprise
service bus in service-oriented architecture system. In
2016 8th International Conference on Computational
Intelligence and Communication Networks (CICN),
pages 418–421.
De Donno, M., Tange, K., and Dragoni, N. (2019). Founda-
tions and evolution of modern computing paradigms:
Cloud, iot, edge, and fog. IEEE Access, 7:150936–
150948.
Deb, K., Pratap, A., Agarwal, S., and Meyarivan, T. (2002).
A fast and elitist multiobjective genetic algorithm:
Nsga-ii. IEEE Transactions on Evolutionary Compu-
tation, 6(2):182–197.
Dijkstra, E. W. et al. (1959). A note on two problems
in connexion with graphs. Numerische mathematik,
1(1):269–271.
Faticanti, F., Savi, M., Pellegrini, F. D., Kochovski, P.,
Stankovski, V., and Siracusa, D. (2020). Deployment
of application microservices in multi-domain feder-
ated fog environments. In 2020 International Con-
ference on Omni-layer Intelligent Systems (COINS),
pages 1–6.
Hagberg, A., Swart, P., and S Chult, D. (2008). Explor-
ing network structure, dynamics, and function using
networkx. Technical report, Los Alamos National
Lab.(LANL), Los Alamos, NM (United States).
Ilie, L., Pop, E., Caramihai, S. I., and Moisescu, M. A.
(2022). A soa based e-health services framework.
In 2022 E-Health and Bioengineering Conference
(EHB), pages 1–4.
Katsuno, Y. and Takahashi, H. (2015). An automated par-
allel approach for rapid deployment of composite ap-
plication servers. In 2015 IEEE International Confer-
ence on Cloud Engineering, pages 126–134.
Kozina, O. and Kozin, M. (2022). Simulation model of data
consistency protocol for multicloud systems. In 2022
IEEE 3rd KhPI Week on Advanced Technology (KhPI-
Week), pages 1–4.
Li, Y., Dai, W., Gan, X., Jin, H., Fu, L., Ma, H., and
Wang, X. (2022). Cooperative service placement
and scheduling in edge clouds: A deadline-driven ap-
proach. IEEE Transactions on Mobile Computing,
21(10):3519–3535.
Liu, J., Qiao, J., and Zhao, J. (2018). Femcra: Fine-grained
elasticity measurement for cloud resources allocation.
In 2018 IEEE 11th International Conference on Cloud
Computing (CLOUD), pages 732–739.
Mahmud, R., Srirama, S. N., Ramamohanarao, K., and
Buyya, R. (2020). Profit-aware application place-
CLOSER 2023 - 13th International Conference on Cloud Computing and Services Science
304

ment for integrated fog–cloud computing environ-
ments. Journal of Parallel and Distributed Comput-
ing, 135:177–190.
Mao, Z., Yang, J., Shang, Y., Liu, C., and Chen, J. (2013).
A game theory of cloud service deployment. In 2013
IEEE Ninth World Congress on Services, pages 436–
443.
Mufid, M. R., Basofi, A., Al Rasyid, M. U. H., Rochiman-
syah, I. F., and rokhim, A. (2019). Design an mvc
model using python for flask framework development.
In 2019 International Electronics Symposium (IES),
pages 214–219.
Pelle, I., Czentye, J., D
´
oka, J., and Sonkoly, B. (2019). To-
wards latency sensitive cloud native applications: A
performance study on aws. In 2019 IEEE 12th Inter-
national Conference on Cloud Computing (CLOUD),
pages 272–280.
Raj, P., Vanga, S., and Chaudhary, A. (2023). Design, De-
velopment, and Deployment of Event&x2010;Driven
Microservices Practically, pages 129–142.
Sheikh, W. and Sheikh, N. (2020). A model-view-
viewmodel (mvvm) application framework for hear-
ing impairment diagnosis - type dependency architec-
ture. In 2020 Intermountain Engineering, Technology
and Computing (IETC), pages 1–6.
Shi, T., Ma, H., Chen, G., and Hartmann, S. (2020).
Location-aware and budget-constrained service de-
ployment for composite applications in multi-cloud
environment. IEEE Transactions on Parallel and Dis-
tributed Systems, 31(8):1954–1969.
Souza, P.,
ˆ
Angelo Crestani, Rubin, F., Ferreto, T., and
Rossi, F. (2022). Latency-aware privacy-preserving
service migration in federated edges. In International
Conference on Cloud Computing and Services Sci-
ence, pages 288–295.
Vu, T., Mediran, C. J., and Peng, Y. (2019). Measure-
ment and observation of cross-provider cross-region
latency for cloud-based iot systems. In 2019 IEEE
World Congress on Services (SERVICES), volume
2642-939X, pages 364–365.
Warren, M. S., Skillman, S. W., Chartrand, R., Kelton, T.,
Keisler, R., Raleigh, D., and Turk, M. (2016). Data-
intensive supercomputing in the cloud: Global analyt-
ics for satellite imagery. In 2016 Seventh International
Workshop on Data-Intensive Computing in the Clouds
(DataCloud), pages 24–31.
Wen, Z., Cała, J., Watson, P., and Romanovsky, A. (2017).
Cost effective, reliable and secure workflow deploy-
ment over federated clouds. IEEE Transactions on
Services Computing, 10(6):929–941.
Latency-Aware Cost-Efficient Provisioning of Composite Applications in Multi-Provider Clouds
305
