
Does the Intelligent Driver Model Adequately Represent Human
Drivers?
Zeyu Mu, Fatemeh Jahedinia and B. Brian Park
Link Lab and Department of Engineering Systems and Environment, University of Virginia,
Keywords:
Intelligent Driver Model, Human Drivers, Microscopic Simulation, Mixed Traffic Evaluation.
Abstract:
The Intelligent Driver Model (IDM) is one of the widely used car-following models to represent human drivers
in mixed traffic simulations. However, the standard IDM performs too well in energy efficiency and comfort
(acceleration) compared with real-world human drivers. In addition, many studies assessed the performance
of automated vehicles interacting with human-driven vehicles (HVs) in mixed traffic where IDM serves as
HVs based on the assumption that the IDM represents an intelligent human driver that performs not better
than automated vehicles (AVs). When a commercially available control system of AVs, Adaptive Cruise
Control (ACC), is compared with the standard IDM, it is found that the standard IDM generally outperforms
ACC in fuel efficiency and comfort, which is not logical in an evaluation of any advanced control logic with
mixed traffic. To ensure the IDM reasonably mimics human drivers, a dynamic safe time headway concept is
proposed and evaluated. A real-world NGSIM data set is utilized as the human drivers for simulation-based
comparisons. The results indicate that the performance of the IDM with dynamic time headway is much closer
to human drivers and worse than the ACC system as expected.
1 INTRODUCTION
A human driver model is a key component in rep-
resenting driver characteristics in microscopic traffic
simulations. This is because the assessment of vehi-
cle safety, energy efficiency, and traffic characteristics
is highly associated with the reliability of the human
driver models. Generally, the car-following model of
human drivers estimates the velocity/acceleration ac-
cording to the velocity/acceleration of its preceding
vehicle, and the driver characteristics is represented
by standard parameters or calibrated parameters
based on real-world data. The commonly used car-
following models are Gazis-Herman-Rothery (GHR)
model (Gazis et al., 1959), Optimal Vehicle Model
(OVM) (Bando et al., 1995) and Intelligent Driver
Model (IDM) (Treiber et al., 2000). These models can
effectively capture drivers’ basic behaviors without
requiring much load on the mathematical framework.
Due to the collision-free characteristics and mathe-
matical efficiency of the IDM, many studies have em-
ployed the IDM to represent the car-following behav-
iors of human drivers in microscopic traffic simula-
tion, especially mixed traffic simulation. To utilize
the IDM as human drivers, the IDM is supposed to
describe the microscopic dynamics of the individual
drivers as well as macroscopic aspects of traffic flow.
However, the complexity and uncertainty of human
drivers present a great challenge for IDM to capture
their characteristics.
The logic behind the IDM is to model the reac-
tions of a human driver to his/her preceding vehi-
cle’s motions (e.g., speed and distance) correspond-
ing to the desire to achieve the desired speed, mean-
while, keeping a safe gap from the preceding vehi-
cle and collision precaution of human drivers in re-
ality. The characteristics of drivers are defined by
parameters, e.g., maximum acceleration/deceleration,
desired speed, safe time headway, and minimum gap,
which can be calibrated with empirical data or real-
world data. Many studies (Jiang et al., 2017; Bhat-
tacharyya et al., 2020; Sharma et al., 2021; Mu et al.,
2022) employ the IDM modeling homogeneous or
heterogeneous human drivers to evaluate the micro-
scopic or macroscopic characteristics of automated
vehicles (AVs) in the mixed traffic environment, e.g.,
fuel efficiency, driving comfort, traffic capacity and
stability. Generally, the IDM is utilized to model tra-
ditional human-driven vehicles interacting with con-
nected automated vehicles and connected human-
Mu, Z., Jahedinia, F. and Park, B.
Does the Intelligent Driver Model Adequately Represent Human Drivers?.
DOI: 10.5220/0011996800003479
In Proceedings of the 9th International Conference on Vehicle Technology and Intelligent Transport Systems (VEHITS 2023), pages 113-121
ISBN: 978-989-758-652-1; ISSN: 2184-495X
Copyright
c
2023 by SCITEPRESS – Science and Technology Publications, Lda. Under CC license (CC BY-NC-ND 4.0)
113

driven vehicles. In terms of the interaction with au-
tomated vehicles in traffic, (Rahman and Abdel-Aty,
2018; Wang et al., 2019; Sun et al., 2020; Guo and Jia,
2021; Ding et al., 2022) evaluated the performance of
traffic to show the impact of penetration of connected
automated vehicles (CAVs) in energy efficiency in
mixed traffic. The IDM parameters refer to the cal-
ibrated parameters of real-world human drivers. For
interactions with connected human-driven vehicles,
(Rahman and Abdel-Aty, 2018; Sharma et al., 2019;
Jiang et al., 2019; Zhang et al., 2020) evaluated the
safety and mobility of connected vehicles in mixed
traffic with connected human-driven vehicles. The
IDM was used to represent human driving behaviors
of connected vehicles, which can receive other con-
nected vehicles’ motion information. However, the
limitation of these studies is that neither of them eval-
uated or compared the performance of each control
mode under the mixed traffic of human drivers and
automated vehicles. Even though the capability of
IDM to represent the stochastic human drivers’ car-
following is not the focus of their research, it is impor-
tant for researchers to use a model that can represent
the human drivers for reliable assessment.
The most common method of employing IDM
serving as human drivers is calibrating parameters
with real-world human-driven vehicle data. Various
calibration methods have been investigated, e.g., least
squared errors or maximum likelihood, to find the
range or the distribution of these parameters to sim-
ulate different drivers’ characteristics (Kesting and
Treiber, 2008; Stern, ; Ro et al., 2018; Hegde et al.,
2021). However, these studies focus on identifying
the most fitting parameters in a long time driving and
do not consider that each driver’s characteristics could
change over time. To overcome these limitations, on-
line estimation methods are utilized to capture the dy-
namics of individual drivers by utilizing real-time in-
formation to update those model parameters. (Bhat-
tacharyya et al., 2020). However, the online esti-
mation method is more about an estimation of hu-
man driver behaviors online instead of modeling hu-
man driver behaviors in traffic simulation, consider-
ing the estimated parameters cannot be used to regen-
erate human behaviors for new simulations since the
estimated parameters are highly associated with the
preceding vehicles’ behaviors, which could change in
different simulations.
To improve IDM model applications, many re-
searchers (Bhattacharyya et al., 2020; Kesting et al.,
2010; Eggert et al., 2015; Yi et al., 2020) seek to in-
corporate realistic human driver features. The En-
hanced IDM (Kesting et al., 2010) presents an im-
proved IDM application for safety by preventing the
model from over-reactions even when the driver of
the preceding vehicle suddenly brakes with the max-
imum possible deceleration. The Foresighted Driver
Model (FDM) (Eggert et al., 2015) extends the IDM
by assuming that a driver balances the risk of possi-
ble collisions with travel time and the smoothness of
the ride. The models mentioned above focus on im-
proving the utilization of the IDM considering safety
when human drivers control the vehicles, while the
limitations are also their emphasis on the safety of
IDM aiming at generating smooth acceleration. How-
ever, those models neglect the fact that human drivers
actually could have aggressive behaviors. It is appar-
ent that few research investigated the uncertainties of
IDM parameters and their impacts on human driving
behaviors.
The objective of this research is to assess whether
the IDM adequately represents human driving behav-
iors. To achieve this objective, the performance be-
tween the IDM with calibrated parameters and real-
world human drivers is to be compared. In addition,
since ACC is one of the most commonly used au-
tomated control for AVs, which should have better
driving comfort and fuel economy than IDM for hu-
man drivers, the calibrated IDM is to be compared
with the ACC system. If the IDM does not repre-
sent human driving behaviors, this research is to con-
duct experimental design-based evaluations to iden-
tify key parameters affecting the performance of the
IDM and explore the feasibility of adjusting IDM pa-
rameters to adequately represent human driving be-
haviors. The rest of the paper is organized as follows.
Section 2 presents the car following models, includ-
ing the IDM and ACC, and how they are to be im-
plemented in this paper. Section 3 discussed the real-
world human driving data and the efforts given to cal-
ibrate the IDM and the comparison results among the
human drivers, IDM and ACC. In section 4, the im-
pacts of the IDM parameters are evaluated through an
experimental design covering all IDM parameters, an
attempt is made to choose an IDM parameter that can
best represent human driving behaviors, and the pro-
posed IDM model is validated using a NGSIM data
that is not used in the calibration. Finally, section 5
summarizes the findings of this research and discusses
future research.
2 CAR-FOLLOWING MODELS
2.1 Intelligent Driver Model
The standard Intelligent Driver Model (IDM) is a
deterministic car-following model that describes the
VEHITS 2023 - 9th International Conference on Vehicle Technology and Intelligent Transport Systems
114

dynamics of a human-driven subject vehicle by es-
timating its acceleration with respect to its speed,
speed difference, and the gap from the vehicle ahead.
The speed difference introduces additional caution to
make IDM crash-free. Five parameters, including
safe time headway, desired speed, maximum accel-
eration, maximum deceleration, and minimum dis-
tance, represent the car-following characteristic of the
driver, which can be calibrated with empirical or real-
world data. The estimated acceleration of the subject
vehicle is calculated by Eq. (1) and Eq. (2).
a
s
(t) = a
1 −(
v
s
(t)
v
d
)
4
−(
△ d
s,d
(v
s
,△ v
s
,t)
△ d
s
(t)
)
2
(1)
△ d
s,d
= s
0
+ max
v
s
(t) ∗T +
v
s
(t)· △ v
s
(t)
2
√
ab
, 0
(2)
Where △ d
s
(t) = d
p
(t) −d
s
(t) is the gap between
the subject vehicle’s (s) and its preceding vehicle (p)
at time t. △ v
s
(t) = v
p
(t) −v
s
(t) is the relative speed
difference of the subject vehicle and its preceding ve-
hicle at time t. d
s
(t), v
s
(t), a
s
(t) are the states rep-
resenting the position, speed, and acceleration of the
subject vehicle at time t, respectively. △ d
s,d
is the
desired bumper to bumper gap and △ d
s
(t) is the ac-
tual bumper to bumper gap at time t. The five pa-
rameters are interpreted as follows. v
d
is the desired
speed of the driver driving in free flow. a is the max-
imum acceleration. b represents a comfortable decel-
eration. s
0
is the minimum inter-vehicle gap that the
driver prefers to maintain at the stop. T is the safe
time headway.
2.2 Adaptive Cruise Control
Adaptive Cruise Control (ACC) (Vahidi and Eskan-
darian, 2003) is a commercially available advanced
driver assistance system of longitudinal control that
is designed for autonomous vehicles and aims at im-
proving safety, driving comfort, energy economy, and
traffic flow(Marsden et al., 2001). The ACC systems
utilize the measured motion of the preceding vehicle
and control the subject vehicle to maintain a safe gap.
A proportional-derivative (PD) controller is utilized
for the ACC systems in this study. The control input
u
e
(t) can be written with respect to the spacing error
e(t):
u(t) = k
p
e(t) + k
d
˙e(t) (3)
where k
p
, and k
d
are proportional and derivative gains
of the controller, respectively. The spacing error
e(t) = d
s
(t) −d
p
(t) is the difference between the de-
sired gap of the subject vehicle from the immediately
preceding vehicle d
p
and the actual gap d(t) at time
t. The desired gap d
d
(t) = v
s
(t) ·T
s
+ d
0
is calcu-
lated by the desired time headway T
s
, current speed
v
s
and standstill distance d
0
. The low-level controller
is modeled by a first-order lag τ to the acceleration
command u(t) and vehicle acceleration a(t) :
˙a(t) = −
a(t)
τ
+
u(t)
τ
(4)
In this study, we adopted system parameters, k
p
=
0.7,k
d
= 0.5, and τ = 0.3.
3 HUMAN DRIVERS DATA AND
IDM CALIBRATION ISSUE
3.1 NGSIM Dataset and Pre-Processing
To understand microscopic car following behaviors
of human drivers, the freeway US-101 data set from
the Next Generation Simulation (NGSIM) (Admin-
istration, 2017) was utilized. The data set consists
of about 2000 vehicles’ trajectories on five lanes ob-
served within a short distance (roughly 640 m) and for
the first 15 minutes of the dataset, and it reflects dense
highway flow, the transition between uncongested and
congested conditions, as well as full congestion. In
this study, we only utilized the data from uncongested
conditions to analyze car-following behaviors.
This NGSIM trajectory data includes the position
and speed profile of vehicles at a 0.1-second time in-
terval. Due to the propagation of the measurement er-
ror in the speed profiles, considerable noise (i.e., unre-
alistic jerks) in acceleration could be generated when
derived from the speed profiles of vehicles. There-
fore, in this study, the locally weighted scatterplot
smoothing (LOWESS) is applied to the speed profiles
of vehicles, and the size of the sliding window is cho-
sen as 2s. After smoothing, the speed profiles of ve-
hicles are less noisy, and the jerks are always below
15m/s
3
, which is more mechanically realistic (Punzo
et al., 2011).
3.2 Intelligent Driver Model
Calibration Issue
Several IDM calibration methods (Chen et al., 2010;
Ciuffo et al., 2014; Bhattacharyya et al., 2020; Al-
hariqi et al., 2022) to estimate the IDM parameters
were used in many studies where the parameter es-
timation employed optimization techniques to mini-
mize the error between the simulated and measured
output. Most studies focused on finding the constant
parameters of IDM to minimize the speed and gap er-
rors from human drivers. One limitation is that most
Does the Intelligent Driver Model Adequately Represent Human Drivers?
115
studies showed the error or how much improvement
the error is with the proposed method. In contrast,
limited studies show the actual performance compar-
ison of human drivers and IDM. Besides, the com-
plexity and uncertainty of human drivers’ character-
istics are neglected. To make a fair comparison with
other studies, the cost function which is the sum of the
square error of the simulated speed profiles and time
headway profiles of IDM from that of the actual hu-
man drivers is minimized during the IDM parameters
estimation.
The cost function which is related to the simulated
speed v
sim
, actual speed from data v
data
, the simu-
lated time headway T
sim
, actual time headway from
data T
data
, is defined in Eq.5
f (v
sim
,T
sim
) =
t
n
∑
t=0
[(v
sim
(t) −v
data
(t))
2
+(T
sim
(t) −T
data
(t))
2
]
(5)
min
v
sim
,T
sim
f (v
sim
,T
sim
)
s.t. T
min
≤ T ≤ T
max
v
dmin
≤ v
d
≤ v
dmax
s
0min
≤ s
0
≤ s
0max
a
min
≤ a ≤ a
max
b
min
≤ b ≤ b
max
(6)
Each parameter of the IDM is constrained by its max-
imum value and minimum value. The safe time head-
way, T , is in range of (0.8, 2) m; the desired speed,
v
d
, is in range of (20, 28) m/s; the maximum accel-
eration/deceleration, a/b, is in range of (1, 5) m/s
2
,
and the minimum distance, s
0
, is within (1, 5) m. The
optimization problem, Eqs. 5 and 6, is solved by ap-
plying a trust-region reflective least squares algorithm
with constraints (Coleman and Li, 1996). The algo-
rithm is simple yet powerful and specially designed
to solve nonlinear equations and is efficient for non-
convex problems with constraints.
Twenty pairs of human car-following trajectories
from the NGSIM data set were selected and utilized
as the preceding vehicles of the subject vehicles mod-
eled by IDM and evaluated in terms of acceleration
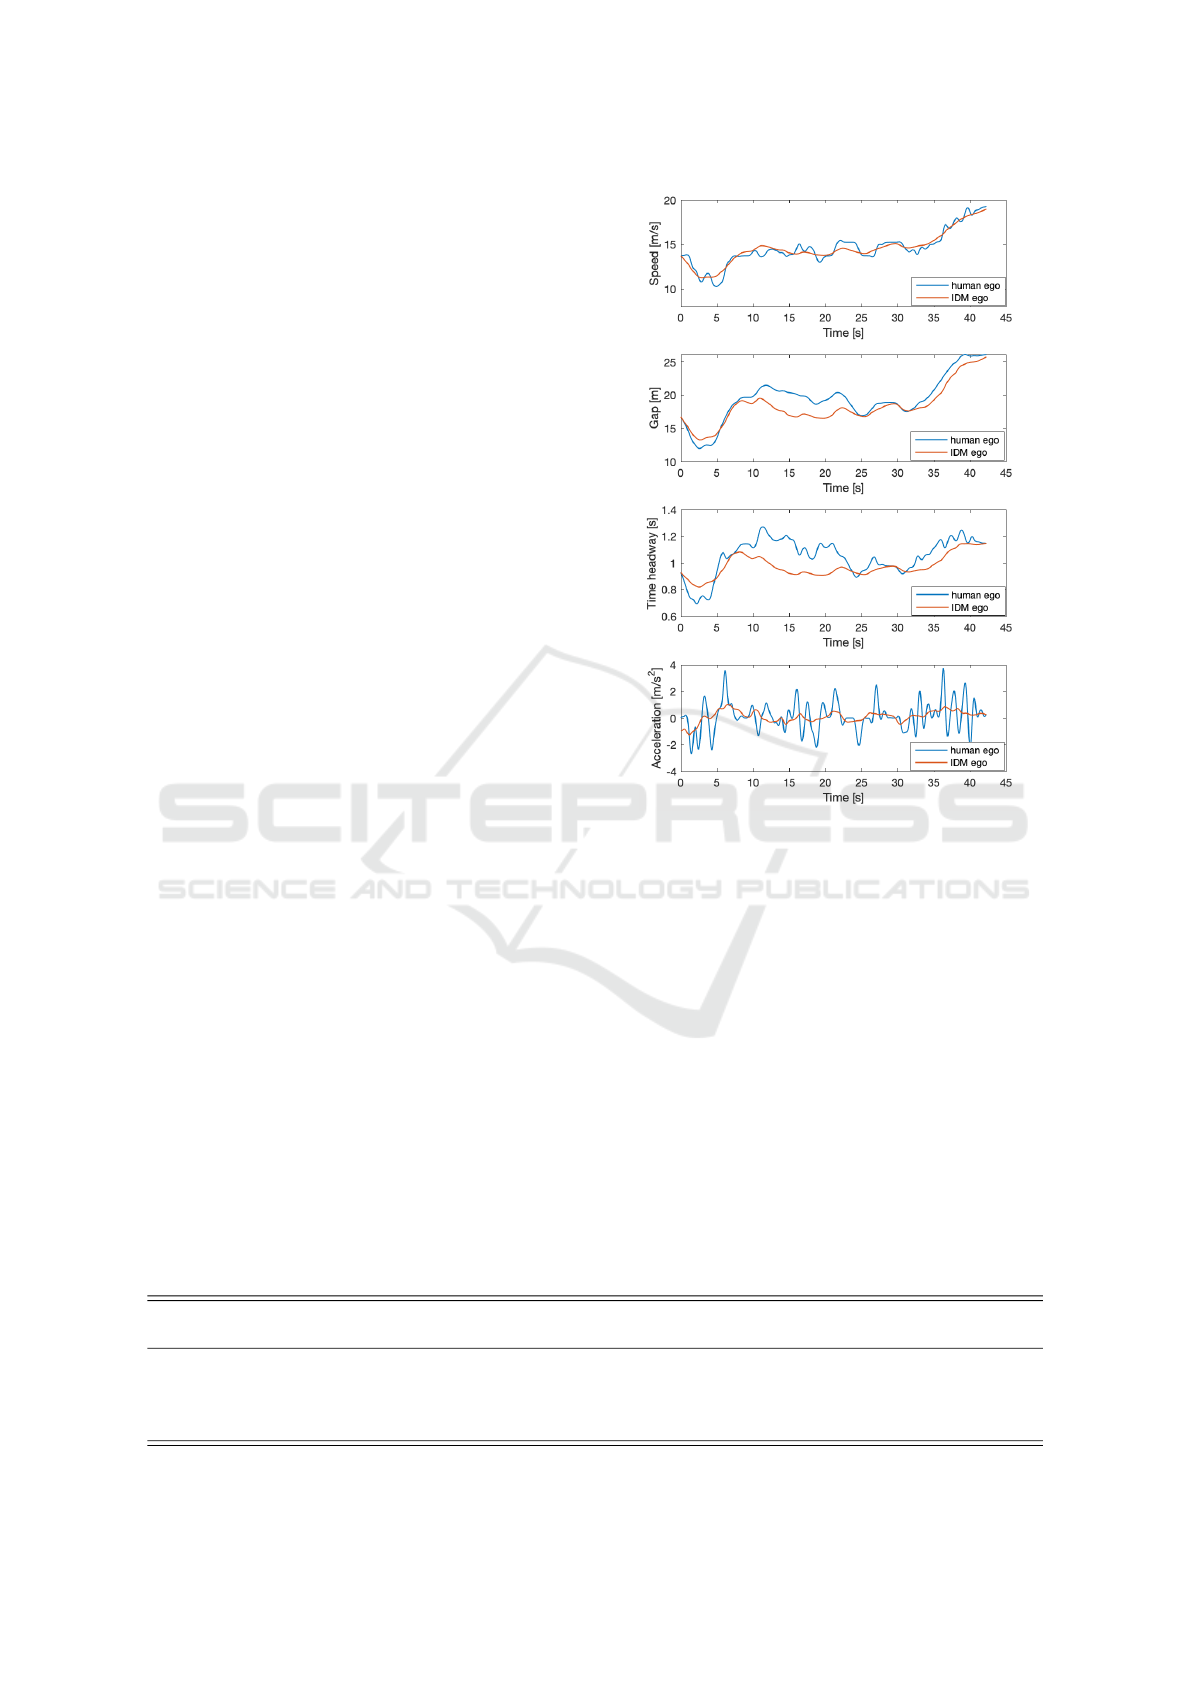
Figure 1: Comparison of speed, gap, time headway and ac-
celeration between real-world human drivers and IDM.
and fuel consumption performance. It is noted that
the safe time headway of IDM and ACC are set as
the same for fair comparisons. Seven metrics, speed
mean, speed standard deviation (Std), gap mean, gap
Std, acceleration (Accl.) mean, acceleration Std and
fuel consumption that is estimated by Virginia-Tech
fuel consumption model(Rakha et al., 2011) are eval-
uated for performance comparisons.
Table 1 shows the IDM performance with cali-
brated parameters and comparisons to real-world hu-
man drivers and the ACC systems. The calibrated pa-
rameters are shown in Table 2. From Table 1, it could
be seen that the speed and gap of the IDM are similar
to those of human drivers, while the acceleration and
fuel consumption of the IDM have a significant differ-
ence to real-world human drivers, as shown in Figure
Table 1: Performance comparison of human drivers, calibrated IDM, and ACC.
Model
Speed Mean
[m/s]
Speed. Std
Gap Mean
[m]
Gap. Std
Accl. Mean
[m/s
2
]
Accl. Std
Fuel
[ml]
Fuel Std
Human
Drivers
12.95 2.97 22.37 5.34 0.76 1.07 64.92 7.92
IDM 12.91 2.75 21.73 5.17 0.42 0.49 45.42 7.32
ACC 12.96 2.90 20.07 4.25 0.47 0.55 48.64 7.72
VEHITS 2023 - 9th International Conference on Vehicle Technology and Intelligent Transport Systems
116
1. More importantly, the IDM performs even better
than the ACC systems, which is unlikely and makes
the IDM not suitable to serve as a human driver model
in mixed traffic, including automated control systems.
Table 2: Calibrated parameters of IDM (20 pairs).
Parameter Name (Unit) Mean Std
Safe time headway (T,s) 1.12 0.34
Maximum acceleration (a
max
,m/s
2
) 2.45 1.30
Maximum deceleration (b
max
,m/s
2
) 4.28 1.17
Desired speed (v
d
,m/s) 24.89 2.02
Minimum distance (s
0
,m) 2.23 1.32
4 IMPACT ASSESSMENT OF IDM
PARAMETERS
4.1 Identifying Key IDM Parameters
In this study, an analysis using the Monte Carlo tech-
nique is implemented to assess how the parameters
and states of the IDM influence the optimization cost
function. This approach uses a representative set of
samples to explore the design space. The five param-
eters of the IDM, safe time headway T , maximum
acceleration a
max
and deceleration b
max
, and desired
speed v
d
and minimum distance s
0
are evaluated for
20 pairs of trajectories from NGSIM data, and their
ranges are set as (0.8, 2) s , (1, 5) m/s
2
, (1, 5) m/s
2
,
(20, 26) m/s and (1, 5) m respectively. The distribu-
tion of randomly generated parameters is assumed to
be a uniform distribution. The reason why the uni-
form distribution is set is that the restricted interval is
small so that any value within such range is equally
likely. 1000 samples for each parameter from the fol-
lowing distribution are generated for analysis.
The design requirements for this analysis are to
match the IDM’s time headway and speed trajectories
with those of real-world human drivers. As the rela-
tionship between five parameters and the cost func-
tion is complex, three different statistical analysis,
Rank correlation(Rutherford, 2005), Kendall corre-
lation (Kendall and Gibbons, 1990), and Rank stan-
dardized Regression (Greenland et al., 1991) are con-
ducted to analyze the impacts of parameters from
IDM. The rank correlation, referred to as Spearman
analysis, is to measure the degree of similarity be-
tween two variable rankings based on the assumption
that a nonlinear monotonic relation between the pa-
rameters and the cost function. The Kendall corre-
lation measures the ordinal association between two
measurements and it does not rely on any assump-
tions about the distributions. Rank standardized Re-
gression usually evaluates which of the independent
variables has a more significant effect on the depen-
dent variable in a multiple regression analysis based
on the assumption that the parameters could linearly
influence the cost function.
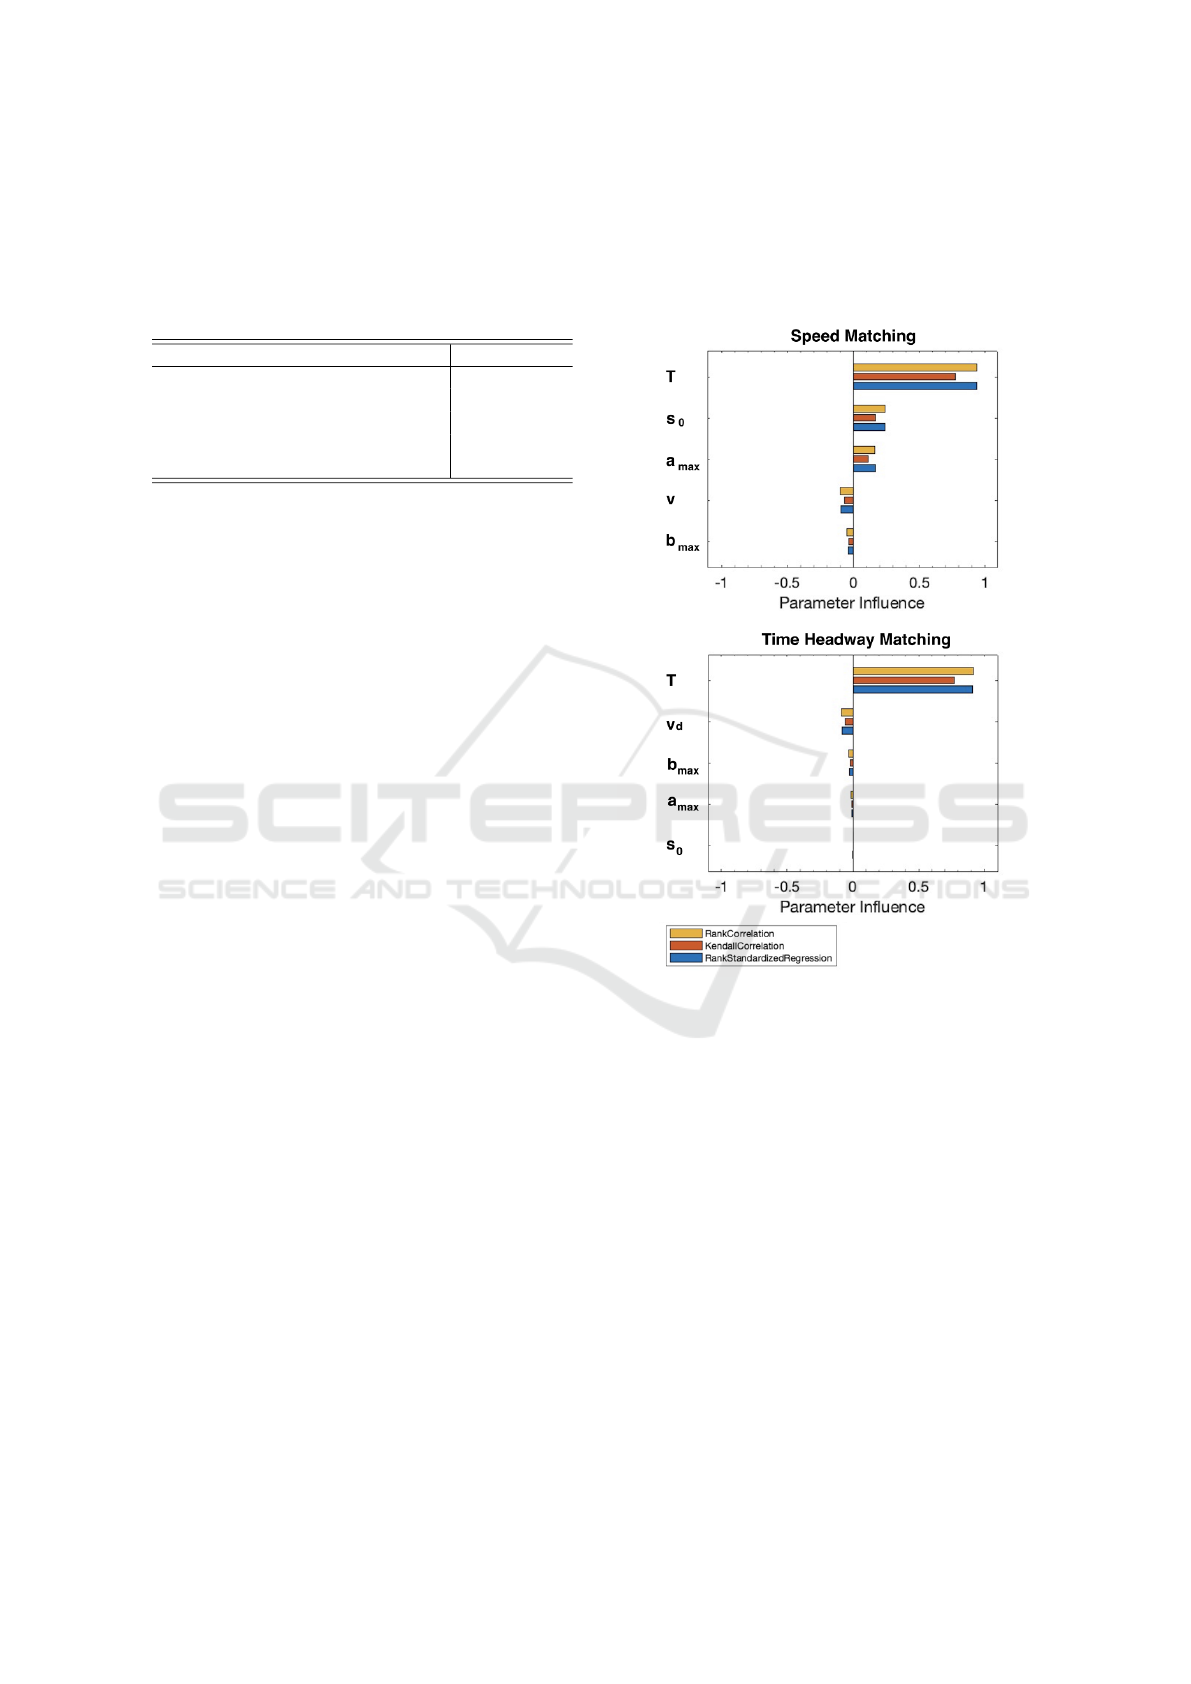
Figure 2: Sensitivity Analysis Results.
The statistical results are shown in Figure 2 where
the first figure shows the influence to the speed match-
ing and the second figure shows the influence to the
time headway matching. From Figure 2, it could
be seen that the safe time headway parameter is the
most influential parameter of the IDM to mimic hu-
man drivers’ time headway and speed trajectories for
all three statistical tests. For the other four parame-
ters, it has different influential ranking to the speed
and time headway. The minimum distance s
0
ranks
as the second influential parameter for speed trajec-
tory, while it is the least influential parameter for time
headway. On the contrary, the desired speed v
d
is the
second influential parameter for time headway, while
it is the second least influential parameter for speed.
It is noted that apart from safe time headway, the
other four parameters’ correlation value is less than
0.3, which means that compared to the safe time head-
Does the Intelligent Driver Model Adequately Represent Human Drivers?
117

way which plays the most significant role in the IDM
to mimic human drivers’ car-following behaviors, the
influence of other four parameters is limited.
4.2 Time Headway of the IDM and
Human Drivers
Figure 3: The calibrated distribution of the variance and
mean of time headway for human drivers.
As the safe time headway is identified as the most in-
fluential parameter in the IDM model, we further in-
vestigated the time headway trajectory of real-world
human drivers and compared it with that of the IDM
generated. Human drivers with an average time head-
way within 2 seconds (533 pairs) are extracted from
NGSIM data for evaluations and comparisons. To ob-
serve the time headway of human drivers, the mean
and variance of time headway profiles of 533 hu-
man drivers are calculated and shown in Figure 3.
In addition, the change of time headway also needs
to be investigated for analyzing the stochastic human
driver behaviors. The time headway and time head-
way change △ T (t) = T (t+ △ t) −T (t) for each time
step (0.1 seconds) are also shown in Figure 4.
From Figure 3, it could be seen that human drivers
have different characteristics. The safe time head-
way of different human drivers have a wide range of
mean and variance, while the time headway changes
of most human drivers are within [-0.1, 0.1] seconds.
From these observations, the human drivers tend to
have more fluctuating time headway than that the
IDM generates. An example of a comparison be-
tween real-world human drivers and the calibrated
IDM is shown in Figure 1. From Figure 1, it could
be seen that IDM generated a more stable time head-
way than human drivers. This is mainly attributed
to the constant time headway setting. The IDM was
able to reach the desired time headway and maintain it
steadily to follow the preceding vehicle, while human
Figure 4: Histograms of drivers’ time headway and their
time headway change at each time step (533 pairs).
drivers were not. Therefore, constant time headway is
one reason that limits the IDM’s capability to mimic
human driver behaviors.
4.3 Calibration Performance
Comparison
Based on the conclusion from the previous section,
instead of using the constant safe time headway T in
the IDM, a dynamic time headway, T (t), is proposed
for IDM to mimic human driver behaviors (IDM-T
t
).
To utilize dynamic time headway and evaluate the im-
pacts to the IDM, the data of human drivers were ana-
lyzed. Based on the time headway at each step shown
in Figure 4, the dynamic time headway is assumed
to follow a normal distribution, and the variance and
mean are generated for each human driver’s character-
istics. To exclude unrealistic time headway changes
in the simulation, the time headway change is con-
strained within [-0.1, 0.1] seconds based on Figure 4.
The rest of the parameters of the IDM with dynamic
time headway shown in Figure 4 are the same as the
parameters of the standard IDM which are calibrated
using the optimization method mentioned in Section
3.2.
The performances of the standard IDM, IDM with
dynamic time headway, ACC, and human drivers are
shown in Table 3. From Table 3, it could be seen that
the standard IDM performed similarly to ACC in ac-
celeration but had better fuel consumption than ACC.
When the IDM is compared with human drivers, it
performs significantly better in acceleration and fuel
consumption. This means that the IDM cannot ade-
quately represent human drivers in terms of comfort
VEHITS 2023 - 9th International Conference on Vehicle Technology and Intelligent Transport Systems
118

Table 3: Performance Comparison of IDM, IDM-T
t
, ACC, human drivers.
Model
Speed Mean
[m/s]
Speed. Std
Gap Mean
[m]
Gap. Std
Accl. Mean
[m/s
2
]
Accl. Std
Fuel
[ml]
Fuel Std
Human
Drivers
12.62 2.72 21.10 4.71 0.78 1.12 60.45 10.43
IDM-T
t
12.63 2.53 20.17 4.12 0.90 1.11 61.42 10.92
IDM 12.59 2.54 20.92 4.79 0.38 0.47 38.84 9.12
ACC 12.6 2.66 18.30 3.73 0.43 0.52 41.47 9.73
Table 4: Calibrated parameters of IDM (533 pairs).
Parameter Name (Unit) Mean Std
Safe time headway (T,s) 1.14 0.34
Maximum acceleration (a
max
,m/s
2
) 2.19 1.25
Maximum deceleration (b
max
,m/s
2
) 4.25 1.20
Desired speed (v
d
,m/s) 24.48 2.25
Minimum distance (s
0
,m) 2.18 0.96
and fuel efficiency. If the IDM were used in a mi-
croscopic simulation to represent human drivers, it is
unlikely to accurately estimate the improvement from
ACC or other control systems of automated vehicles.
However, with dynamic time headway, the IDM-T
t
performed more similarly to that of human drivers
compared with IDM, which could be seen from Table
3. Based on the t-test, the fuel efficiency and acceler-
ation of the IDM with dynamic time headway (IDM-
T
t
) is not significantly different from human drivers.
The IDM with constant time headway and ACC sys-
tems are significantly different from human drivers in
all metrics.
4.4 Validation Performance
Comparison
This subsection performed the validation of the cali-
brated IDM-T
t
using the NGSIM human drivers’ tra-
jectory data that were not used during the calibra-
tion. This is necessary to ensure the calibrated IDM
with dynamic headway is applicable to general human
driven vehicles. A total of 100 pairs of human drivers’
trajectories were used. To validate the proposed dy-
namic time headway in the IDM-T
t
, the calibrated
time headway and other parameters are implemted us-
ing different trajectories in the NGSIM data set and
compared with those of human driven vehicles. The
parameter settings shown in Figure 4 are analyzed to
create a probability distribution for the variance of the
safe time headway by fitting an appropriate distribu-
tion. The distribution is identified as shown in Fig-
ure 3. The variance of the time headway follows a
Gamma distribution with a = 1.32,b = 0.057. The
mean value of the time headway follows a normal dis-
tribution with a mean of 1.34 and a standard deviation
of 0.34 and the value generated by this distribution is
constrained within [0.8, 2] s.
Based on the calibrated distribution of time head-
way and the calibrated parameters in Table 4, the
IDM, IDM-T
t
, and ACC were simulated and com-
pared with human drivers shown in Table 5. The sim-
ulation process is the same with the previous section.
From Table 5, it could be seen that the IDM-T
t
was
not able to perform as well as the calibrated results,
while IDM-T
t
still performed more similar to human
drivers compared with the standard IDM.
5 CONCLUSIONS AND FUTURE
WORK
In this study, we investigated the limitations and po-
tential of IDM to represent human drivers for micro-
scopic traffic simulation. To evaluate the reliability of
IDM to represent human drivers, the calibrated IDM
is compared with real-world human drivers and the
ACC system. The parameters of the IDM were cal-
ibrated in terms of speed and time headway match-
ing to human drivers based on real-world NGSIM
data set. The simulation results showed that the
IDM matches well with the speed and gap of human
drivers, while it performs significantly better than hu-
man drivers and ACC systems in comfort and fuel ef-
ficiency, which makes it inadequate to represent hu-
man drivers. Therefore, in order to improve IDM
application for human drivers, the safe time head-
way, which is the most influential parameter in the
IDM, was proposed to be dynamic instead of using
a constant static value. To evaluate the impacts of
the dynamic time headway to IDM application on hu-
man drivers, 633 pairs of car-following behaviors of
human drivers from the NGSIM data set were com-
pared with IDM, IDM with dynamic time headway,
and ACC control mode with calibration and valida-
tion. With dynamic time headway, IDM can be more
similar to human drivers than the standard IDM in
fuel consumption based on the paired t-test and have a
significant improvement in acceleration similarity. It
is expected that the proposed dynamic safe headway-
Does the Intelligent Driver Model Adequately Represent Human Drivers?
119

Table 5: Validation Performance of IDM, IDM-T
t
, ACC and human drivers.
Model
Speed Mean
[m/s]
Speed. Std
Gap Mean
[m]
Gap. Std
Accl. Mean
[m/s
2
]
Accl. Std
Fuel
[ml]
Fuel Std
Human
Drivers
12.52 1.85 20.25 3.32 0.92 1.24 44.54 14.97
IDM-T
t
12.52 1.64 19.41 2.66 0.84 1.03 39.11 14.84
IDM 12.46 1.63 20.32 3.28 0.36 0.42 24.55 9.97
ACC 12.48 1.73 14.82 2.39 0.43 0.52 26.67 11.58
based IDM improves the evaluation of mixed traffic
interacting with human-driven vehicles and connected
automated vehicles (Chen and Park, 2020).
In this study, safe time headway is the only param-
eter we adjusted to represent human drivers. While
the other parameters in the IDM were less influen-
tial, they should be considered to be adjusted for more
accurate human driver modeling. The dynamic time
headway is based on the normal distribution and the
change is constrained based on real-world data. How-
ever, the value and the direction of time headway
change have not been well-investigated, which will be
investigated in future research. Besides, vehicle stop
and vehicle catch-up behaviors are not considered in
this study. Given these behaviors are also essential to
human driver behavior modeling in microscopic sim-
ulation, these behaviors should be investigated for hu-
man driver modeling.
ACKNOWLEDGEMENTS
This research is supported by the National Science
Foundation under Grant CMMI-2009342.
REFERENCES
Administration, U. D. O. T. F. H. (2017). Next Generation
Simulation (NGSIM) Vehicle Trajectories and Sup-
porting Data. Type: dataset.
Alhariqi, A., Gu, Z., and Saberi, M. (2022). Calibration
of the intelligent driver model (idm) with adaptive pa-
rameters for mixed autonomy traffic using experimen-
tal trajectory data. Transportmetrica B: Transport Dy-
namics, 10(1):421–440.
Bando, M., Hasebe, K., Nakayama, A., Shibata, A., and
Sugiyama, Y. (1995). Dynamical model of traffic
congestion and numerical simulation. Phys. Rev. E,
51:1035–1042.
Bhattacharyya, R., Senanayake, R., Brown, K., and
Kochenderfer, M. (2020). Online parameter estima-
tion for human driver behavior prediction.
Chen, C., Li, L., Hu, J., and Geng, C. (2010). Calibration of
mitsim and idm car-following model based on ngsim
trajectory datasets. In Proceedings of 2010 IEEE In-
ternational Conference on Vehicular Electronics and
Safety, pages 48–53.
Chen, Z. and Park, B. B. (2020). Cooperative adaptive
cruise control with unconnected vehicle in the loop.
IEEE Transactions on Intelligent Transportation Sys-
tems, pages 1–11.
Ciuffo, B., Punzo, V., and Montanino, M. (2014). Global
sensitivity analysis techniques to simplify the calibra-
tion of traffic simulation models. methodology and ap-
plication to the idm car-following model. IET Intelli-
gent Transport Systems, 8(5):479–489.
Coleman, T. F. and Li, Y. (1996). An interior trust region ap-
proach for nonlinear minimization subject to bounds.
SIAM Journal on Optimization, 6(2):418–445.
Ding, H., Pan, H., Bai, H., Zheng, X., Chen, J., and
Zhang, W. (2022). Driving strategy of connected
and autonomous vehicles based on multiple preced-
ing vehicles state estimation in mixed vehicular traffic.
Physica A: Statistical Mechanics and its Applications,
596:127154.
Eggert, J., Damerow, F., and Klingelschmitt, S. (2015). The
foresighted driver model. In 2015 IEEE Intelligent
Vehicles Symposium (IV), pages 322–329.
Gazis, D. C., Herman, R., and Potts, R. B. (1959). Car-
Following Theory of Steady-State Traffic Flow. Op-
erations Research, 7(4):499–505. Publisher: IN-
FORMS.
Greenland, S., Maclure, M., Schlesselman, J. J., Poole, C.,
and Morgenstern, H. (1991). Standardized Regression
Coefficients: A Further Critique and Review of Some
Alternatives. Epidemiology, 2(5).
Guo, L. and Jia, Y. (2021). Anticipative and predic-
tive control of automated vehicles in communication-
constrained connected mixed traffic. IEEE Transac-
tions on Intelligent Transportation Systems.
Hegde, B., O’Keefe, M., Muldoon, S., Gonder, J., and
Chang, C.-F. (2021). Real-World Driving Features
for Identifying Intelligent Driver Model Parameters.
pages 2021–01–0436.
Jiang, H., Hu, J., An, S., Wang, M., and Park, B. B. (2017).
Eco approaching at an isolated signalized intersection
under partially connected and automated vehicles en-
vironment. Transportation Research Part C: Emerg-
ing Technologies, 79:290–307.
Jiang, H., Hu, J., Park, B., Wang, M., and Zhou, W. (2019).
An extensive investigation of an eco-approach con-
troller under a partially connected and automated ve-
hicle environment. Sustainability (Switzerland), 11.
VEHITS 2023 - 9th International Conference on Vehicle Technology and Intelligent Transport Systems
120

Kendall, M. and Gibbons, J. D. (1990). Rank Correlation
Methods. A Charles Griffin Title, 5 edition.
Kesting, A. and Treiber, M. (2008). Calibrating car-
following models by using trajectory data. Trans-
portation Research Record: Journal of the Trans-
portation Research Board, 2088(1):148–156.
Kesting, A., Treiber, M., and Helbing, D. (2010). Enhanced
intelligent driver model to access the impact of driving
strategies on traffic capacity. Philosophical Transac-
tions of the Royal Society A: Mathematical, Physical
and Engineering Sciences, 368(1928):4585–4605.
Marsden, G., McDonald, M., and Brackstone, M. (2001).
Towards an understanding of adaptive cruise control.
Transportation Research Part C: Emerging Technolo-
gies, 9(1):33–51.
Mu, Z., Chen, Z., Ryu, S., Avedisov, S. S., Guo, R.,
and Park, B. B. (2022). Cooperative platooning with
mixed traffic on urban arterial roads. In 2022 IEEE In-
telligent Vehicles Symposium (IV), pages 1578–1583.
Punzo, V., Borzacchiello, M. T., and Ciuffo, B. (2011).
On the assessment of vehicle trajectory data accu-
racy and application to the Next Generation SIMula-
tion (NGSIM) program data. Transportation Research
Part C: Emerging Technologies, 19(6):1243–1262.
Rahman, M. S. and Abdel-Aty, M. (2018). Longitudi-
nal safety evaluation of connected vehicles’ platoon-
ing on expressways. Accident Analysis & Prevention,
117:381–391.
Rakha, H. A., Ahn, K., Moran, K., Saerens, B., and den
Bulck, E. V. (2011). Virginia tech comprehensive
power-based fuel consumption model: Model devel-
opment and testing. Transportation Research Part D:
Transport and Environment, 16(7):492–503.
Ro, J. W., Roop, P. S., Malik, A., and Ranjitkar, P. (2018).
A Formal Approach for Modeling and Simulation of
Human Car-Following Behavior. IEEE Transactions
on Intelligent Transportation Systems, 19(2):639–648.
Conference Name: IEEE Transactions on Intelligent
Transportation Systems.
Rutherford, A. (2005). Research design and statistical anal-
ysis. jerome l. myers,and arnold d. well,(2nd edn)
mahwah, nj: Lea 2003 , £43.10 . isbn: 08058-4037-
0. British Journal of Mathematical & Statistical Psy-
chology - BRIT J MATH STATIST PSYCHOL, 58:187–
189.
Sharma, A., Zheng, Z., Bhaskar, A., and Haque, M. M.
(2019). Modelling car-following behaviour of con-
nected vehicles with a focus on driver compli-
ance. Transportation research part B: methodologi-
cal, 126:256–279.
Sharma, A., Zheng, Z., Kim, J., Bhaskar, A., and Mazharul
Haque, M. (2021). Assessing traffic disturbance, ef-
ficiency, and safety of the mixed traffic flow of con-
nected vehicles and traditional vehicles by consider-
ing human factors. Transportation Research Part C:
Emerging Technologies, 124:102934.
Stern, R. Modeling stochastic human-driver car following
behavior in oscillatory traffic conditions. page 27.
Sun, C., Guanetti, J., Borrelli, F., and Moura, S. J. (2020).
Optimal eco-driving control of connected and au-
tonomous vehicles through signalized intersections.
IEEE Internet of Things Journal, 7(5):3759–3773.
Treiber, M., Hennecke, A., and Helbing, D. (2000). Con-
gested Traffic States in Empirical Observations and
Microscopic Simulations. arXiv:cond-mat/0002177.
Vahidi, A. and Eskandarian, A. (2003). Research advances
in intelligent collision avoidance and adaptive cruise
control. IEEE Transactions on Intelligent Transporta-
tion Systems, 4(3):143–153.
Wang, Z., Wu, G., and Barth, M. J. (2019). Coopera-
tive eco-driving at signalized intersections in a par-
tially connected and automated vehicle environment.
IEEE Transactions on Intelligent Transportation Sys-
tems, 21(5):2029–2038.
Yi, Z.-w., Lu, W.-q., Xu, L.-h., Qu, X., and Ran, B.
(2020). Intelligent back-looking distance driver
model and stability analysis for connected and auto-
mated vehicles. Journal of Central South University,
27(11):3499–3512.
Zhang, J., Wu, K., Cheng, M., Yang, M., Cheng, Y., and
Li, S. (2020). Safety evaluation for connected and au-
tonomous vehicles’ exclusive lanes considering pene-
trate ratios and impact of trucks using surrogate safety
measures. Journal of advanced transportation, 2020.
Does the Intelligent Driver Model Adequately Represent Human Drivers?
121
