
SDRank: A Deep Learning Approach for Similarity Ranking of
Data Sources to Support User-Centric Data Analysis
Michael Behringer
a
, Dennis Treder-Tschechlov
b
,
Julius Voggesberger
c
, Pascal Hirmer
d
and Bernhard Mitschang
e
Institute of Parallel and Distributed Systems, University of Stuttgart, Universit
¨
atsstr. 38, D-70569 Stuttgart, Germany
Keywords:
Data Mashup, Human-In-The-Loop, Interactive Data Analysis.
Abstract:
Today, data analytics is widely used throughout many domains to identify new trends, opportunities, or risks
and improve decision-making. By doing so, various heterogeneous data sources must be selected to form the
foundation for knowledge discovery driven by data analytics. However, discovering and selecting the suitable
and valuable data sources to improve the analytics results is a great challenge. Domain experts can easily
become overwhelmed in the data selection process due to a large amount of available data sources that might
contain similar kinds of information. Supporting domain experts in discovering and selecting the best suitable
data sources can save time, costs and significantly increase the quality of the analytics results. In this paper,
we introduce a novel approach – SDRank – which provides a Deep Learning approach to rank data sources
based on their similarity to already selected data sources. We implemented SDRank, trained various models
on 4 860 datasets, and measured the achieved precision for evaluation purposes. By doing so, we showed that
SDRank is able to highly improve the workflow of domain experts to select beneficial data sources.
1 MOTIVATION
Nowadays, a large number of enterprises and insti-
tutions across all industries rely on data analytics to
identify new trends, opportunities, or risks in their
decision-making. This requires the combination of
different data sources and knowledge about the se-
mantics of data. So far, this is not possible by fully
automated methods. As a consequence, it is necessary
to involve domain experts in the analysis process in
order to exploit the existing knowledge on the mean-
ing of data (Endert et al., 2014).
As this requires to enable domain experts to per-
form data selection, data preprocessing as well as
generic analyses, so-called data mashup tools are of-
ten used at start (Daniel and Matera, 2014). These al-
low the dynamic combination of data sources and data
operators through an intuitive graphical interface. In
order to not restrict domain experts in their analyses,
as many data sources as possible should be provided.
a
https://orcid.org/0000-0002-0410-5307
b
https://orcid.org/0000-0002-2502-4215
c
https://orcid.org/0000-0003-4808-1922
d
https://orcid.org/0000-0002-2656-0095
e
https://orcid.org/0000-0003-0809-9159
These data sources originate from very diverse
source systems and thus mostly come with different
schemas and naming conventions. In particular, for
exploratory data analyses, this leads to the situation
that it is almost impossible for a domain expert to
decide at the start of an analysis which data sources
can make a contribution to the analysis and, there-
fore, should be used. To illustrate this challenge, an
excerpt of a possible analysis is depicted in Figure 1.
Here, two data sources are present. For an explo-
rative analysis, these data sources can either be ana-
lyzed in isolation (blue and orange, respectively) or in
combination (green). This results in three possible al-
…
Data Source A
Preprocessing Analytics
Data Source B
3 Data Sources
10 Data Sources
15 Data Sources
n Data Sources
7
1023
32.767
2
n
-1
Combinations
Combinations
Combinations
Combinations
Figure 1: Possible combinations of data sources.
Behringer, M., Treder-Tschechlov, D., Voggesberger, J., Hirmer, P. and Mitschang, B.
SDRank: A Deep Learning Approach for Similarity Ranking of Data Sources to Support User-Centric Data Analysis.
DOI: 10.5220/0011998300003467
In Proceedings of the 25th International Conference on Enterprise Information Systems (ICEIS 2023) - Volume 1, pages 419-428
ISBN: 978-989-758-648-4; ISSN: 2184-4992
Copyright
c
2023 by SCITEPRESS – Science and Technology Publications, Lda. Under CC license (CC BY-NC-ND 4.0)
419

ternatives, which have to be considered by the domain
experts. For two data sources, this still seems feasible,
but the number of possible combinations increases ex-
ponentially with each additional data source. For in-
stance, with 10 data sources, a domain expert would
have to test 1023 combinations, and with 15 data
sources, as many as 32 767 combinations. This is al-
ready highly unrealistic, but in practice, there are sig-
nificantly more than 15 data sources. Thus, we need
approaches to support domain experts in the selection
of data sources, and it is reasonable to suggest only
data sources that presumably provide added value for
the analysis. This reduces the number of performed
analyses not leading to the desired results. Thus, more
beneficial analyses can be performed in the same pe-
riod of time, and results can be obtained more quickly.
In addition, the frustration about repeated and unnec-
essary activities by the domain expert is reduced, and
attention can be focused on identifying new insights.
By doing so, exploratory analysis can be accelerated,
and the domain expert’s interpretive knowledge can
be leveraged. However, the decision regarding the
added value for the analysis depends on the use case
and cannot be answered in general terms.
In this paper, we focus on finding additional bene-
ficial data sources. If the data source contains further
data, which are not yet represented in the currently
evaluated data sources, these can have a decisive in-
fluence on the result of the analysis. Including such a
beneficial data source leads to an increased effort of
the calculations, but in return, may provide more de-
tailed and robust results. A comparatively straightfor-
ward example is the resolution of foreign keys to add
related data. In most cases, however, it is not appro-
priate to merely add more data but rather to identify
semantically related data. For this reason, we intro-
duce SDRank, a novel approach that enables domain
experts to add more data to their analysis and to se-
lect beneficial data sources, even in the case of a large
number of available data sources.
Our main contributions are:
• We compare different approaches regarding their
suitability to identify semantically related fea-
tures, a so-called context group.
• We present a workflow pipeline to suggest a data
source based on multiple input features. This data
source is expected to contain features beneficial
for the analysis conducted by the domain expert.
• We evaluate our approach SDRank based on five
different domains and 4 885 datasets and show
that SDRank outperforms the expected value,
i.e., the probability for a correct suggestion, in
all of the evaluated configurations regarding the
achieved precision.
The remainder of this paper is structured as fol-
lows: In Section 2, we introduce SDRank, an ap-
proach for semantic ranking of data sources to sup-
port domain experts to select beneficial data sources
during the analysis. Section 3 shows the results of our
comprehensive evaluation, before we present related
work in Section 4. Finally, we conclude in Section 5.
2 SDRank – SEMANTIC
RANKING OF DATA SOURCES
In this section, we present SDRank, our novel ap-
proach to identify beneficial data sources in the con-
text of an user-centric explorative data analysis.
In contrast to common approaches, we do not fo-
cus on finding semantically identical features in other
data sources for the sake of explaining, or organiz-
ing data. Instead, we focus on finding related data in
other data sources. Therefore, we introduce the term
context group. A context group is a set of features that
frequently occur together. For instance, if we consider
address data, multiple datasets are expected to contain
features like street name, house number, zip code or
city. These features, thus, form a context group due to
their semantics. However, since these context groups
are unknown, and the specification in advance is al-
most impossible due to the heterogeneous origin of
the data, they have to be identified in a different man-
ner. A typical approach for such challenges is Deep
Learning to identify complex patterns in data. For our
use case, we can use a neural network to identify the
context groups and their identifying feature sets.
More formally, we define the input as a set of fea-
tures F and the result as a set of result features R, and
it holds:
F := ( f
1
, ..., f
n
), n ∈ N and R := (r
1
, ..., r
m
), m ∈ N
In general, there are four different approaches to use
a neural network for this purpose:
One-to-One.
In the most straightforward case, one input fea-
ture is associated with exactly one result feature
(Equation (1)). One example is to estimate for
an input feature postal code the result feature city
since these two features occur together in many
data sources. However, this concept does not
seem promising for the use case. For each fea-
ture of the input dataset, each other feature of the
same dataset would have to be predicted. Fur-
thermore, a context of co-occurring features could
hardly be detected. Moreover, this increases the
training complexity significantly.
F → R, f
i
7→ r
j
i, j ∈ N, i≤ n, j ≤m (1)
ICEIS 2023 - 25th International Conference on Enterprise Information Systems
420

One-to-Many.
In the second case, one input feature is used to
compute an arbitrary number of output features
(Equation (2)). For instance, based on the in-
put feature street name, the output features house
number, postal code and city should be suggested.
Unlike the one-to-one approach, this type of train-
ing permits detecting context groups, i.e., multi-
ple features occurring together. Since the neural
network optimizes for the resulting features, the
resulting features must always occur in the same
order to prevent ambiguity. However, this order
is not guaranteed or would have to be defined in
advance by a domain expert, which is impractical.
Alternatively, a schema-matching algorithm could
be applied, which determines the order across
all datasets. However, correctness is not guaran-
teed and usually requires post-processing by do-
main experts. Again, both of these counteract
our objective. Without this order, this approach
is merely a repeated application of the One-to-
One approach with the corresponding disadvan-
tages regarding the required amount of training
data and training time.
F → R
q
, f
i
7→ N
N ⊆R, q ≤|R|, i,q ∈N, i ≤n
(2)
Many-to-One.
In the third case, we use many input features to
compute exactly one result feature (Equation (3)),
i.e., based on the input features street name, house
number, and postal code, the output feature city
should be suggested. In contrast to the preceding
approaches, the many-to-one approach solves sev-
eral of their problems. First, optimization is only
performed targeting an unique feature, i.e., ambi-
guity is no longer a problem. However, the or-
der might also be important for input features, but
this can be solved in an automated way consid-
ering all possible permutations and is, therefore,
just a limitation regarding the available training
time. Furthermore, a semantic context is usually
not defined by a single feature, so multiple input
features seem more suitable.
F
p
→ R, M 7→ r
j
M ⊆ F, p≤ |F|, j, p ∈N, j ≤m
(3)
Many-to-Many.
Finally, we could use multiple input features to
compute multiple result features (Equation (4)).
This could lead to suggesting the result features
postal code and city based on the input features
street name and house number. In theory, this
concept offers the most possibilities since all pos-
sible configurations are covered, and all of the
previous concepts are combined here. However,
this also adds up to the disadvantages. First, con-
text groups are challenging to recognize because
they must be partitioned between input and out-
put features. This also implies that the complex-
ity increases tremendously since all combinations
have to be considered. In addition, the problem of
unambiguousness arises once again regarding the
output features, as previously encountered within
the One-to-Many approach.
F
p
→ R
q
, M 7→ N
M ⊆ F, N ⊆R, p≤|F|, q ≤|R|, p,q ∈N
(4)
When considering these four approaches, it is ev-
ident that the Many-to-One approach is the most suit-
able since it is the only approach that can identify
context groups in an automated manner and, at the
same time, can be trained with a reasonable amount
of time. Consequently, this approach is chosen for the
data source recommendation we aim for in this paper.
Based on this approach, the process for identify-
ing and suggesting data sources consists of four main
steps, which are shown in Figure 2 and are explained
in more detail in the following:
(1) Selection of Input Features
To be able to suggest related data sources to a domain
expert, it is first necessary to specify an initial dataset,
i.e., one or more features of a data source, for which
related features should be found. This can be deter-
mined either in an automated manner based on the al-
ready modeled data sources or existing intermediate
results, as well as interactively by the domain expert.
While an automatic selection minimizes the cognitive
load for a domain expert, the possibility to select the
most meaningful features provides the domain expert
with a high degree of control over the suggestions.
After this step, a set of k input features is selected in
both cases.
(2) Transformation in Input Vector
In the second step, these input features must first
be converted into a comparable form. For this rea-
son, metadata about the features is usually calculated,
which can then be used for comparison (cf. Section 4).
A promising way to generate this metadata and, thus,
to vectorize individual features is LEAPME (Ayala
et al., 2022). In contrast to LEAPME, however, we
do not aim for data integration, i.e., to recognize
and match a feature across multiple data sources, but
rather to enable suggestions of similar data sources.
SDRank: A Deep Learning Approach for Similarity Ranking of Data Sources to Support User-Centric Data Analysis
421

Automatic
- modeled data sources
Interactive
- selection of domain expert
(1) Selection
of Input Features
Vectorization
(2) Transformation
in Input Vector
Convolutional
Neural
Network
(3) Prediction
of Target Vector
Cosine Similarity
Elbow Method
Ranking
(4) Identification
of Similar Dataset
k
Input
Features
Target
Vector
update modeled workflow / refine selected features
Input
Vector
Figure 2: The four steps of our approach to suggest beneficial data sources.
Thus, unlike LEAPME, our approach is intended to
recognize that a feature such as zip code frequently
co-occurs with street name but ultimately is indiffer-
ent to whether the suggested data source actually con-
tains a feature zip code as long as street name contin-
ues to be included. In our approach, we nevertheless
use parts of the dimensions defined for LEAPME, i.e.,
we use 329 dimensions describing the feature using
metadata as well as the embeddings vector of the fea-
ture name (cf. Section 4). In contrast to LEAPME,
however, we get rid of all dimensions, which either
work only on text or already link features to each
other. Thus, we do not use the property pairs since
we do not need comparisons between features and di-
mensions that refer to concrete values. In addition, we
omit the average embeddings vector of all instances
of the feature, as this only works for strings and could
lead to problems in our use case since numeric fea-
tures would start with a penalty regarding similarity
to strings. The resulting dimensions are listed in Ta-
ble 1. Furthermore, these k input vectors have to be
combined and transformed into the shape expected by
the neural network as input vector.
(3) Prediction of Target Vector
In the third step, a convolutional neural network is
used to calculate a target vector from the selected and
vectorized input features. This target vector describes
a virtual feature, representing the most probable target
feature in vectorized form for the given input features.
However, this feature is not necessarily present in a
data source.
(4) Identification of Similar Datasets
Since the feature described by the target vector most
likely does not exist, the similarity to existing features
must be evaluated in the last step. For this purpose,
the cosine similarity can be used, which describes the
similarity of two vectors. Based on this foundation,
the semantically most similar feature can already be
found quite easily, namely by selecting the existing
feature with the highest similarity to the predicted fea-
ture. However, in the context of data mashups and for
more robust suggestions, it makes sense to suggest the
most similar data sources. To this end, considering
cosine similarity alone is not sufficient. While it is
possible to use the average or median of the cosine
similarity as a similarity measure of the data source,
very similar features will be blurred by a more ex-
tensive set of entirely dissimilar features by this ap-
proach. Thus, it is essential that only the most similar
features in each data source are considered. For in-
stance, the Elbow Method (Thorndike, 1953) can be
used to identify these features. Thus, the most similar
features per data source can be selected in a (semi-
)automatic way. Based on this, a ranking of the data
sources can now be created, and the best suited data
sources can be suggested to the domain expert.
In summary, these four steps allow us to recom-
mend additional data sources with a semantic rela-
tionship to the input features. These input features
can either be selected automatically based on the al-
ready modeled data sources or specified manually by
domain experts for a higher degree of adaptation to
their needs. Subsequently, the most probable (virtual)
feature is calculated, which can subsequently be used
to determine a ranking of the available data sources.
3 EVALUATION
In order to evaluate the effectiveness of our proposed
approach, we conducted a comprehensive evaluation
based on synthetic datasets from five different do-
mains. Based on these synthetic datasets, i.e., simu-
lating different data sources, we assessed the achieved
precision of our approach, both for domains known
at the time of training and for transfer learning, i.e.,
applying to previously unseen domains. More specif-
ically, we trained respective convolutional neural net-
works on different training datasets with varying data
characteristics to identify possible effects of the train-
ing data on the achieved precision. Thus, this allows
us to draw a conclusion about the robustness of our
approach and its applicability across various domains.
3.1 Datasets
We used synthetically generated datasets from differ-
ent domains as the foundation for our evaluation. In
order to generate these datasets, we initially needed
characteristic features for each domain.
ICEIS 2023 - 25th International Conference on Enterprise Information Systems
422

Table 1: Dimensions for the vectorization of input features (based on (Ayala et al., 2022)).
Description # of features
The fraction and number of occurrences of several character types, i.e., letters (uppercase, lowercase, and
both), mark characters, numbers, punctuation, symbols, separators, and others 18
The fraction and number of occurrences of several token types (words, words starting with a lowercase
letter, words starting with an uppercase letter followed by a non-separator character, uppercase words,
numeric strings)
10
The average of the numeric values (-1 if it is not a number) 1
The average embeddings vector of the feature name 300
Regarding our first domain used, people, we uti-
lized Mockaroo
1
for this purpose. This data genera-
tor allows us to create realistic datasets, which con-
tain, for instance, name, gender, birthday or occupa-
tion. As a second domain, we used location. Again,
Mockaroo served as the data generator for this do-
main. Typical features are street, house number, city
or latitude and longitude. For the third domain cars,
we used a freely accessible database
2
, which con-
tains data about cars since 1945. Features include
make, model, year, trunk capacity, or the number of
doors. Our fourth domain is aircrafts. For this do-
main, we also used a freely accessible database from
the OpenSky Network
3
, which contains features such
as construction year, model, airline code or owner.
Finally, we used the domain movies. For this do-
main, we accessed data from DBpedia
4
, which con-
tains for movies among other things the release date,
title, number of awards or budget spent.
Since all these domains contain a different number
of features, for a better comparability of the domains
the feature count was homogenized, i.e., we removed
the features with more than 50 percent of null values
and afterwards randomly reduced to the feature count
of the smallest domain. Thus, 16 different features are
available for each domain to ensure that each feature
has the same probability of being selected, regardless
of the domain.
On this basis, the datasets used for the evaluation
can be generated. A training dataset initially consists
of 5, 7, or 10 features f , which were randomly se-
lected from the 16 available features of the respec-
tive domain. To simulate the influence of heteroge-
neous data sources, 0, 2, or 4 domain-foreign fea-
tures w were added to these features, i.e., features
associated with one of the remaining domains. Fur-
thermore, we varied the number of instances n for
each of these datasets between 10 000, 100 000, and
1
https://www.mockaroo.com/
2
https://database-downloads.com/
3
https://opensky-network.org/
4
https://dbpedia.org/
Table 2: Overview of the parameters for the dataset charac-
teristics. Each parameter permutation was used once.
Parameter Training-Datasets Test-Datasets
#features f 5, 7, 10 8
#domain-foreign features w 0, 2, 4 0
#instances n 10 000, 100 000, 1 000 000 100 000
#repetitions rep 10, 20, 30 5
1 000 000. Thus, for instance, a dataset assigned to
the domain cars might consist of 7 features of the do-
main cars ( f ), 2 features of the domain location (w),
and 100 000 instances (n). To further investigate the
influence of the number of data sources, we repeated
the same procedure for each combination, depending
on the parameter repetitions rep. This results in 81
possible configurations and 4 860 datasets for each
domain. For the test datasets to evaluate the achieved
precision, 8 features with 100 000 instances and 5 rep-
etitions were chosen. Thus, the trained models were
evaluated on up to 25 different datasets. All parame-
ters used are summarized in Table 2.
3.2 Training
As described in Section 2, the most suitable concept
is the many-to-one approach. Consequently, a con-
volutional neural network is used, which calculates
a (virtual) output feature based on several input fea-
tures. For the evaluation, we set the context group
size, i.e., the maximum number of input features, to
four features. This is justified by the fact that four
features are expected to be able to recognize a con-
text group already properly and due to the exponential
increase in complexity with an increasing number of
features. For instance, for a dataset with 10 available
features, 9 240 permutations have to be considered
for the training phase when the context group size is
4 input features, whereas this number grows to 76 440
permutations for a context group size of 5 features and
609 840 permutations are required for a context group
size of 6 features. We additionally decided to reduce
the required training time by using combinations in-
stead of permutations, which has a significant impact.
SDRank: A Deep Learning Approach for Similarity Ranking of Data Sources to Support User-Centric Data Analysis
423

Input
(1@1@1316)
x
1,16
x
1,329
x
4,329
…
x
1,329
x
2,1
…
…
x
2,1
x
1,329
x
1,329
x
4,328
x
1,2
…
x
2,1
…
x
4,329
…
…
…
x
1,1
x
4,328
x
1,329
…
x
4,328
x
1,329
x
1,329
…
…
x
1,1
x
4,329
x
2,1
x
1,16
…
x
2,1
x
4,329
…
…
x
1,1
x
4,328
x
1,16
…
…
…
x
4,329
x
1,2
x
1,1
x
1,329
x
4,328
x
2,1
x
4,329
x
1,16
x
2,1
x
4,329
x
1,16
x
4,328
x
1,329
x
1,16
x
2,1
x
1,1
x
1,2
x
1,16
…
x
1,2
…
x
1,2
x
4,328
x
1,1
…
…
x
1,16
x
4,328
…
x
4,329
x
1,16
x
1,2
…
x
2,1
…
x
1,1
x
1,329
…
x
4,329
…
x
1,2
x
1,16
x
1,2
x
1,1
x
2,1
T
T
T
T
T
T
T
T
T
T
T
x
y
T
Conv1D
(32@1@1301)
Dense
(16@1@1301)
MaxPooling1D
(16@1@325)
Flatten
(1@1@5200)
Dense
(1@1@658)
Dense
(1@1@329)
32 layers
16 layers
16 layers
Figure 3: Schematic architecture of the convolutional neural network.
The resulting convolutional neural network is
shown in Figure 3. The input layer consists of the
four vectorized input features with 329 dimensions
each (cf. Table 1). Subsequently, a Conv1D layer
with ReLu activation function follows, which detects
patterns in the input before aggregating them into a
Dense layer. A following MaxPooling1D layer iden-
tifies the essential properties of the detected patterns.
These are followed by a Flatten layer and two Dense
layers to produce the desired output dimension, i.e.,
329 dimensions. Finally, the training datasets de-
scribed above were used, with a separate neural net-
work trained for each parameter configuration. For
this purpose, we used Keras
5
with Adam as the opti-
mization function for accuracy.
3.3 Results
Our evaluation results are divided into three different
scenarios. First, we consider the results for the pre-
diction of beneficial data sources for already known
domains (people, location, cars, aircrafts), i.e., do-
mains that were already available during the training
phase. This scenario will be referred to as S
1
in the
following. Based on this, we consider the case S
2
where datasets from an additional domain (movies)
are available, which in reality is very likely. This ad-
ditional domain can be suggested but is not used as
input, i.e., we do not try to query features from the
movie domain but possible false positives are taken
into account. Next, we consider the suitability of our
approach with respect to so-called transfer learning,
i.e., when additional previously unknown domains are
added and this time also queried. This scenario is re-
ferred to as S
3
. As a baseline for our evaluation, we
use the respective expected value, i.e., the probabil-
5
https://keras.io/
ity for the correct selection of a data source from the
same domain, which a domain expert would achieve
without further support. Furthermore, we use a top-k
evaluation, i.e., we consider whether at least one data
source from the same domain was identified among
the first k suggestions.
The results for the scenarios S
1
and S
2
are almost
equivalent since all trends are similar and the achieved
precisions vary negligibly. Thus, only the expected
value differs due to a larger number of available data
sources. For the first scenario, S
1
, the expected value
is approximately 0.73 for the top-4 evaluation and
0.25 for the top-1 evaluation, and for scenario S
2
ap-
proximately 0.61 for the top-4 evaluation and 0.2 for
the top-1 evaluation. In the following, only scenario
S
2
is considered in more detail. Figure 4 shows the
results for the second and more realistic scenario.
This figure describes the mean precision achieved
for each combination of the parameters by the respec-
tive convolutional neural network. For instance, the
sub-figure on the top left shows the mean precision
achieved for 10.000 instances and 10 repetitions on
the y-axis. In addition, the three different numbers
of features of the respective domain ( f = 5, f = 7,
f = 10) are depicted on the x-axis. Furthermore, for
each of these features, the number of domain-foreign
features (w) is plotted from left (no domain-foreign
features) to right (4 domain-foreign features). The
expected value is shown by a dashed horizontal line.
Hereby, the gray graphs refer to the top-1 evaluation,
while the green graphs refer to the top-4 evaluation.
It is evident that the expected values are exceeded
in all cases. Even for a correspondingly higher base-
line of 0.8, i.e., in 4 out of 5 cases, a beneficial data
source is suggested and almost all models also ex-
ceed this baseline in the top-4 evaluation (80 out of
81 models, 98.77 percent). In the top-1 evaluation,
ICEIS 2023 - 25th International Conference on Enterprise Information Systems
424
f=5 f=7 f=10
0
0.2
0.4
0.6
0.8
1
n = 10 000
rep = 10
f=5 f=7 f=10
0
0.2
0.4
0.6
0.8
1
rep = 20
f=5 f=7 f=10
0
0.2
0.4
0.6
0.8
1
rep = 30
f=5 f=7 f=10
0
0.2
0.4
0.6
0.8
1
n = 100 000
f=5 f=7 f=10
0
0.2
0.4
0.6
0.8
1
f=5 f=7 f=10
0
0.2
0.4
0.6
0.8
1
f=5 f=7 f=10
0
0.2
0.4
0.6
0.8
1
n = 1 000 000
f=5 f=7 f=10
0
0.2
0.4
0.6
0.8
1
f=5 f=7 f=10
0
0.2
0.4
0.6
0.8
1
Mean Precision (Top-4) of our approach Statistical Probability (Expected Value)
Mean Precision (Top-1) of our approach Statistical Probability (Expected Value)
Figure 4: Overview of the mean precision achieved for scenario S
2
. For each combination of instances n, repetitions rep and
features f the mean precision achieved with different number of domain-foreign features w (0, 2,4 from left to right) is shown.
such high success rates cannot be achieved, but for a
baseline of 0.6, i.e., a correct prediction in 3 out of 5
cases, still more than half of the models are suitable
(46 out of 81 models, 57 percent).
Furthermore, it can be seen that the achieved mean
precision tends to decrease with an increasing num-
ber of domain-foreign features in the training dataset.
Thus, the achieved mean precision for the top-1 eval-
uation without domain-foreign features is on average
0.74, for two domain-foreign features still 0.64 and
with 4 domain-foreign features 0.49. For the top-
4 evaluation, however, this decrease is significantly
lower and falls from 0.91 to 0.88 to 0.84. Moreover,
this effect also weakens with an increasing number of
domain native features, which is more evident for the
top-1 evaluation. For 5 features of the same domain, a
mean precision of 0.57 is achieved, increasing to 0.62
for 7 features and to 0.67 for 10 features. For the top-4
evaluation, a mean precision of 0.86 is achieved for 5
features, 0.88 for 7 features, and 0.91 for 10 features.
With regard to the repetitions, the achieved mean
precision for the top-1 evaluation is 0.58 with 10 repe-
titions, 0.64 with 20 repetitions and 0.66 with 30 rep-
etitions. For the top-4 evaluation and 10 repetitions,
the mean precision achieved is 0.87, 0.89 with 20 rep-
etitions and 0.89 with 30 repetitions.
Finally, with respect to the number of instances,
no significant influences are evident and the achieved
mean precision varies only slightly across the differ-
ent evaluations (top-1: 0.63; 0.62; 0.63 and top-4:
0.89; 0.88; 0.88).
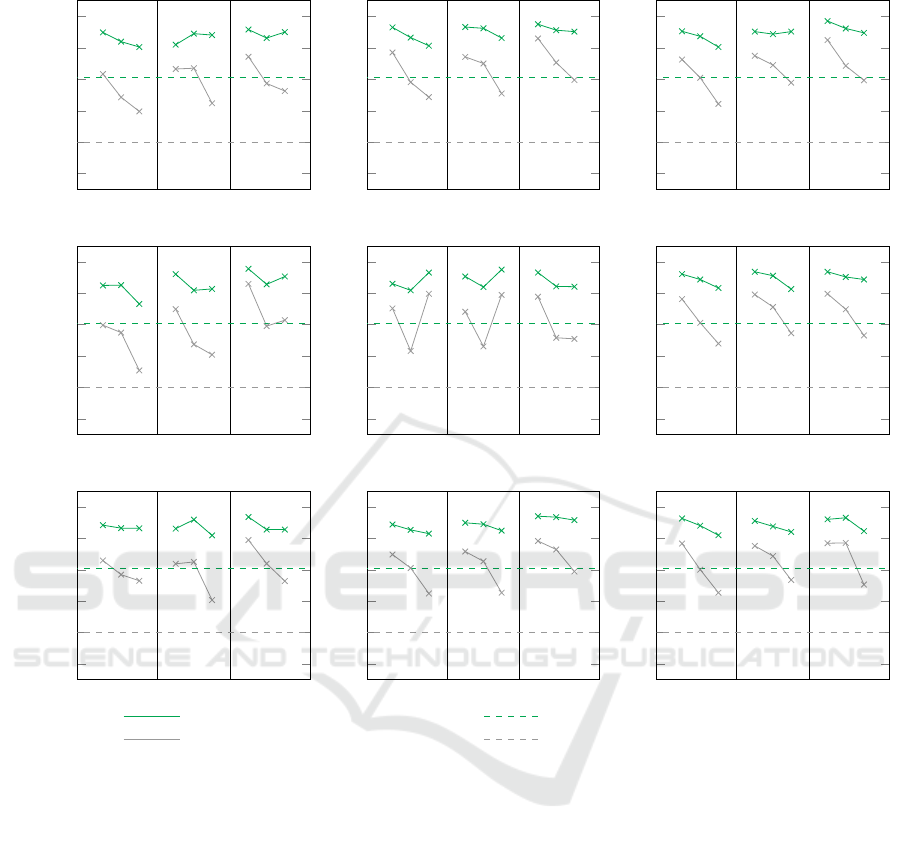
The second part of our evaluation deals with trans-
fer learning (S
3
). The detailed results are shown in
Figure 5. Once again, the expected value is exceeded
SDRank: A Deep Learning Approach for Similarity Ranking of Data Sources to Support User-Centric Data Analysis
425

f=5 f=7 f=10
0
0.2
0.4
0.6
0.8
1
n = 10 000
rep = 10
f=5 f=7 f=10
0
0.2
0.4
0.6
0.8
1
rep = 20
f=5 f=7 f=10
0
0.2
0.4
0.6
0.8
1
rep = 30
f=5 f=7 f=10
0
0.2
0.4
0.6
0.8
1
n = 100 000
f=5 f=7 f=10
0
0.2
0.4
0.6
0.8
1
f=5 f=7 f=10
0
0.2
0.4
0.6
0.8
1
f=5 f=7 f=10
0
0.2
0.4
0.6
0.8
1
n = 1 000 000
f=5 f=7 f=10
0
0.2
0.4
0.6
0.8
1
f=5 f=7 f=10
0
0.2
0.4
0.6
0.8
1
Mean Precision (Top-4) of our approach Statistical Probability (Expected Value)
Mean Precision (Top-1) of our approach Statistical Probability (Expected Value)
Figure 5: Overview of the mean precision achieved with regard to transfer learning (S
3
). For each combination of instances n,
repetitions rep and features f the mean precision achieved with different number of domain-foreign features w (0, 2, 4 from
left to right) is shown.
in all cases. For the higher baseline of 0.8 discussed
in scenario S
2
, this baseline can only be exceeded by 2
models in this scenario (2.5 percent). However, when
the baseline is lowered to 0.6, i.e., in 3 out of 5 cases a
beneficial data source is suggested and all models are
again able to outperform the baseline. For the top-1
evaluation, the results are similar, and the mean pre-
cision decreases to 21 percent (17 out of 81 models).
If we once again lower the baseline by one step to
0.4, i.e., a beneficial data source is found in 2 out of
5 trials, the baseline is exceeded in 83 percent of the
configurations examined (67 out of 81 models).
Regarding the domain-foreign features, the
achieved mean precision lowers again. For the top-1
evaluation, the achieved mean precision is 0.6 with-
out domain-foreign features, 0.52 with 2 domain-
foreign features and 0.4 with 4 domain-foreign fea-
tures. For the top-4 evaluation, the mean precision
decreases from 0.75 without domain-foreign features
to 0.73 with 2 domain-foreign features and 0.69 with
4 domain-foreign features.
In terms of repetitions, the achieved mean preci-
sion for the top-1 evaluation is 0.47 with 10 repeti-
tions, 0.52 with 20 repetitions, and 0.53 with 30 rep-
etitions. For the top-4 evaluation and with 10 repeti-
tions, the mean precision achieved is 0.71, 0.73 with
20 repetitions, and 0.73 with 30 repetitions.
Once again, no influence of a different number of
instances is apparent, and the achieved mean preci-
sion varies only slightly (top-1: 0.51; 0.5; 0.5 and
top-4: 0.73; 0.72; 0.73).
ICEIS 2023 - 25th International Conference on Enterprise Information Systems
426

3.4 Discussion
In our evaluation, we trained different neural net-
works based on varying parameters and assessed their
precision with respect to the suggestions of benefi-
cial data sources. First of all, it should be noted that
the expected value, i.e., the baseline, was always ex-
ceeded. For the setup of our evaluation, only 5 dif-
ferent domains were used, which is why the expected
value is comparatively high. In reality, it can be as-
sumed that there are many more different domains
available to a domain expert, and with each additional
domain, the expected value drops significantly. How-
ever, the comparison of the first two scenarios S
1
and
S
2
shows that our approach is not noticeably affected
by an additional unfamiliar domain available. Thus,
we can expect that similarly promising results can be
achieved if additional domains are provided and that
the selection of beneficial data sources can be aided
tremendously for a domain expert.
A more detailed analysis of the various parameters
shows that the models that were trained on a larger
number of features achieved better results on the test
datasets. Therefore, we conclude that context groups
become more apparent with more features. In addi-
tion, the fact that context groups are detected less ef-
fectively with less features could also be related to the
fact that we relied on combinations instead of permu-
tations in order to reduce training complexity.
The number of domain-foreign features also has a
noticeable effect. Here, we found that the achieved
mean precision decreases, in particular for the top-1
evaluation. However, a beneficial data source would
still be suggested in approximately every second at-
tempt and the expected value is significantly ex-
ceeded. Since our approach targets domain experts,
they can manually check the suggestions. We expect
the top-4 performance to be more relevant for this rea-
son, since four data sources can be easily reviewed for
suitability and the most beneficial data source can be
manually selected. In this case, there is hardly any
influence by domain-foreign features.
With regard to the number of instances, no partic-
ular influence of the different parameterization could
be found. Yet, this is not surprising and meets our
expectation, since for the vectorization of a feature
mainly a fraction of metrics is used, which does not
change much by including more data. Similarly, we
did not find a stronger influence of the number of rep-
etitions. Indeed, the precision increases slightly, but
at the expense of a longer training time.
In terms of the evaluated transfer learning, it
should be noted that the achieved mean precision de-
creases notably and the results on unfamiliar domains
are lower than those on familiar domains. However,
even data sources from unfamiliar domains are pre-
dicted successfully and the expected value is still eas-
ily outperformed.
In summary, the detailed results show that our ap-
proach provides significant benefits for domain ex-
perts. Moreover, different models were compared
during the evaluation and no matter which parame-
terization was used, the expected value, i.e., the base-
line, was always exceeded. Likewise, the same trends
are evident for all parameterizations (with the excep-
tion of n=100 000 and rep=20). This indicates a high
robustness of our approach.
4 RELATED WORK
A common approach to identify related data is the
use of similarity metrics. In general, similarity met-
rics aim to measure the similarity between instances.
Common metrics applied for this purpose are, for
instance, euclidean distance (O’Neill, 2006), Man-
hattan distance (Craw, 2017; Krause, 1975) or co-
sine similarity (Han et al., 2012). These metrics
work on numeric values only, for text, we can ap-
ply metrics like Levensthein distance (Levenshtein,
1966) or Hamming distance (Hamming, 1950). How-
ever, these metrics are limited to pairwise compar-
isons and do not allow comparisons between text
and numeric values. To overcome this issue, often-
times a vectorization of instances or features is ap-
plied. Hereby, various characteristics of the instance
or feature are measured, e.g., occurrences of charac-
ters or number of lowercase characters. As a result,
an instance or feature is transformed into a vector of
meta-features, typically required for deep learning ap-
proaches. However, this kind of meta-features are
limited to statistical information about the data. To
integrate a semantic information, a state-of-the-art ap-
proach is the use of Word2Vec (Mikolov et al., 2013).
Word2Vec calculates a vector for each word based on
a neural network trained on large text corpora. Thus,
a text value is represented by an n-dimensional nu-
meric vector, a so-called embedding. This approach
allows to perform calculations on the representations,
e.g., king-man+woman = queen. Even if similarity
metrics can be applied to measure the similarity be-
tween two vectors, the underlying semantic relation
is not considered, i.e., in the example above it is not
specified if a vector represents a title (queen/king) or
gender (man, woman) or cards in a game. One ap-
proach to add semantic knowledge to data is the use
of so-called context clusters (Rekatsinas et al., 2015),
which structure the semantics in a knowledge base.
SDRank: A Deep Learning Approach for Similarity Ranking of Data Sources to Support User-Centric Data Analysis
427

However, to create such context clusters, a semantic
annotation is required, either manually, or oftentimes
by exploiting existing knowledge bases like DBPedia
Spotlight
6
or web crawling (Limaye et al., 2010), and,
thus, is time-consuming or limited to generic pub-
lic available information. In addition, this approach
requires a clear separation between different context
clusters. Furthermore, closely related to our approach
is the research discipline of schema matching (Rahm
and Bernstein, 2001; Bernstein et al., 2011), which
aims to identify semantically identical features across
different datasets. One approach in this area, which
also relies on vectorization and is able to deal with
both, text and numerical data, is LEAPME (Ayala
et al., 2022). However, we do not aim to identify
identical features, but to identify similar features with
a possible beneficial impact on the analysis.
In summary, all described approaches that deal
with both, text and numeric values are either lacking
the ability to consider semantic information, aiming
on identifying identical features, or require tremen-
dous effort from domain experts for specific domains.
5 SUMMARY AND CONCLUSION
Data mashup tools are often used when domain ex-
perts are involved into interactive data analysis. In
such tools, it is common to work on a large num-
ber of data sources from various domains. Thus, it
is quite difficult for a domain expert to be aware of
all data available, and it is not feasible to review all
data sources by hand. Consequently, a domain ex-
pert needs support in selecting beneficial data sources.
Such a task is challenging because some features can
be assigned to different domains but in principle de-
scribe the same thing, e.g., year numbers can rep-
resent either a car’s model year or a person’s birth
year. To cope with this challenge, we introduced our
novel approach SDRank based on Convolutional Neu-
ral Networks. SDRank allows to suggest additional
beneficial data sources that could contribute to the
analysis based on a set of input features, a so-called
context group. In our extensive evaluation, we trained
different models based on a large number of different
datasets. We showed that the expected value, i.e., our
baseline, was significantly exceeded and this applies
to all trained models. Hence, SDRank is very robust
w.r.t. varying training data. Furthermore, SDRank is
also able to significantly outperform the baseline even
for previously unknown domains. On the one hand,
training can take place in the offline phase before de-
6
https://www.dbpedia-spotlight.org/
ployment, and on the other hand, the training time can
be reduced without loosing much precision by fewer
repetitions and due to the robustness against different
training data. In summary, SDRank provides signifi-
cant advantages for a domain expert in the context of
a user-centric interactive analysis. In the future, we
plan to conduct a user study to evaluate the benefits
of SDRank in real-world use cases.
REFERENCES
Ayala, D., Hern
´
andez, I., Ruiz, D., and Rahm, E. (2022).
LEAPME: Learning-based Property Matching with
Embeddings. Data & Knowledge Engineering, 137.
Bernstein, P. A. et al. (2011). Generic Schema Matching,
Ten Years Later. VLDB Endowment, 4(11):695–701.
Craw, S. (2017). Manhattan distance. In Sammut, C. and
Webb, G. I., editors, Encyclopedia of Machine Learn-
ing and Data Mining, pages 790–791. Springer.
Daniel, F. and Matera, M. (2014). Mashups - Concepts,
Models and Architectures. Springer.
Endert, A. et al. (2014). The human is the loop: new direc-
tions for visual analytics. Journal of Intelligent Infor-
mation Systems, 43(3):411–435.
Hamming, R. W. (1950). Error detecting and error cor-
recting codes. The Bell System Technical Journal,
29(2):147–160.
Han, J., Kamber, M., and Pei, J. (2012). Data Mining: Con-
cepts and Techniques.
Krause, E. F. (1975). Taxicab Geometry: An Adventure in
Non-Euclidean Geometry. Dover Publications, Inc.
Levenshtein, V. I. (1966). Binary codes capable of correct-
ing deletions, insertions and reversals. Soviet Physics
Doklady, 10(8):707–710.
Limaye, G. et al. (2010). Annotating and Searching Web
Tables Using Entities, Types and Relationships. VLDB
Endowment, 3(1–2):1338–1347.
Mikolov, T. et al. (2013). Efficient Estimation of Word Rep-
resentations in Vector Space. In ICLR’2013, Work-
shop Track Proceedings.
O’Neill, B. (2006). Elementary Differential Geometry.
Academic Press.
Rahm, E. and Bernstein, P. A. (2001). A survey of ap-
proaches to automatic schema matching. The VLDB
Journal, 10(4):334–350.
Rekatsinas, T. et al. (2015). Finding Quality in Quantity:
The Challenge of Discovering Valuable Sources for
Integration. In Proceedings of CIDR’15.
Thorndike, R. L. (1953). Who belongs in the family? Psy-
chometrika, 18(4):267–276.
ICEIS 2023 - 25th International Conference on Enterprise Information Systems
428
