Deep Driving with Additional Guided Inputs for Crossings in Pedestrian
Zones
Qazi Hamza Jan, Jan Markus Arnold Kleen and Karsten Berns
Robotic Research Lab, Department of Computer Science, Reinland Pf
¨
alzische-Technische Universit
¨
at,
Erwin-Schr
¨
odinger-Straße 52, 67663 Kaiserslautern, Germany
Keywords:
Autonomous Driving, Deep Driving, Pedestrian Zones, Simulation, Neural Networks, Directional Inputs.
Abstract:
Deep Neural Networks are being used in different applications to solve complex tasks with high precision. One
application, also the focus of this paper, is end-to-end driving. Generally, in an end-to-end approach, a neural
network learns to directly feed values to actuators based on sensor inputs. This paper uses an End-to-end
approach with images and additional direction inputs:left, right and straight for imposing a certain direction
at unstructured and arbitrary intersections of pedestrian zones. Expecting high precision for predicted steering
in pedestrian zones could be uncertain due to the atypical structures of intersections. Findings for increased
accuracy are done using direction inputs with three variants of two approaches: Single and parallel model.
Depth information was included to overcome shadow problems from RGB in simulation, but it resulted in
worsening the drive, and hence removed in further experiments. The experiments are performed in simulation
to verify the utility of the proposed approaches and narrow down the best models for actual hardware. From
the experiments, it is seen that parallel model with front images have performed best. The model drove well
along the paths and followed the given input direction from the user at the crossings. To maintain the length
of this paper, only results for parallel structures are discussed.
1 INTRODUCTION
Automotive industries are working towards safer, reli-
able and human-like driving. Over the past few years,
various aspects of autonomous driving are progress-
ing (Parekh et al., 2022). Researchers benefit from
Machine Learning (ML) algorithms for object detec-
tion (Tian et al., 2019; Erhan et al., 2014), semantic
segmentation (Garcia-Garcia et al., 2017; Yu et al.,
2018), vehicle control (Kuutti et al., 2020) etc. To
take advantage of such encouraging results, this work
uses an End-to-End deep neural network for driving
autonomous vehicles in pedestrian zones. A pedes-
trian zone, in semantic perspective, offer a high vari-
ation in its architecture. It consists of unevenly con-
nected paths. One such example with similar charac-
teristics is shown in Figure 1. Autonomous vehicles
in pedestrian zones are getting more attention (Jan
et al., 2020b; Keen et al., 2021; Alvarez et al., 2019;
Li et al., 2021).
This work deals with the challenges of driving an
autonomous vehicle in uneven pathways and follow-
ing a given direction at a high degree of varying cross
sections. For initial validation of the technique pro-
posed for this work, experiments are performed in a
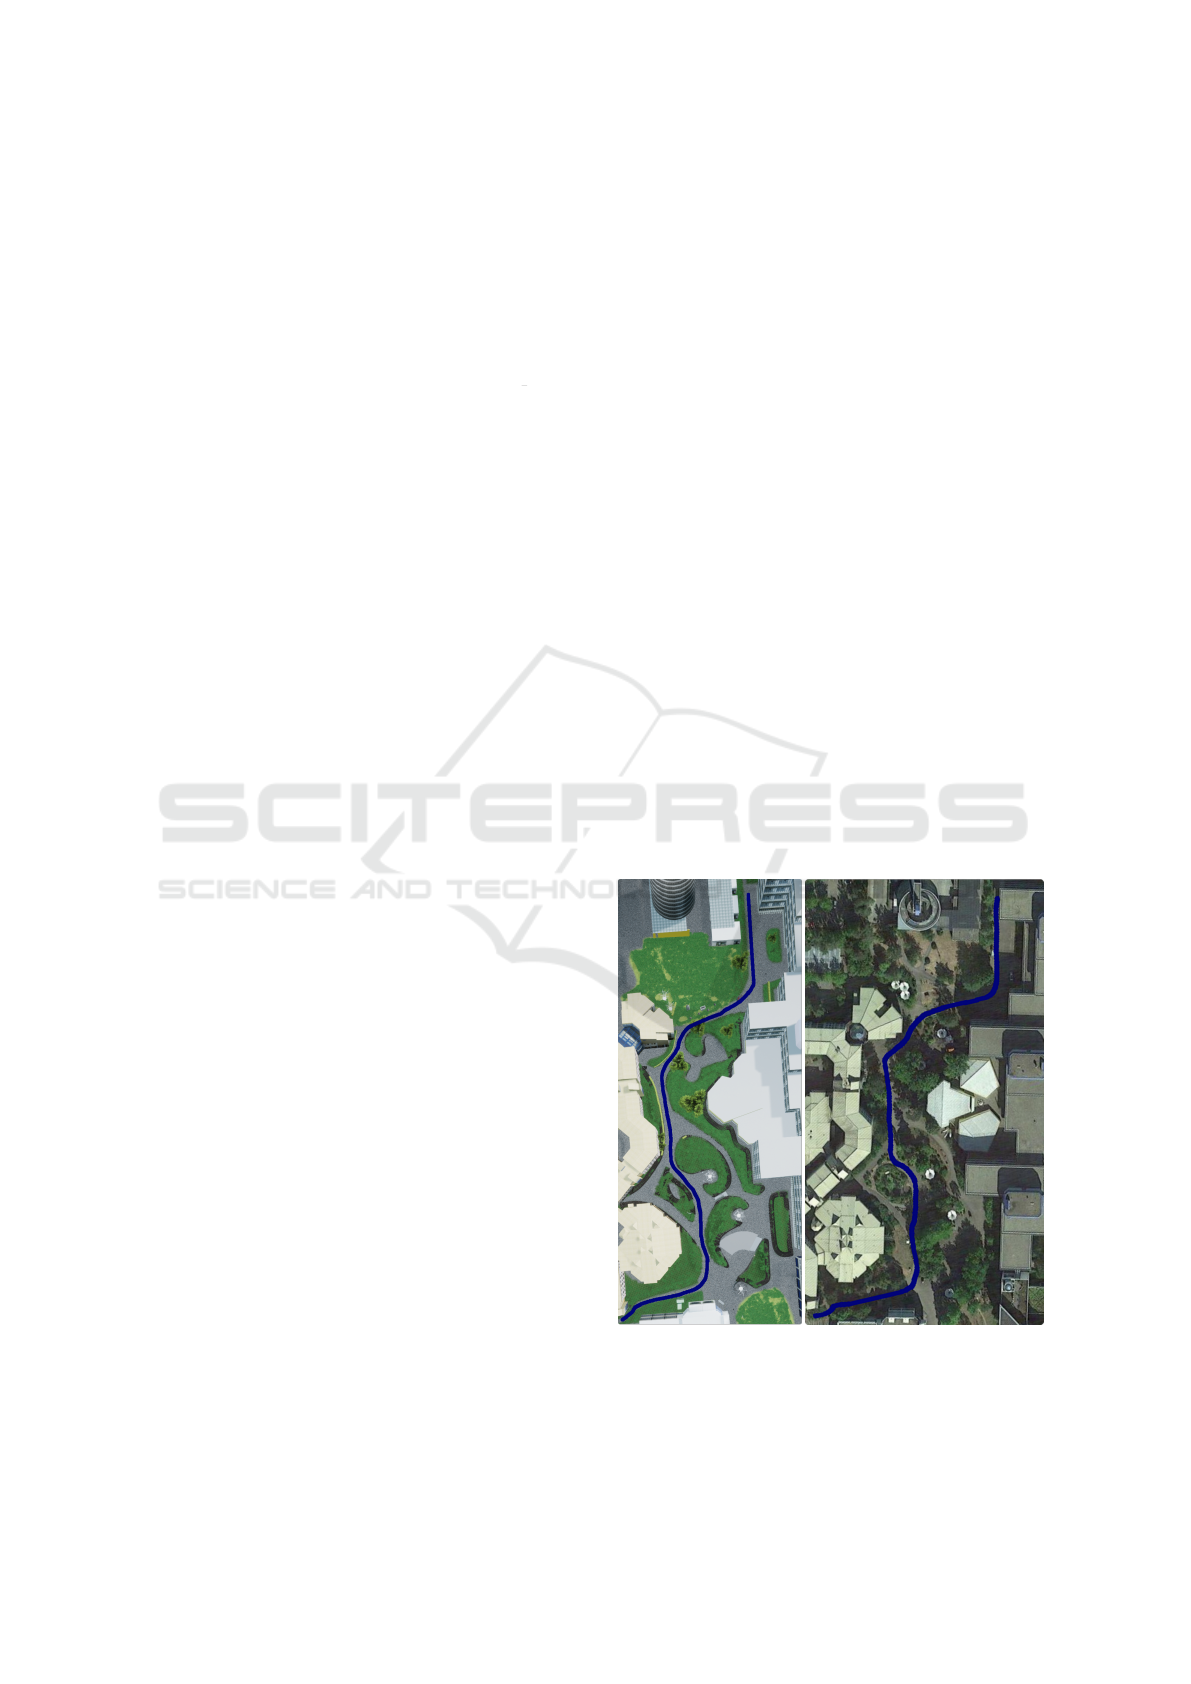
Figure 1: Top view of a small area of RPTU campus. The
left image is a simulated model of the campus in the right
image. The blue line shows the line sights the test drive of
the model trained on the entire campus.
402
Jan, Q., Kleen, J. and Berns, K.
Deep Driving with Additional Guided Inputs for Crossings in Pedestrian Zones.
DOI: 10.5220/0011999600003479
In Proceedings of the 9th International Conference on Vehicle Technology and Intelligent Transport Systems (VEHITS 2023), pages 402-409
ISBN: 978-989-758-652-1; ISSN: 2184-495X
Copyright
c
2023 by SCITEPRESS – Science and Technology Publications, Lda. Under CC license (CC BY-NC-ND 4.0)
simulation environment shown on the left of Figure 1,
a replica of the real environment on the right. The
environment is taken from our previous work in (Jan
et al., 2020a; Jan et al., 2021). The gray texture in the
simulation is the walking and driving zone connecting
buildings within the campus.
End-to-end deep driving (Tampuu et al., 2020;
Pomerleau, 1988; Muller et al., 2005; Bojarski et al.,
2016; Codevilla et al., 2018), also known as behav-
ior reflex, methodology processes the input sensory
data directly and generates actuator values. Major-
ity of researchers use RGB cameras as input (Kaur
et al., 2021; Parekh et al., 2022; Toromanoff et al.,
2018) and control the steering and velocity of the ve-
hicle. Driving in an urban street environment has the
simplicity of clear markings and lanes with fixed ge-
ometric crossings. On the contrary, pedestrian zones
not only offer anfractuous pathways but also irregular
crossways.
To solve the problem of selecting the desig-
nated path for the goal at intersections, authors have
used route planners such as TomTom and OSM
maps (Hecker et al., 2018). They claim that using a
route planner gives better prediction of steering angle.
For complex navigation systems, multiple approaches
are used which carry its own syntax of giving direc-
tion to the destination. Such syntax can not always
be integrated in the higher level map. To tackle such
problem, this work implements generic directions:
left, right and straight are applied for signaling at the
intersections. For this work, the type of turning is ig-
nored, for example, sharp turn, fork turn, etc. Since
there are various shapes of crossing, it is not possible
to assign them to a particular category. Hence, fixed
generic commands were chosen based on driver intu-
ition to the crossing angle.
The vehicle used for this work is a type of
minibus, which is mounted with three cameras. The
configuration is explained in Section 2. This study
drew partial inspiration from (Codevilla et al., 2018).
To realize the effect of different variables in the train-
ing process, multiple inputs are used: three cameras
(RGB and depth images), speed, direction, steering
values and throttle. Details are given in Section 2.
For this work, two types of approaches: single and
parallel models are exploited with three variants based
on number of cameras and the use of velocity input.
These approaches are explained in Section 3.
Note. All the variants include direction inputs along
with the combination of other inputs. Due to unavail-
ability of such data with particular inputs, data gath-
ering process is also part of this work discussed in
the next section. Detailed experiments are given in
section 4. From the aforementioned discussion, the
novelty of this work can easily be articulated as fol-
lowing:
• Data collection
• Model creation
• Examining the effect of single and parallel models
including the combination of all the input variants.
• Interpreting the effect of shadows
• Deciding for best approach
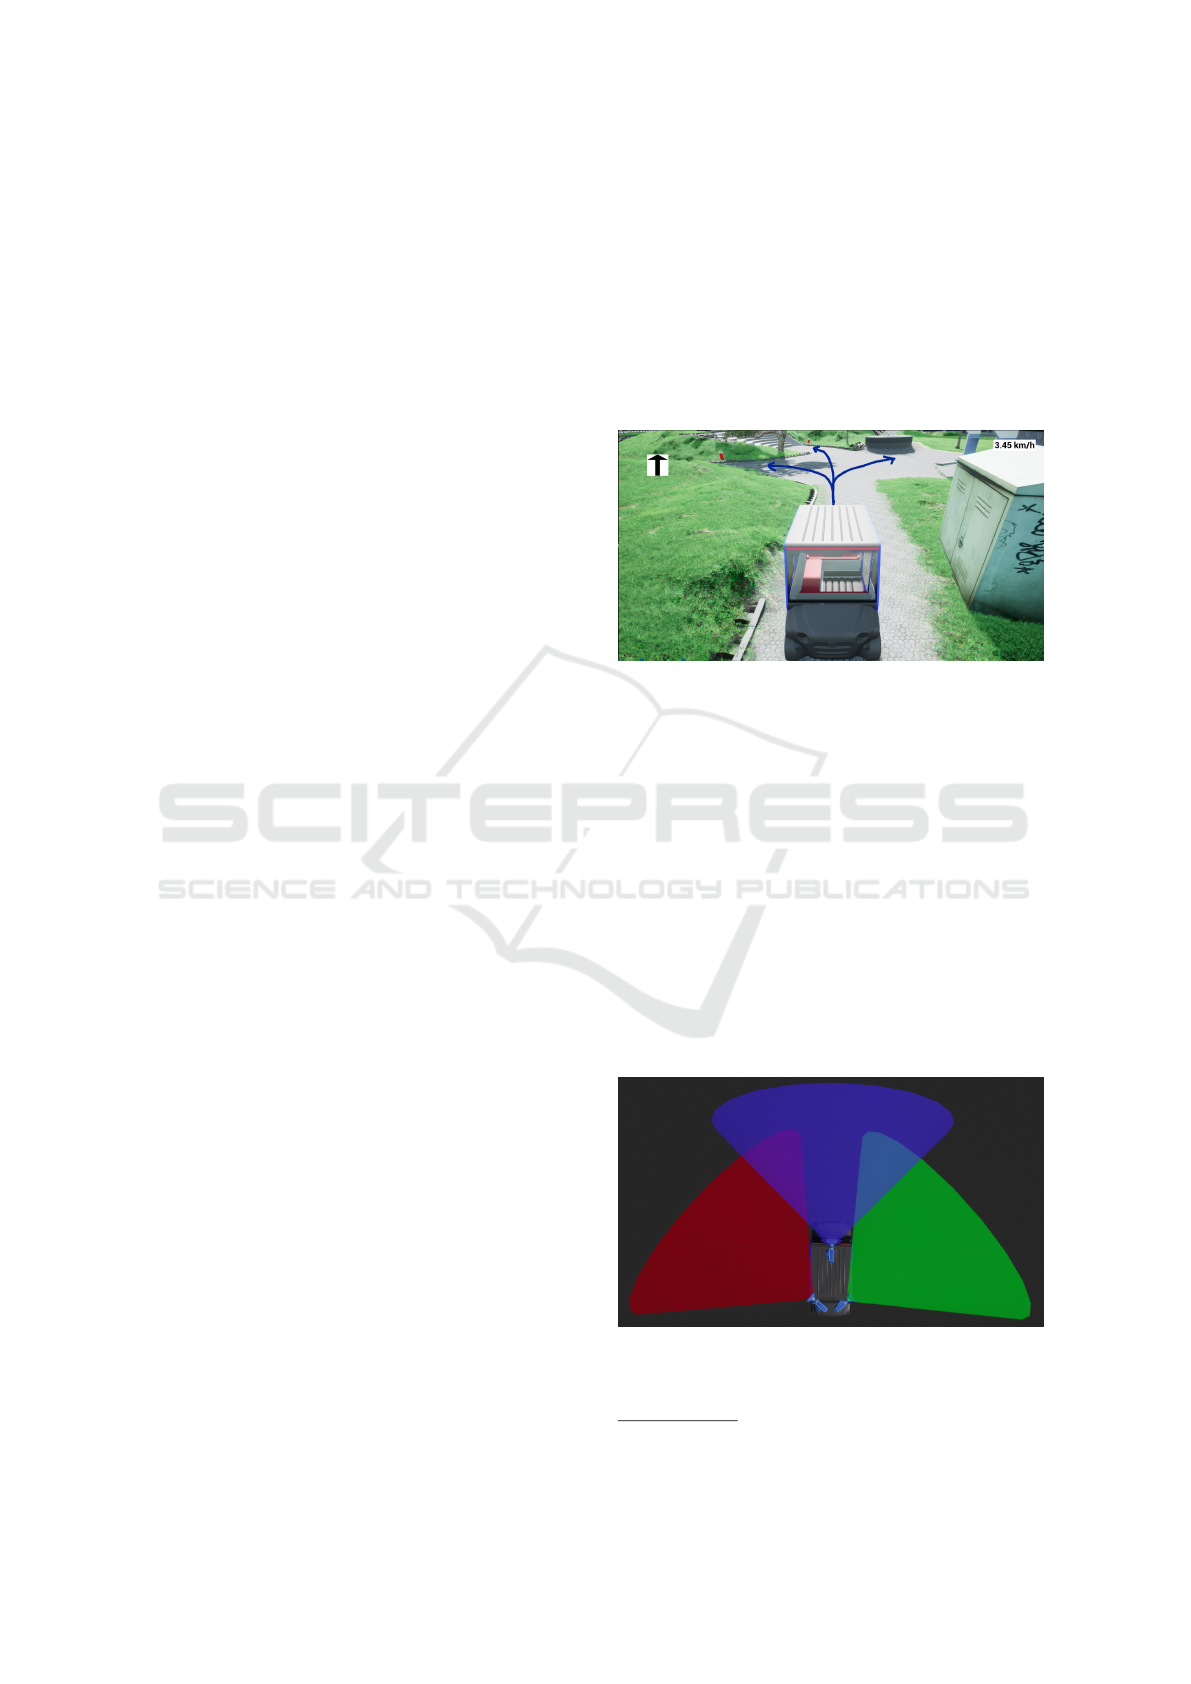
Figure 2: A virtual replica of vehicle and campus in sim-
ulation. The vehicle is a driver-less minibus used in the
campus (Jan and Berns, 2021).
2 DATA COLLECTION
Unreal Engine
1
(UE), a game development tool, is
used for training and testing models in this work. UE
offers a realistic rendering which supports the use of
visual sensors. The vehicle and RPTU campus were
recreated in the simulation as shown in Figure 2. A
comparison of the virtual and real world can be seen
in Figure 1. The proposed work was conducted in
simulation due to the following reasons:
• Simplicity. Since the neural network requires a
huge amount of data to train the network, it is not
Figure 3: Camera configuration on the bus. It consists of
front, rear-left and rear-right cameras. The configuration is
similar to the on used for the actual robot (Jan et al., 2022).
1
https://www.unrealengine.com/
Deep Driving with Additional Guided Inputs for Crossings in Pedestrian Zones
403
laborious work, compared to real systems, to do
such kind of initial testing in simulation.
• Accessibility. It was possible to collect data in
locations where a real vehicle can not drive due to
temporary restrictions or constructions.
• Safety. Most concerning aspects of driving in
a pedestrian zone are the pedestrians. In view of
the fact that vehicles and pedestrians have to share
the same space, it becomes critical to have safe
driving. In the real world, such concerns hinder
testing.
• Exploitation. Simulation allows us to simulate
every feature of the environment. Therefore the
validation of reasoning becomes easy.
For data collection, the vehicle was driven by a hu-
man driver with an average speed of 6 km/h (restricted
speed in pedestrian area). The vehicle was equipped
with three cameras, configuration shown in Figure 3.
Using three cameras amplifies the surrounding view
relative to the front of the vehicle. To cater the shadow
problem, additional depth images were taken into ac-
count. Hence, the system is able to drive in varying
light conditions.
Data was collected every 0.5 seconds. It consisted
of the following information:
• RGB images from all the three cameras shown in
Figure 3
• Depth image from the front camera
• Current speed of the vehicle
• Current throttle as a floating value from -1 to 1
• Three direction commands as integer: 0-straight,
1-left and 2-right
• Timestamp
• Addition comments
During the training of the model, since a human
was driving the vehicle with a certain direction and
average speed; throttle, steering and directions were
recorded directly from the user. To keep track of
countless situations and conditions such as presence
of pedestrians, presence of shadow, type of configu-
ration, variant kind and so on, were encoded in ad-
ditional comments. 76 driving sequences were per-
formed with more than 30000 frames recorded in to-
tal. Driving itself was based solely on the opera-
tor. The operator steered the vehicle using a joystick.
Speed of the vehicle was usually kept constant to a hu-
man walking speed. In order to give the direction, the
operator was told to press the given key number as-
signed to the respective direction once the intersection
was fully visible. By default, straight-direction was
enabled regardless of size or curve of a standard path.
One particular scene, with possible turning, is over-
laid in Figure 2. The blue arrow shows the driver’s
intuition of a possible driving path at the cross sec-
tion.
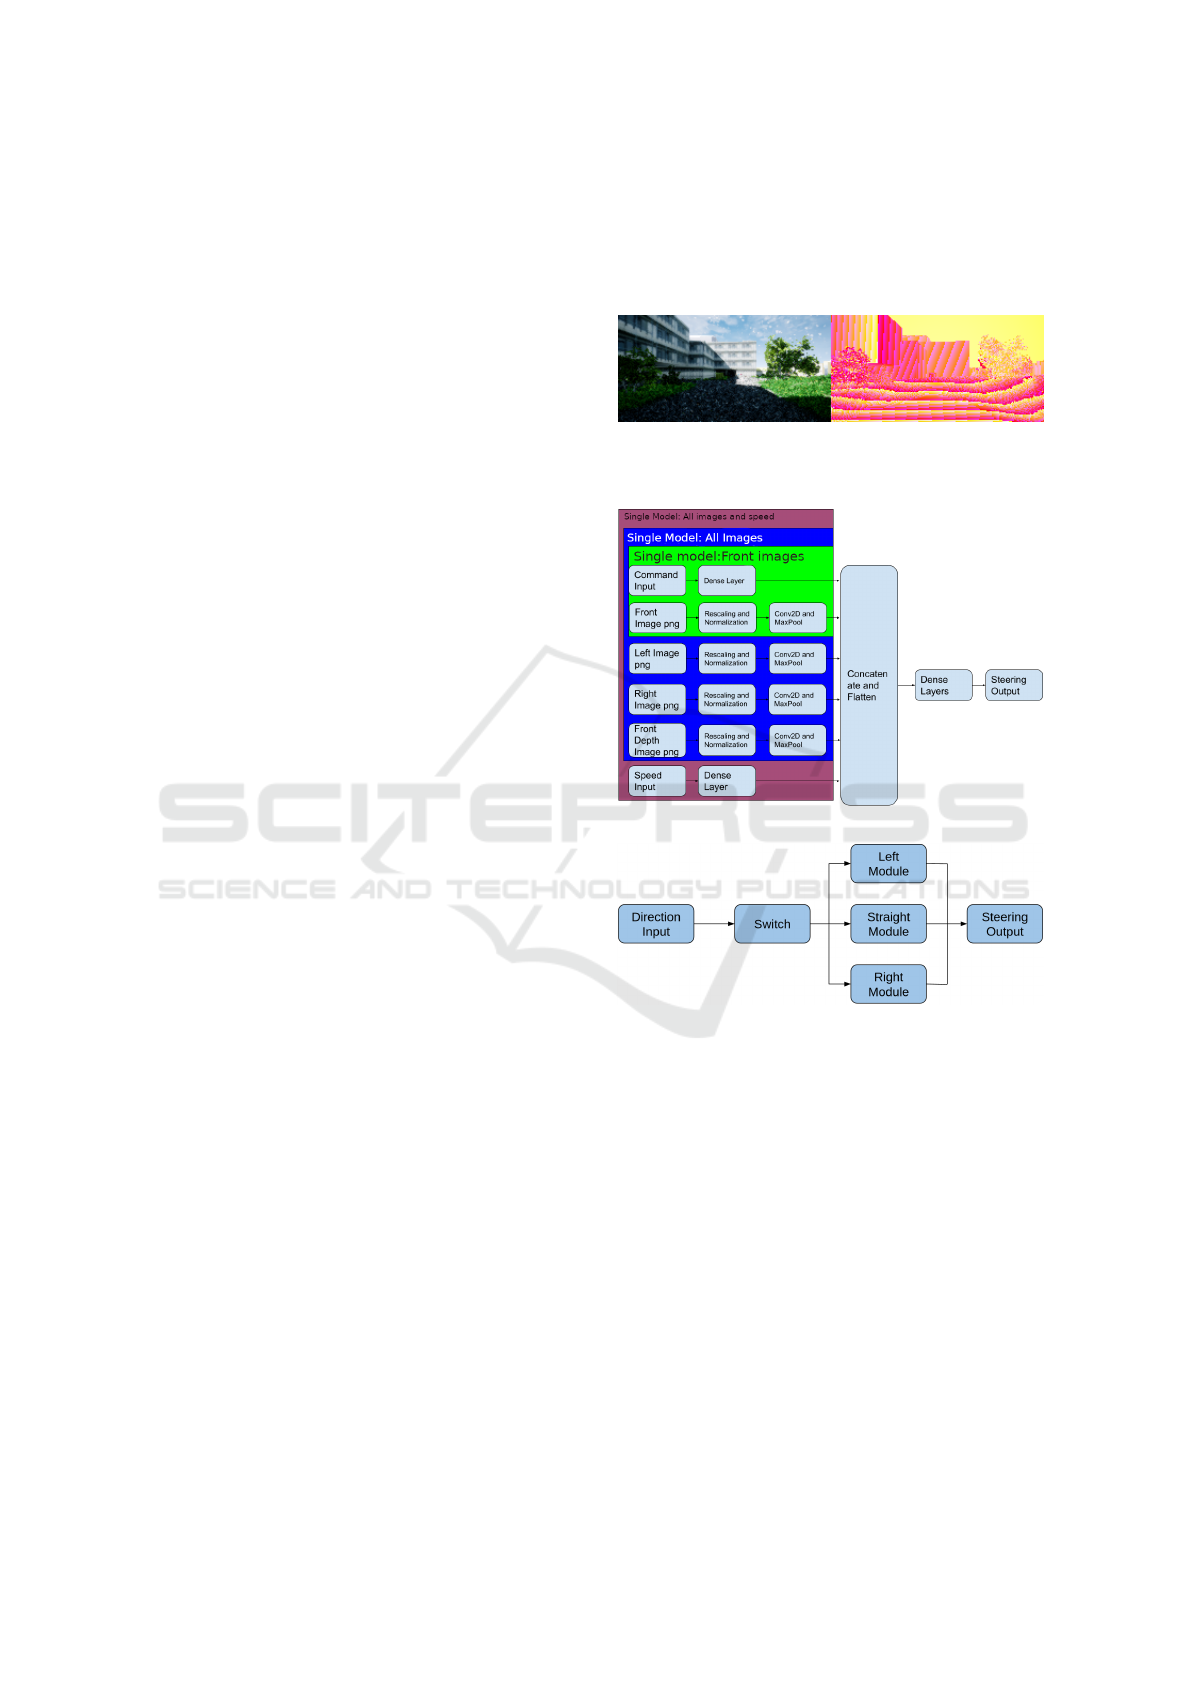
Figure 4: The figure assimilates RGB data to the corre-
sponding depth data. Undoubtedly, the shadow is indis-
cernible in depth image.
(a) Network structure for all images and speed.
(b) Single network structure from above image used sepa-
rately for different directions.
Figure 5: (a) Single Model: Single network structure for
input with all images and speed. (b) Parallel model: The
left, right and straight modules are equivalent to the single
structure as in the top image, except for the command input
which is used to switch between the three models.
3 APPROACH
Unlike single images given as input for classification
and detections (Hoiem et al., 2005; Zhu et al., 2014),
the model implemented for this work uses multiple
inputs with varied configuration. One of the objective
was to explore different combinations of inputs and
model type for better results. The division of applied
approaches is given in flow chart of Figure 6. Firstly,
the approach was bifurcated into a single and paral-
VEHITS 2023 - 9th International Conference on Vehicle Technology and Intelligent Transport Systems
404
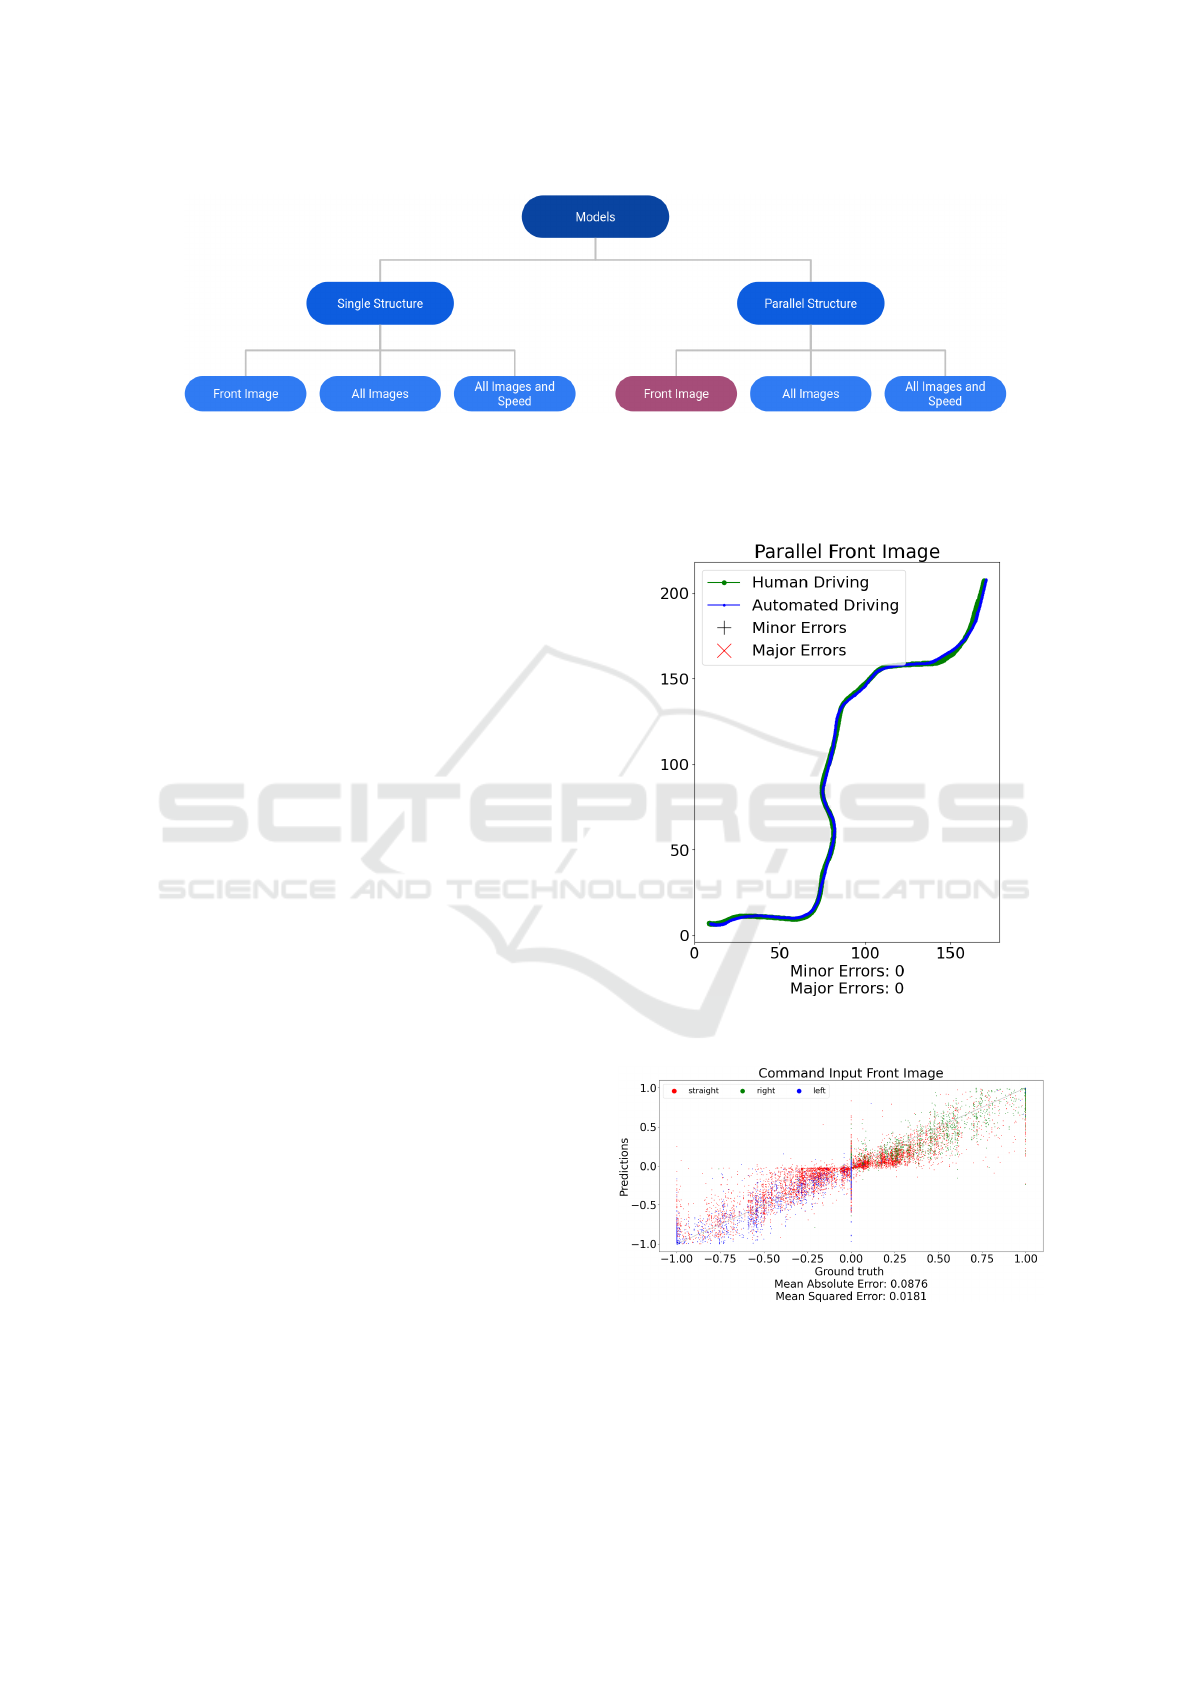
Figure 6: Block diagram for two variations of model: single and parallel models including the direction inputs with three
variants of input: front camera, all cameras, and all camera with velocity.
lel model. The Basis of such bifurcation was a train-
ing model with direction data. Single structure, as
the name suggests, has one model trained with all the
direction inputs. For parallel model, sub-models con-
sisting of each single structure were tabulated specific
to one direction input. One model was activated based
on direction input by a switching technique. The de-
sign of both models can be seen in Figure 5. The con-
volution neural networks are modified to the given in-
puts. After concatenation and flattening, dense layers
are used for output prediction of steering. For clarity,
the variants are segregated in to different color seg-
ments shown in Figure 5a. The green segment shows
input for the first variant, the blue shows the inputs for
the second input and maroon color shows the inputs
for all inputs including green and blue segments.
The last layer of Figure 6 gives the type of in-
puts for testing precision. The models were tested
first with only the front camera, then with all the three
cameras, and finally using additional speed input with
all cameras. Using all cameras confirms the effect of
a wide view on driving. Speed was added to check the
impact on steering values.
4 EXPERIMENTS
The experiments were performed in the same campus
environment by giving different directions at cross-
ings and adding other props for reasoning of unusual
behavior. This section explains the prediction error
for all the models and based on the best performance,
the respective model is chosen for further evaluation.
4.1 Prediction Errors
As a first step in evaluating the network, model pre-
dictions were compared to the ground truth that was
recorded when gathering training data. For each
model, a subset of data points are randomly selected
which is compared to human driving (the training set).
Mean Square Error (MSE) can be calculated with the
given data which is demonstrated in Table 1.
Figure 7: Comparison plot of Trajectory for testing and
ground truth.
Figure 8: Relationship between the steering predictions of
Single Front Images model and steering of human driver.
Further investigating from Table 1, single model
with all variants shows high variances in performance
between different directions, the spread can be seen
Deep Driving with Additional Guided Inputs for Crossings in Pedestrian Zones
405
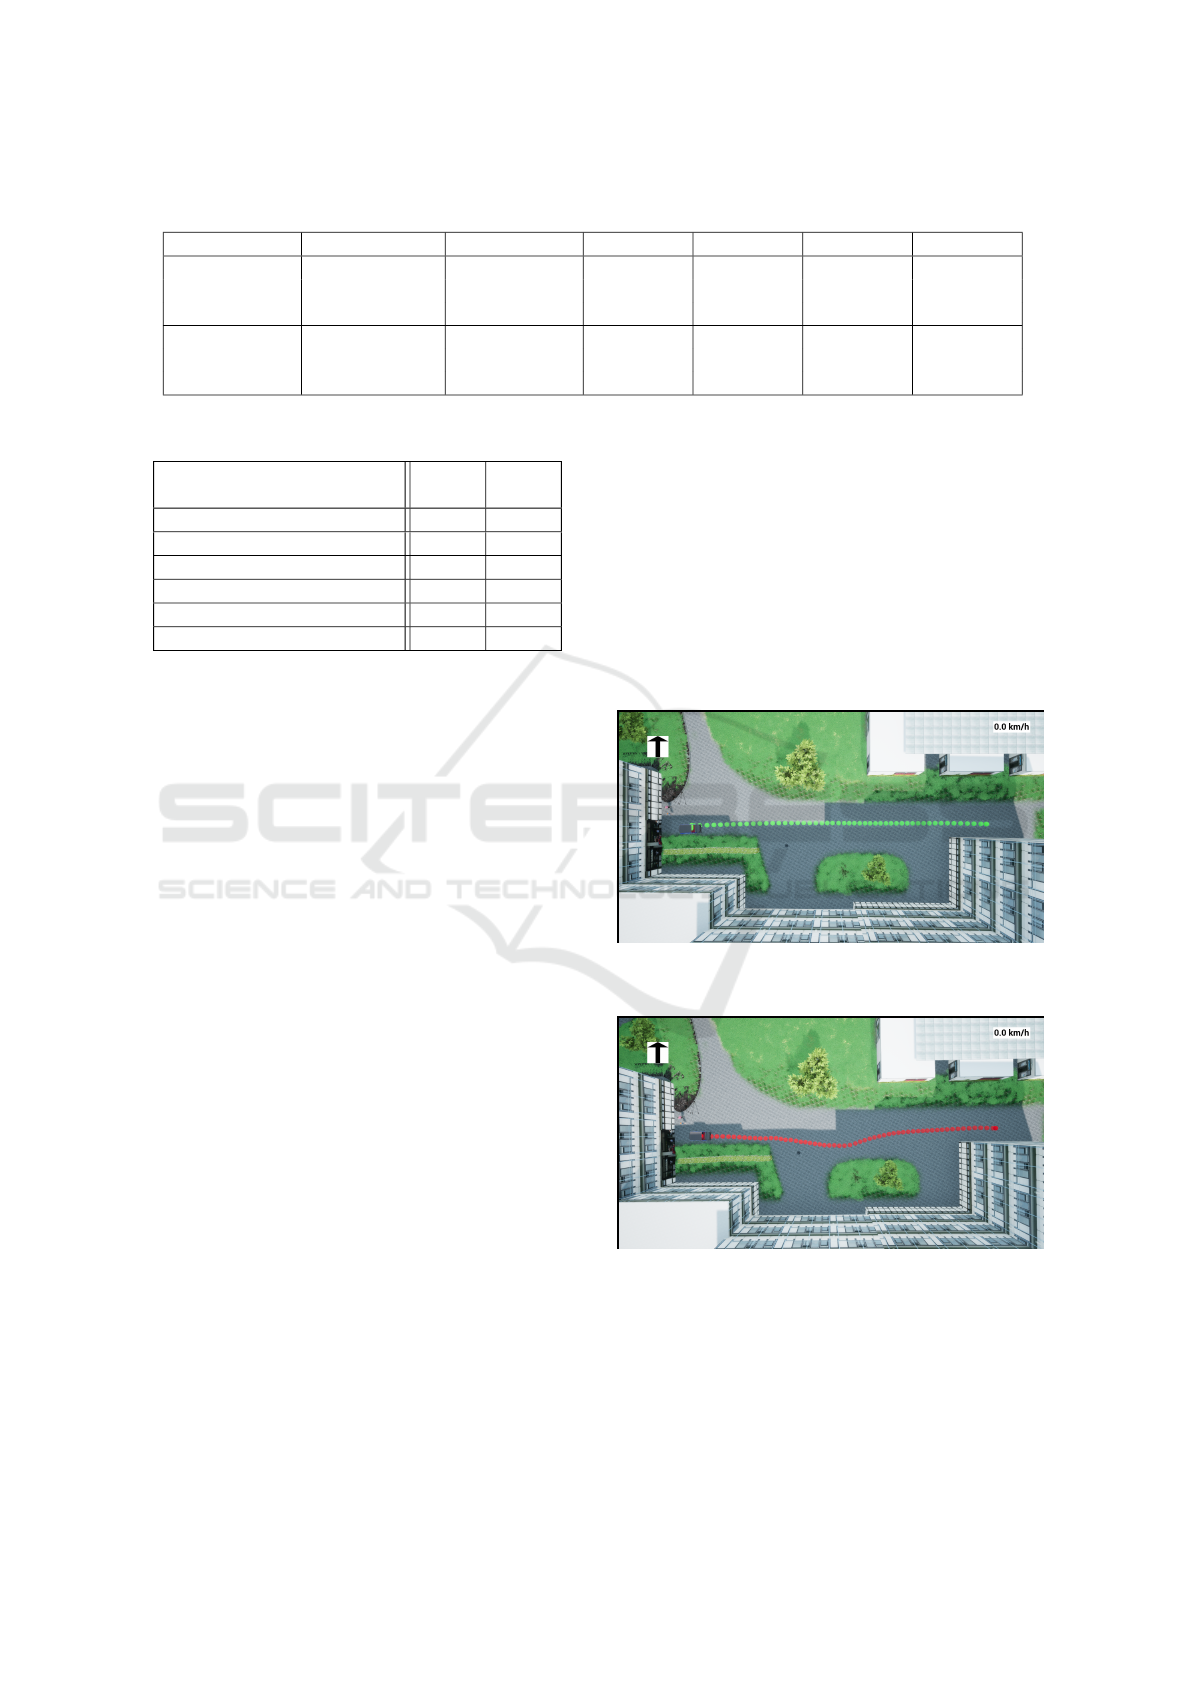
Table 1: Mean Squared Error of predictions and ground-truth.
Model Used Camera Speed Input All Straight Left Right
Single
Front No 0.0181 0.0169 0.0214 0.0229
All No 0.0214 0.0183 0.0185 0.0418
All Yes 0.0290 0.0247 0.0497 0.0385
Parallel
Front No 0.0219 0.0233 0.0237 0.0206
All No 0.0174 0.0168 0.0204 0.0201
All Yes 0.0225 0.0230 0.0213 0.0202
Table 2.
Model Minor
Errors
Major
Errors
Single:Front Image 1 5
Single:All Images 5 4
Single:All images, speed 4 7
Parallel:Front Image 0 0
Parallel:All Images 3 0
Parallel:All images, Speed 2 1
in Figure 8. One reasoning for this could be the un-
equal distribution of the training data. Unequal distri-
bution of data in terms of direction is coherent to the
fact that encountering crossings is seldom than driv-
ing paths between the crossings in pedestrian zones.
Hence, this results in over-fitting of the model for this
direction. On the other hand, parallel models in which
each model is trained for a particular direction, do not
suffer drastically from this problem. The unequal dis-
tribution does not affect the trained model because ev-
ery model is directed to one direction.
The inclusion of speed data in the model reduces
the accuracy of the overall model for both structures.
Incorporating the left and right cameras along with
the front camera pertain to ambiguity in comprehend-
ing the results. Although, using additional cameras
increases the range of view, it also amounts for more
unnecessary information such as the patches enclos-
ing the pedestrian walk. Despite the sub-models of
the parallel structure being trained individually on
less data compared to a single structure, it performs
similarly if not better. This is established in the next
subsection.
4.2 Real-Time Testing
Following the insights of all the models by compari-
son of model predictions with ground truth, it is not
sufficient to claim the credibility of the model in terms
of standard driving. Further performance evaluation
is done by letting the model drive the vehicle in a
simulated environment with the user directing at in-
tersections by giving one of the three direction inputs.
4.2.1 All-Model Testing
The tests were done on different routes of the campus,
but on the account of comparison, a specific path was
chosen marked with blue in the Figure 1. A trajec-
tory comparison for Parallel model with front image
is given in Figure 7. For quantifying the results, the
term minor and major error was established. Vehicle
going off-path during driving was considered a minor
error, whereas wrong turns or colliding into obstacles
was defined as a major error. The comparison can be
seen in Table 2.
(a) Green dotted line shows the path driven by user during
the training process.
(b) Red dotted line shows the path of driving during the test
phase.
Figure 9: The images show the top view of driving path by
human (top) and model (bottom). The curve in the bottom
image shows the effect of shadow on the network.
VEHITS 2023 - 9th International Conference on Vehicle Technology and Intelligent Transport Systems
406
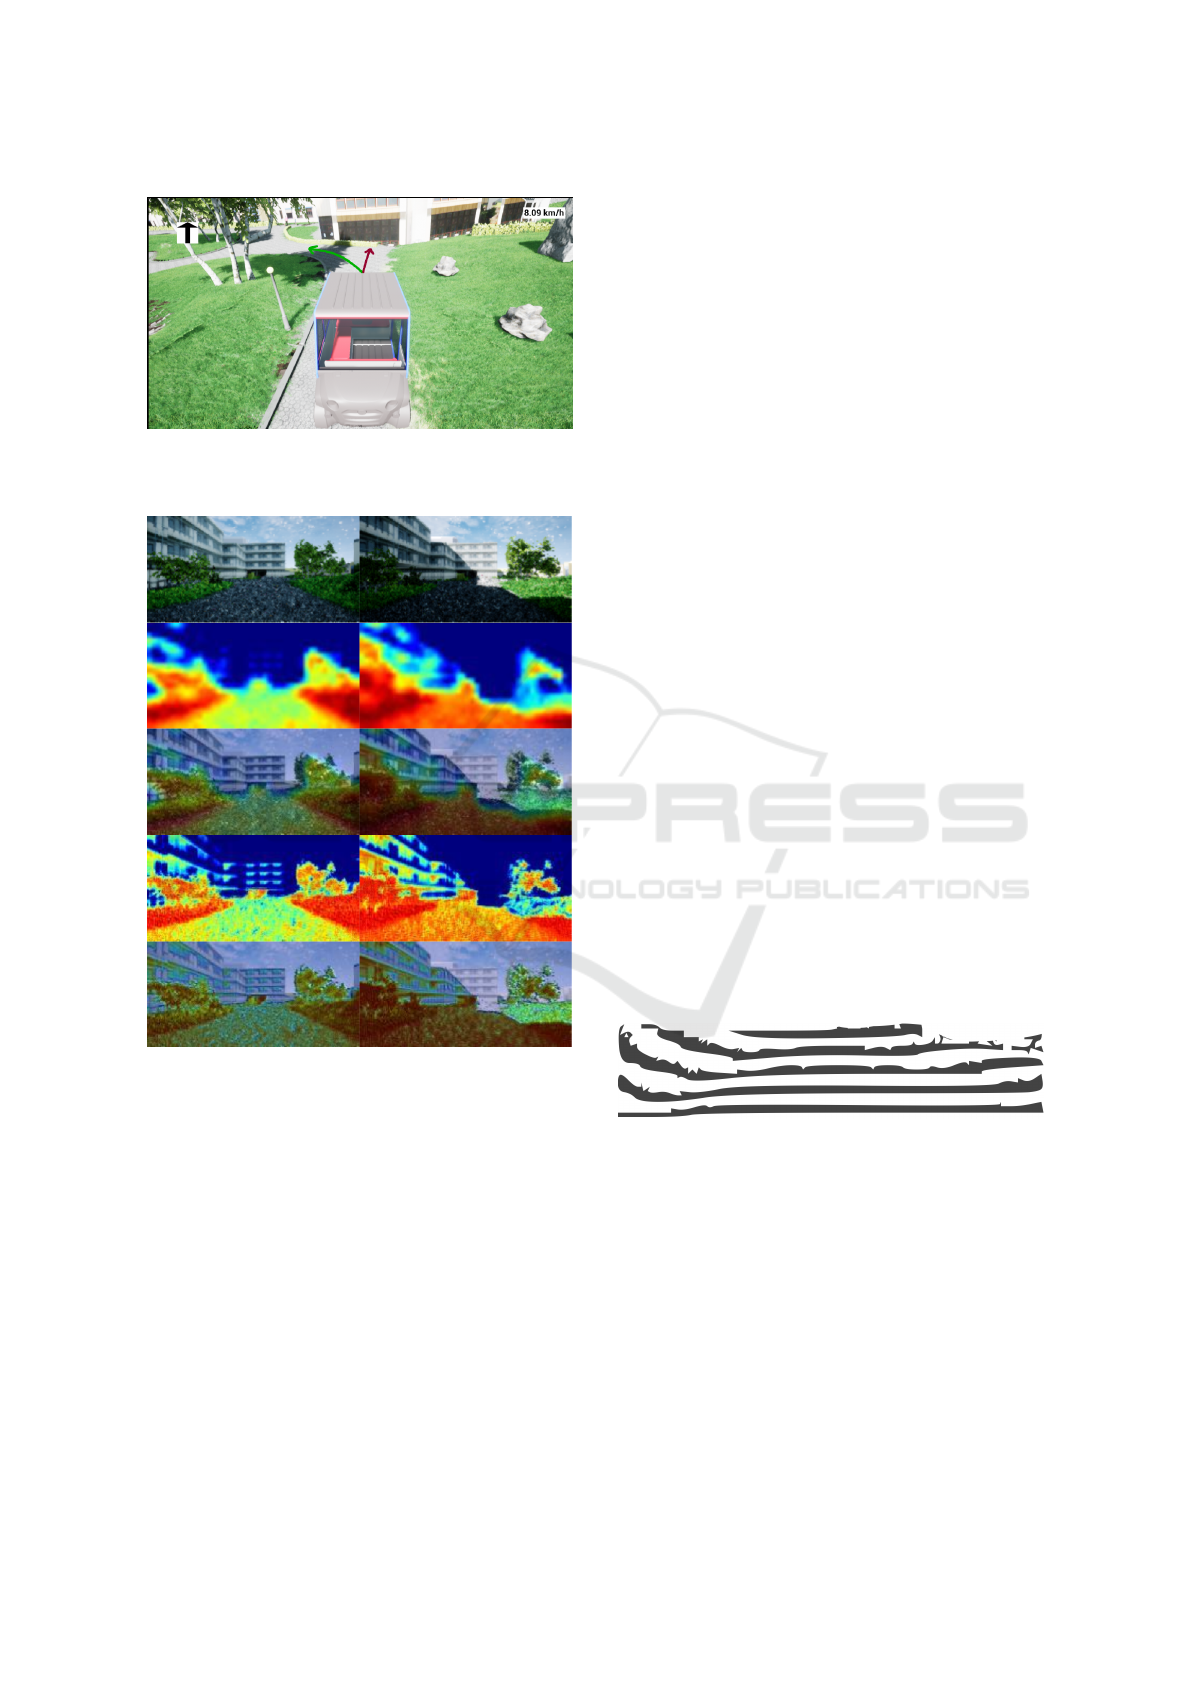
Figure 10: Effect of shadow on driving. The green arrow
shows the consistent path driven by the user. Red arrow
indicates the path driven by the network.
Figure 11: The attention maps from the model for two sim-
ilar scenarios taken from two convolution layers. One con-
sists of shadow and one without shadow.
4.2.2 Shadows
Shadows were the major problem identified during
the phase of testing. The network was unable to de-
tect the true path in the presence of a shadow. One
particular example is shown from the top view in Fig-
ure 9. The top image shows the vehicle driven by a
human. Shadows were always ignored when driven
by a human throughout the campus. Strikingly, the
model understood the change in contrast of shadow
and non-shadow region as the boundary of the path.
This is implied by the slight curve of the red dotted
line in Figure 9b. For justification of this interpre-
tation, another example with similar context is pre-
sented in Figure 10. Green arrow shows the user
driven pathways, and red arrow is wrongly driven by
the network. To visualize the effect of shadows, atten-
tion map from network layer was overlaid over RGB
image seen in Figure 11. The second row from above
in Figure 11 shows the attention map from a shal-
low layer of the network, while the fourth row shows
the attention map from a deep layer of the network.
The color gradient shows that the system perceives
shadows as boundary regions and does not consider
as drivable region. Also, the red regions enables the
vehicle to move in a straight path.
4.2.3 Depth Images
Researchers have used depth images to tackle shad-
ows in RGB images (Krywolt, 1993; Bi et al., 2022;
Xiao et al., 2014). Depth images are invariant to shad-
ows existing in color images. A clear example is il-
lustrated in Figure 4. The comparison shows that the
depth clearly ignores the disparity caused by shadows.
Initially, it was proposed to use depth images as ad-
ditional input due to aforesaid reasons. Throughout
the tests, the driving was recurrently skewed from the
given pathway. Observing the depth images, it is not
easy to differentiate between pathways and surround-
ing areas. In other words, there exist no clear bound-
aries. Environments, such as used for this work, have
plain grass surrounding the paths. From a depth per-
spective, it is difficult to differentiate between such
regions. Figure 12 extracts the silhouettes of ground
from depth image of Figure 4 to see this relation. For
this scene, the silhouettes slightly rise at the corners.
As a result, the depth images were removed from fur-
ther testing.
Figure 12: Silhouette for ground region from depth image
shown in Figure 4.
4.2.4 Blockage Effect
In a specific region, there was one instance where the
system experienced difficulty in identifying the cor-
rect path and accurately interpreting commands, as
depicted in the figure 13. Evidently, the system mis-
takenly perceived the large paved area ahead of the
vehicle as a dead end, akin to a parking space, and
consequently interpreted it as the designated route to
drive on when instructed to proceed straight. The en-
vironment in question comprises authentic dead ends
Deep Driving with Additional Guided Inputs for Crossings in Pedestrian Zones
407
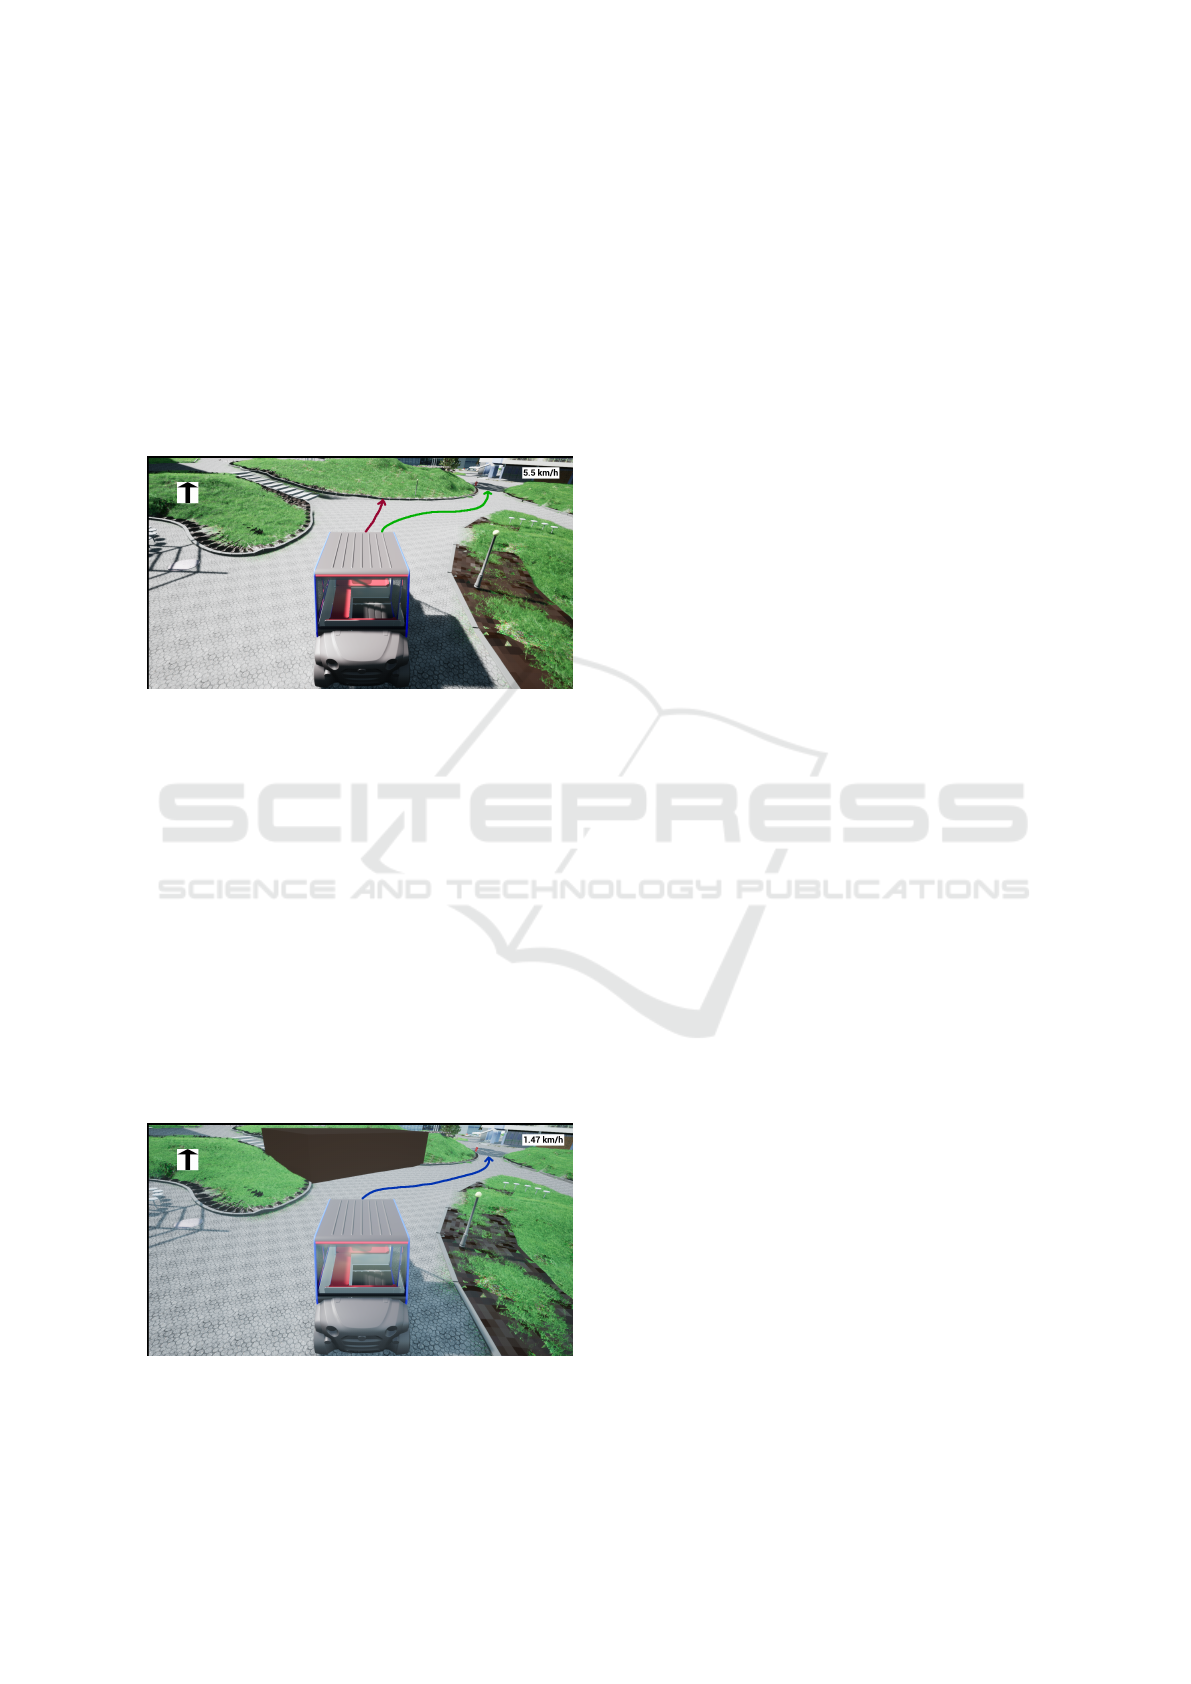
that the system is trained to navigate through. No-
tably, the straight command directs the system to fol-
low the path in a manner consistent with human in-
terpretation of following the correct curve. However,
it is important to note that the same command can be
issued by an operator intending to park the vehicle in
this space, which underscores the potential ambigu-
ity of the commands. Thus, there is likely a need for
additional commands to enhance the system’s func-
tionality. The green arrow shows the drivable path for
this region, red arrow shows the predicted path.
Figure 13: The system can not identify the right curve as the
correct choice and drives in a straight line as shown by Red
arrow, colliding with the grass hill if not stopped. Changing
the command to ”right” causes the vehicle to follow the
right curve illustrated by blue arrow, but this should not be
needed as the straight command means following the path.
To explore this issue in greater depth, an obstruc-
tion in the form of a wall was introduced in the front
area. Despite the absence of such a blockage in the
training phase, the system successfully identified the
correct path and operated in accordance with it. As
depicted in Figure 14, the driving path is indicated by
the blue arrow. One possible explanation for this out-
come is that the system regarded the stairs located on
the opposite side of the drivable area as a viable path
and thus took a middle course. The introduction of
the obstruction enabled the system to clearly discern
a single path to follow.
Figure 14: The same situation as in figure 13, but the front
and right stair region is blocked off. The system is now able
to identify the right curve (blue arrow) as the correct choice
with straight input.
5 CONCLUSIONS
This paper explores the possibility of using direc-
tions as input to a neural network for crossings in
pedestrian zones. The network was able to follow
the commands correctly and navigate throughout the
path. Based on the number of cameras, speed input
and configuration possibility, different models were
developed and evaluated against each other. From the
findings, it is suggested that using a parallel approach
(having direction specific input sub-model) performs
better than a single model trained on all the given
direction inputs. While the results are encouraging,
the performance lag in some conditions such as light-
ing conditions. Depth image, proposed solution for
shadow problem in simulation, did not assist in over-
coming lighting problem. In fact, depth added more
uncertainty. These shortcomings could be resolved
by further training the system in various environments
and situations, especially situations where the vehicle
is required to recover from a suboptimal position.
REFERENCES
Alvarez, W. M., De Miguel, M. A., Garc
´
ıa, F., and Olaverri-
Monreal, C. (2019). Response of vulnerable road
users to visual information from autonomous vehicles
in shared spaces. In 2019 IEEE Intelligent Transporta-
tion Systems Conference (ITSC), pages 3714–3719.
IEEE.
Bi, X., Yang, S., and Tong, P. (2022). Moving object de-
tection based on fusion of depth information and rgb
features. Sensors, 22(13):4702.
Bojarski, M., Del Testa, D., Dworakowski, D., Firner,
B., Flepp, B., Goyal, P., Jackel, L. D., Monfort,
M., Muller, U., Zhang, J., et al. (2016). End to
end learning for self-driving cars. arXiv preprint
arXiv:1604.07316.
Codevilla, F., M
¨
uller, M., L
´
opez, A., Koltun, V., and Doso-
vitskiy, A. (2018). End-to-end driving via conditional
imitation learning. In 2018 IEEE international confer-
ence on robotics and automation (ICRA), pages 4693–
4700. IEEE.
Erhan, D., Szegedy, C., Toshev, A., and Anguelov, D.
(2014). Scalable object detection using deep neural
networks. In Proceedings of the IEEE conference on
computer vision and pattern recognition, pages 2147–
2154.
Garcia-Garcia, A., Orts-Escolano, S., Oprea, S., Villena-
Martinez, V., and Garcia-Rodriguez, J. (2017). A re-
view on deep learning techniques applied to semantic
segmentation. arXiv preprint arXiv:1704.06857.
Hecker, S., Dai, D., and Van Gool, L. (2018). End-to-end
learning of driving models with surround-view cam-
eras and route planners. In Proceedings of the eu-
ropean conference on computer vision (eccv), pages
435–453.
VEHITS 2023 - 9th International Conference on Vehicle Technology and Intelligent Transport Systems
408

Hoiem, D., Efros, A. A., and Hebert, M. (2005). Geomet-
ric context from a single image. In Tenth IEEE Inter-
national Conference on Computer Vision (ICCV’05)
Volume 1, volume 1, pages 654–661. IEEE.
Jan, Q. H. and Berns, K. (2021). Safety-configuration of
autonomous bus in pedestrian zone. In VEHITS, pages
698–705.
Jan, Q. H., Kleen, J. M. A., and Berns, K. (2020a). Self-
aware pedestrians modeling for testing autonomous
vehicles in simulation. In VEHITS, pages 577–584.
Jan, Q. H., Kleen, J. M. A., and Berns, K. (2021). Sim-
ulated pedestrian modelling for reliable testing of au-
tonomous vehicle in pedestrian zones. In Smart Cities,
Green Technologies, and Intelligent Transport Sys-
tems: 9th International Conference, SMARTGREENS
2020, and 6th International Conference, VEHITS
2020, Prague, Czech Republic, May 2-4, 2020, Re-
vised Selected Papers 9, pages 290–307. Springer.
Jan, Q. H., Klein, S., and Berns, K. (2020b). Safe and
efficient navigation of an autonomous shuttle in a
pedestrian zone. In Advances in Service and Indus-
trial Robotics: Proceedings of the 28th International
Conference on Robotics in Alpe-Adria-Danube Re-
gion (RAAD 2019) 28, pages 267–274. Springer.
Jan, Q. H., Wolf, P., Berns, K., Reich, J., and Wellstein, M.
(2022). Integration of human skeleton posture models
into reaction for realizing dynamic risk management.
Kaur, P., Taghavi, S., Tian, Z., and Shi, W. (2021). A
survey on simulators for testing self-driving cars. In
2021 Fourth International Conference on Connected
and Autonomous Driving (MetroCAD), pages 62–70.
IEEE.
Keen, H. E., Jan, Q. H., and Berns, K. (2021). Drive
on pedestrian walk. tuk campus dataset. In 2021
IEEE/RSJ International Conference on Intelligent
Robots and Systems (IROS), pages 3822–3828. IEEE.
Krywolt, R. W. (1993). Post-Processed Shadow Determi-
nation for Composition of Depth Images. PhD thesis,
University of British Columbia.
Kuutti, S., Bowden, R., Jin, Y., Barber, P., and Fallah, S.
(2020). A survey of deep learning applications to au-
tonomous vehicle control. IEEE Transactions on In-
telligent Transportation Systems, 22(2):712–733.
Li, Y., Cheng, H., Zeng, Z., Liu, H., and Sester, M. (2021).
Autonomous vehicles drive into shared spaces: ehmi
design concept focusing on vulnerable road users. In
2021 IEEE International Intelligent Transportation
Systems Conference (ITSC), pages 1729–1736. IEEE.
Muller, U., Ben, J., Cosatto, E., Flepp, B., and Cun, Y.
(2005). Off-road obstacle avoidance through end-to-
end learning. Advances in neural information process-
ing systems, 18.
Parekh, D., Poddar, N., Rajpurkar, A., Chahal, M., Ku-
mar, N., Joshi, G. P., and Cho, W. (2022). A review
on autonomous vehicles: Progress, methods and chal-
lenges. Electronics, 11(14):2162.
Pomerleau, D. A. (1988). Alvinn: An autonomous land
vehicle in a neural network. Advances in neural infor-
mation processing systems, 1.
Tampuu, A., Matiisen, T., Semikin, M., Fishman, D., and
Muhammad, N. (2020). A survey of end-to-end driv-
ing: Architectures and training methods. IEEE Trans-
actions on Neural Networks and Learning Systems.
Tian, Y., Yang, G., Wang, Z., Wang, H., Li, E., and Liang,
Z. (2019). Apple detection during different growth
stages in orchards using the improved yolo-v3 model.
Computers and electronics in agriculture, 157:417–
426.
Toromanoff, M., Wirbel, E., Wilhelm, F., Vejarano, C., Per-
rotton, X., and Moutarde, F. (2018). End to end ve-
hicle lateral control using a single fisheye camera. In
2018 IEEE/RSJ International Conference on Intelli-
gent Robots and Systems (IROS), pages 3613–3619.
IEEE.
Xiao, Y., Tsougenis, E., and Tang, C.-K. (2014). Shadow
removal from single rgb-d images. In Proceedings of
the IEEE Conference on Computer Vision and Pattern
Recognition, pages 3011–3018.
Yu, C., Wang, J., Peng, C., Gao, C., Yu, G., and Sang, N.
(2018). Bisenet: Bilateral segmentation network for
real-time semantic segmentation. In Proceedings of
the European conference on computer vision (ECCV),
pages 325–341.
Zhu, M., Derpanis, K. G., Yang, Y., Brahmbhatt, S., Zhang,
M., Phillips, C., Lecce, M., and Daniilidis, K. (2014).
Single image 3d object detection and pose estima-
tion for grasping. In 2014 IEEE International Con-
ference on Robotics and Automation (ICRA), pages
3936–3943. IEEE.
Deep Driving with Additional Guided Inputs for Crossings in Pedestrian Zones
409
