
Dynamic Simulation and Energy, Economic and Environmental
Analysis of a Greenhouse Supplied by Renewable Energy Sources
Francesco Calise
1a
, Francesco Liberato Cappiello
2b
, Luca Cimmino
c
and Maria Vicidomini
4d
DII, University of Naples Federico II, P.le Tecchio, 80, 80125 Naples, Italy
Keywords: Dynamic Simulation, Green Farm, PV Panels, Solar Thermal Collectors.
Abstract: This paper presents the design and dynamic modelling of a greenhouse coupled with renewable energy
technologies, such as PV panels, solar thermal collectors, biomass auxiliary heater. The system is also coupled
with a pyrogasifier, supplied by wood and agricultural wastes in the framework of a biocircular economic
approach. In order to match the real load of power and heat of the investigated user, a “green farm” located
in Naples (South of Italy) reducing the energy consumption and operating cost, all the main components of
the plant were suitably designed. The operation of the designed components was simulated by a dynamic
simulation model developed in TRNSYS environment and validated by means literature results. A
comprehensive energy, economic and environmental analysis of the greenhouse was presented. Main results
suggest that the proposed renewable system is able to reduce the total equivalent CO
2
emissions of 148,66 t/y.
Considering the high current increase of the energy prices due to energy crisis due to the war, the system
shows a very significant profitability with a simple payback of only 1.7 years.
1 INTRODUCTION
Renewable energy sources (RES) (Rahman, 2022)
can be integrated into several energy systems to
provide the energy required for the process and
significantly reduce the primary energy demand of
the systems itself. In particular, solar technologies -
such as solar thermal collectors (Chantasiriwan,
2022), photovoltaic (PV) panels (Xue, 2017) or
photovoltaic/thermal (PVT) collectors (Calise,
Cappiello et al. 2021) - can be easily integrated in
greenhouses (Azam, 2020). Such option seems very
attractive, to avoid or reduce the use of natural gas
boilers and power from the grid. For example, it is
possible to install a PV field to produce electricity
(Okakwu, 2022) as an alternative energy source of
water pumping for irrigation farming, or a solar
thermal collector field to supply the thermal energy
needed to the greenhouse heating system in order to
obtain the greenhouse operating temperature within
the designed temperature range (Xu, 2022). Several
authors investigated this issue. For example, a
a
https://orcid.org/0000-0002-5315-7592
b
https://orcid.org/0000-0001-6292-686X
c
https://orcid.org/ 0000-0001-6382-3619
d
https://orcid.org/0000-0003-2827-5092
nonlinear integrated controlled environment
agriculture model is developed to correlate the impact
of weather disturbances, temperature and humidity
control, fertilization, and irrigation, on the crop
growing conditions. Results of the simulation of a
renewable energy-powered semi-closed greenhouse
growing tomatoes located in Ithaca, New York were
presented. The integrated controlled environment
agriculture model can help in increasing renewable
energy usage efficiency from 4.7% to 127.5%. In the
work of (Singh, 2006) a mathematical model to
simulate a greenhouse was developed and validated
vs experimental data. The equations were written for
four components of the greenhouse, i.e. cover, inside
air, canopy surface and bare soil surface. The model
was applied to the Research Farm of the Punjab
Agricultural University, Ludhiana. The model solved
using Gauss–Seidel Iteration method, confirms a
good agreement with measured data related to the
winter operation for a tomato crop. A dynamic
greenhouse environment simulator was developed in
ref. (Fitz-Rodríguez, Kubota et al. 2010) to predict the
Calise, F., Cappiello, F., Cimmino, L. and Vicidomini, M.
Dynamic Simulation and Energy, Economic and Environmental Analysis of a Greenhouse Supplied by Renewable Energy Sources.
DOI: 10.5220/0012000300003491
In Proceedings of the 12th International Conference on Smart Cities and Green ICT Systems (SMARTGREENS 2023), pages 137-143
ISBN: 978-989-758-651-4; ISSN: 2184-4968
Copyright
c
2023 by SCITEPRESS – Science and Technology Publications, Lda. Under CC license (CC BY-NC-ND 4.0)
137

dynamic behavior of greenhouse environments with
different configurations. The model was implemented
in a web-based interactive application that allowed
for the selection of the greenhouse design, operational
strategies, and weather conditions (four seasons of
four geographical locations). In order to predict the
hourly heating requirements of conventional
greenhouses a time-dependent, quasi-steady state
thermal model based on the lumped estimation of heat
transfer parameters of greenhouses was developed
(Ahamed, 2018). The model considers greenhouse
indoor environmental control parameters, physical
and thermal properties of crops and construction
materials, and hourly weather data including
temperature, relative humidity, wind speed, and cloud
cover. The model also includes the heat loss for plant
evapotranspiration, and the heat gain from
environmental control systems. Thermal analysis
indicates environmental control systems could reduce
13–56% of the total heating requirements over the
year. A comprehensive TRNSYS model for
predicting the transient heating requirement of a
Chinese-style solar greenhouse for Canadian Prairies,
was presented in ref. (Ahamed, 2020). The model in
TRNSYS environment was also validated by a new
heating simulation model. The same model developed
in ref. (Ahamed, 2020) was improved in ref. (Dong,
2021) and validated using the field data collected
from a solar greenhouse in Manitoba, Canada. The
annual simulation indicates that the daily average
heating in the coldest month (January) could be two
times higher (6.3 MJ/m2·day) compared with March
(3.4 MJ/m
2
·day). Comparing this solar greenhouse
with a traditional local one, the heating cost is about
55% lower.
1.1 Aim of the Work
This work aims at increasing the renewable energy
technologies usage in the agricultural sector. In
particular, in this work, the development of a
greenhouse dynamic simulation model in TRNSYS
environment and the related validation by the
literature values is presented. Then, the greenhouse
model is integrated into a comprehensive dynamic
simulation model, including several renewable
technologies based on the use of biomass and solar
source in order to evaluate the energy, economic and
environmental performance. With respect to the
literature review the work aims at showing how
hybrid renewable energy plants can be an optimal
solution in the framework of the green farm and
biocircular economy approach. In addition, the whole
system is dynamically simulated considering both the
dynamic demand of the greenhouse and user and the
dynamic power and heat production
2 METHOD
In this section the method adopted to develop this
work will be described. Here the greenhouse model
and its validation vs literature data will be reported.
Then, this model will be integrated into a
comprehensive simulation model including the
investigated renewable technologies according to the
investigated layout (Figure 1). The section also
includes some details of the modelling of the main
components, such as the solar thermal collector and
PV panel fields and the main economic and energy
indexes evaluated to perform the technoeconomic
analysis.
2.1 Layout
The layout investigated in this paper is represented in
Figure 1.
Figure 1: Layout.
It includes:
solar PV panels producing electricity to supply
the user and irrigation pumps.
solar thermal collectors to supply the thermal
energy demand of the greenhouse, corn drying
and the domestic hot water and heating energy
demand of the user.
a biomass auxiliary boiler in case of scarce
irradiation, during the night hours or switching
off of pyrogasifier, to match the global thermal
energy demand.
a water tank to store the produced thermal
energy by the solar field.
a pyrogasifier supplied by wood and
agricultural wastes to produce both thermal and
electric energy.
SMARTGREENS 2023 - 12th International Conference on Smart Cities and Green ICT Systems
138

The plant is connected to the grid in order to match
the electricity of the user if the production of the
included technologies is not enough.
2.2 Model
The simulation model of this system is developed
using the well-known dynamic simulation tool
TRNSYS. The tool includes a large library of
components, which are able to accurately simulate the
energy performance of the components included in
the investigated system. The types included in
TRNSYS environment are considered reliable and
validated (Klein SA, 2006). For sake of brevity, the
components used to model the whole plant are
summarized in Table 1.
Table 1: TRNSYS Types.
T
yp
e 1b Solar thermal collectors
T
yp
e 94 PhotoVoltaic
p
anels
Type 109 Weather conditions
Type 48 Inverter regulato
r
Type 4c Thermal storage tan
k
T
yp
e 114 Circulation
p
um
p
T
yp
e 6 Biomass auxiliar
y
boile
r
T
yp
e 641 Humidification s
y
stem
Type 77 Ground modelling
TRNSYS software is very reliable and accurate
for the evaluation of building energy demand (Calise,
2020) and it is considered by the scientific
community as a benchmark tool to validate the in-
house building simulation models (Buonomano and
Palombo, 2014, Calise, 2016, Buonomano, 2019).
However, its application can be suitable also for the
simulation of greenhouses as reported in ref.
(Ahamed, 2020). The next subsection includes the
description of greenhouse model and validation.
2.2.1 Greenhouse Model
Type 56 was selected to model the greenhouse. This
component calculates the dynamic energy demand,
by considering its 3D geometry (defined in the
Google SketchUp TRNSYS3d plug-in (Murray,
Finlayson et al. 2009)), the effects of the
environmental conditions (i.e. ambient temperature
and humidity, solar radiation, etc.) on the greenhouse
and the envelope thermophysical proprieties, as well
as the ventilation and infiltration rate. gain. The
greenhouse geometry analyzed in this work is
represented in Figure 2. The validation of the whole
Type 56 is presented in reference (Voit, 1994). It is
also worth noting that Type 56 considers a detailed
model for the calculation of radiation in the
greenhouse, considering a complex model for the
calculation of view factors and considering the
radiative properties of the surfaces as a function of the
wavelength.
Figure 2: Geometric model of the investigated greenhouse.
As a consequence, the model returns the surface
temperatures and the radiate flows emitted by the
surfaces and transmitted by the glazing surfaces.
The validation of the model of greenhouse was
carried out considering the greenhouse model
developed in TRNSYS according to the ref.
(Ahamed, 2020), where all the assumptions to
redevelop the model were reported.
Figure 3: Model Validation.
In Figure 3, the monthly average daily heating
requirement obtained both by ref. (Ahamed, 2020)
and our model were summarised.
2.2.2 Energy, Economic and Environmental
Model
A detailed thermo-economic model was also
developed in order to assess the energy and economic
profitability of the system under investigation. The
primary energy saving (PES) was evaluated
considering a reference system (RS) supplied by the
national grid for the electric energy demand and a
conventional gas boiler for the thermal energy
demand, featured by an efficiency of 46% and 90%
(η
el,GRID
, η
NGboiler
), respectively.
0
200
400
600
800
jan feb mar apr may jun jul aug sep oct nov dec
Monthly average daily heating requirements
[kWh/day]
TRNSYS MODEL
TRNSYS MODEL LIT
Dynamic Simulation and Energy, Economic and Environmental Analysis of a Greenhouse Supplied by Renewable Energy Sources
139

,,,
,
,,
e l f r o mGRI D e l f r o mGRI D e l t o GRI D
th NGboiler
RS PS
RS NGboiler elGrid elGrid
R
SPS
EEE
E
PE PE
PES
PE
ηη η
−
−
==+ −
(1)
The yearly operating cost saving ΔC of the proposed
system (PS) with respect to the RS considers the
purchasing of the electricity from the grid at unit cost
c
el,fromGrid
and of natural gas at unit cost c
NG
, for RS
and the purchasing/selling of the electricity from/to
the grid for PS. c
el,toGrid
is the selling unit cost in PS.
In PS, the biomass for the wood-chip auxiliary boiler
is purchased at unit cost c
bio.boiler
; the biomass for the
pyrogasifier supplied by wood and agricultural
wastes is purchased at unit cost c
bio,pyr.
The
maintenance Mn of all the components were
considered.
()( )
()
,, ,,,,
,, ,,
el fromGRID el fr omGri d NG NG bi o pyr bi o pyr bio boil er bi o boil er
R
SPS
e l f r omGR I D e l f r omGr i d e l t oGRI D e l t oGr i d
PS
Ec Vc MnMcMc
Ec Ec
C=+−+++
−−
Δ
(2)
The equivalent CO
2
emissions difference are
evaluated as follows:
()
,
,,2,
th NGboiler
el fromGRID el NG el fromGRID el toGRID el
P
S
NGboiler
RS
CO
E
EF F E EF
η
Δ
=+ −−
(3)
All the capital costs of the included technologies as
well as the main parameters for the thermoeconomic
analysis were reported in the case study section.
2.3 Case Study
The model of the greenhouse was applied to a suitable
case study located in Castelvolturno (Naples, South
of Italy). The main features of the greenhouse were
reported in Table 2. In Table 3, the design data of
proposed plant were also summarised. The plant is
designed to produce the electricity for the buildings
close to the greenhouse and the related irrigation
pumps, and to produce the thermal energy both for the
greenhouse heating and the domestic hot water and
space heating energy demand of the user. The
thermoeconomic and environmental assumptions for
Table 2: Greenhouse features.
Area 450 m
2
(
9 m x 50m
)
Max hei
g
ht 5
m
Slope of the roof 30 °
Air change infiltration 0.5 1/h
Ventilation 0.1 m/s
Artificial Li
g
htnin
g
30 W/m
2
Day/nigh humidification
rate for eva
p
otrans
p
iration
21.5/3.6 g/h
Heatin
g
tem
p
erature 20 °C
Materials
Plastic cover, steel
structure, chalk/cla
y
floo
r
the analysis of the PS with respect to RS were
summarised in Table 4. Figure 4 reports the thermal
energy demand of the greenhouse; Figure 5 reports
the power and heat load of the user.
Table 3: Design data of proposed plant.
Rated
p
ower PV field A 15 kW
Rated power PV field B 5 kW
Slope PV fiel
d
A0°
Slope solar thermal fiel
d
/
PV fiel
d
B 30°
Area solar thermal fiel
d
28 m
2
Rated
p
ower
p
y
ro
g
asifie
r
20 kW
Rate
d
thermal flow rate pyrogasifie
r
40 kW
Equivalent oper. hours pyrogasifie
r
7500 h
/
y
Efficiency curve coeff. solar collecto
r
a
0
0.785
a
1
1,03 W/m
2
K
a
2
0.0033 W/m
2
K
2
Table 4: Thermoeconomic and environmental parameters.
Data Value
P
y
ro
g
asifier cost 150
k
€
Biomass auxiliar
y
boiler cost 10
k
€
Ordinar
y
Maint. P
y
ro
g
asifier 3%/
y
Extraordinar
y
Maint. Pyrogasifie
r
5
k
€/2
y
Maint.
b
iomass auxiliary boile
r
2,50%
Unit cost of
p
urchased
b
iomass 0,12 €/k
g
Unit cost of self-
p
roduce
d
b
iomass 0,07 €/k
g
Lower heatin
g
value of woo
d
-chi
p
4 €/k
g
Unit cost of PV field 1800 €/kW
Maint. PV fiel
d
2%
Unit cost solar thermal fiel
d
400 €/
m
Maint. solar thermal fiel
d
2,5%
Lifetime
p
ro
p
osed s
y
ste
m
20
y
Discount rate 5%
CO
2
emission factor for electricity 0.48 kgCO
2
/kWh
CO
2
emission factor for primary
ener
gy
0.20 kgCO
2
/kWh
Figure 4: Thermal energy demand of the greenhouse.
It is clearly shown how the thermal energy
demand is very high during the winter months due to
0
50
100
150
200
250
Thermal flow rate (W/m
2
)
Time (h)
SMARTGREENS 2023 - 12th International Conference on Smart Cities and Green ICT Systems
140
the cold temperatures. Over 50% of all yearly heating
demand is concentrated in the coldest winter months.
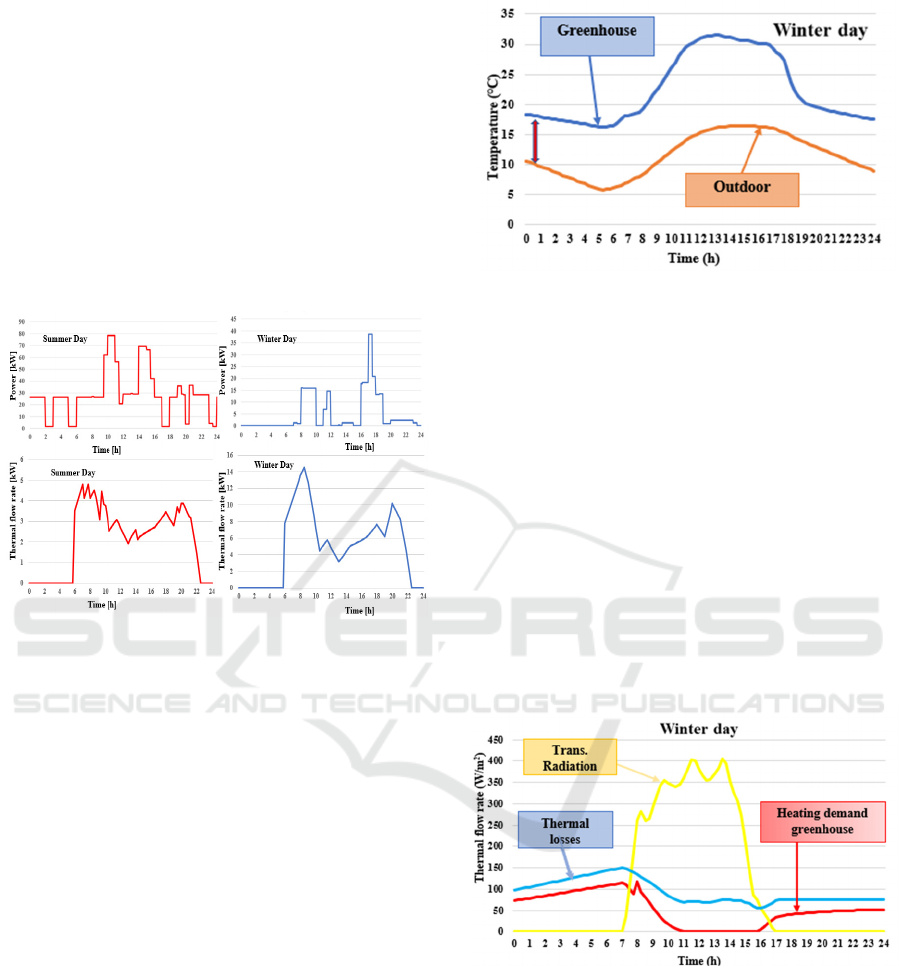
The power load is mainly due to the irrigation
pumps (with a rated power of 55 kW). Note the high
peak value during the summer day, considering that
the irrigation time range is wider in the summer days.
In addition, the electric consumption due to
technologies and offices is negligible with respect to
the irrigation. The thermal flow rate during the winter
day reaches the peak value of 14 kW at 8 am, higher
than summer one, considering that the winter thermal
flow rate is due to the space heating and DHW
purposes and corn drying.
Figure 5: Heat (space heating and DHW) and power
demand of user (irrigation and offices demand).
3 RESULTS
In this section the results of the dynamic simulations
performed for one year of operation will be presented
according to different time basis: hourly, and yearly
basis. In particular, the results of the energy,
economic and environmental analysis will be also
reported when PS is compared with RS. In addition,
the economic analysis will be presented considering
the purchasing costs before and after the energy crisis.
Figure 6 shows the trends of temperature of
greenhouse and outdoor air without the heating
system. Note that the heating of greenhouse quickly
occurs during the central hours of the day and that the
greenhouse temperature follows the same trend of the
ambient temperature.
The heating of the greenhouse occurs because the
rays of the sun enter through the glass of the
greenhouse featured by particularly high absorption
coefficients. However, the infrared radiation emitted
by the ground cannot be transmitted through some
materials, such as glass, guaranteeing a higher
temperature than the outdoor air temperature.
Figure 6: Temperature difference between greenhouse and
outdoor air.
A heated greenhouse allows an increase in the
yield of the crop, so that some crops can be cultivated
even in the winter months. Conversely, in case of
greenhouse with heating system, the trend of the
thermal flow rates represented in Figure 7 can be
observed.
The heating demand of greenhouse by the heating
system occurs only if the greenhouse temperature is
lower than 20°C, mainly when the radiation is absent
or for cold ambient temperature. During these hours,
the thermal losses by the construction materials are
high. Due to the transmitted solar radiation, the
thermal energy demand is null from 11 am to 16 pm
because the greenhouse temperature is higher than
20°C, although this is a winter day.
Figure 7: Transmitted solar radiation, thermal losses, and
heating demand of greenhouse.
Figure 8 reports the powers of the electric loop.
The power production of pyrogasifier is not
dependent on the weather conditions and it is constant
and very significant. Both the systems, pyrogasifier
and PV panels, are able to reduce the integrations of
electricity from the grid, although the higher power
demand of summer season due to the irrigation pumps
than the winter season one. Note that during the
central hours of the day, the pyrogasifier is switched
Dynamic Simulation and Energy, Economic and Environmental Analysis of a Greenhouse Supplied by Renewable Energy Sources
141

off to carry out the ordinary maintenance of the unit
and the electricity is only provided by the PV panels.
Note that the electricity is delivered to the grid mainly
during the night and late afternoon hours. This mainly
occurs because the irrigation pumps operate during
the central hours, doubling the power consumption.
Figure 8: Total power production of PV panels and
pyrogasifier, total power demand, power from/to grid
(space heating and DHW).
The yearly results of energy analysis were
summarised in Table 5 and 6. The electricity
integration from the grid is about 35% of the total
electric energy demand, whereas the thermal self-
consumption is 63% of the total thermal energy
demand. The electric self-consumption is 65% of the
total electric energy demand. The electric production
of the solar field covers only 17% of the total electric
energy production, result that confirm the small size
of PV field with respect to the pyrogasifier.
Table 5: Yearly energy results.
Energy Analysis
Energy [MWh/y] Value Energy [MWh/y] Value
User thermal
demand
44 Electric integration 108
Greenhouse
thermal demand
246
Thermal self-
consumption
182
Total heat demand 290 Thermal excess 136
Total electric
demand
122
Thermal production
solar field
22,7
Elec.production
(PV+pyrog)
179
Thermal production
pyrogasifier
296
Electric integration 42,3
Thermal product.
(solar field+pyrog)
318
Electric excess 99,7
Electric production
pyrogasifier
149
Electric self-
consumption
79,7
Electric production
PV field
30,6
The proposed system is able to obtain a reduction
of 149 t/y (Table 6). The primary energy saving of
121% is due to the high amount of the electric energy
delivered to the grid, equal to 55% of the total
electricity production. During the winter months, due
to the lower electric energy demand when the
irrigation pumps operate for only few hours per day,
the electric-self consumption with respect to the
demand reaches high value, also 90%. Therefore, the
excess of electricity reduces during the summer
months, although the higher PV production.
Table 6: Yearly energy and environmental results.
Primary energy RS 587,04 MWh/y
Primary energy PS -124,67 MWh/y
PES (Primary Energy Saving)
121
%
CO
2
emissions RS 122,93 t/y
CO
2
emissions PS -25,73
Avoided CO
2
emissions
121
%
Considering the increase of the purchasing costs
before and after the energy crisis, 0.70 vs 1.58 €/Sm
3
for natural gas, and 0.19 vs 0.66 €/kWh, the economic
indexes, reported in Table 7, clearly improve, with a
simple payback period, decreasing from 6.7 to 1.7
years.
Table 7: Economic results.
Adopted purchasing costs Post crisis Pre crisis
ΔC 122 k€/y 31 k€/y
SPB 1,7 y 6,7 y
DPB 1,8 y 8,4 y
NPV 1317 k€ 177 k€
PI 6,4 0,86
4 CONCLUSIONS
In this work the modelling and the energy, economic
and environmental analysis of a renewable plant
based on PV panels, solar thermal collectors and a
pyrogasifier was presented. The plant is designed to
satisfy the main energy demands of a farm, including
a greenhouse. The modelling was developed in
TRNSYS environent and the types of the software
were adopted, except for the greenhouse. For the
greenhouse a suitable model, validated by a literature
research work, was presented, allowing to evalute the
thermal energy demand for heating of greenhouse.
Subsequently, the validated model was
adapted for a
case study related to the Castelvolturno greenhouse
SMARTGREENS 2023 - 12th International Conference on Smart Cities and Green ICT Systems
142

(Naples, South of Italy) with a total heating demand
of 246 MWh/year. Considering the total thermal and
electrical energy demand of the farm, equal to 289
MWh/year and 122 MWh/year, coupling the mix of
renewable plants, the following results can be
summarized. The electric production covers more
than 65% of electric consumption (79 MWh/year).
The integration of thermal energy provided by the
biomass boiler is 108 MWh/year. The economic
analysis was performed considering the purchasing
energy costs before and after the energy crisis.
Significant differences were detected, with simple
payback values decreasing from 6.7 to 1.7 years.
Finally, the energy and environmental analysis
showed how much the implementation of green
systems connected to a circular economy can
positively affect the reduction of emissions (-148.66
tons of CO2/year) and the exploitation of fossil fuels
(-711 .7 MWh/year of primary energy).
REFERENCES
Ashraf, R. J., J. D. Nixon and J. Brusey (2022). "Using
multi-objective optimisation with ADM1 and measured
data to improve the performance of an existing
anaerobic digestion system." Chemosphere 301: 134523.
Ahamed, M. S., H. Guo and K. Tanino (2018). "A quasi
steady state model for predicting the heating
requirements of conventional greenhouses in cold
regions." Information Processing in Agriculture 5(1): 33-
46.
Ahamed, M. S., H. Guo and K. Tanino (2020). "Modeling
heating demands in a Chinese-style solar greenhouse
using the transient building energy simulation model
TRNSYS." Journal of Building Engineering 29:
101114.
Azam, M. M., M. A. Eltawil and B. M. A. Amer (2020).
"Thermal analysis of PV system and solar collector
integrated with greenhouse dryer for drying tomatoes."
Energy 212: 118764.
Buonomano, A., F. Calise, A. Palombo and M. Vicidomini
(2019). "Transient analysis, exergy and thermo-
economic modelling of façade integrated
photovoltaic/thermal solar collectors." Renewable
Energy 137: 109-126.
Buonomano, A. and A. Palombo (2014). "Building energy
performance analysis by an in-house developed
dynamic simulation code: An investigation for different
case studies." Applied Energy 113: 788-807.
Burke, M. J. and J. C. Stephens (2017). "Energy
democracy: Goals and policy instruments for
sociotechnical transitions." Energy Research & Social
Science 33: 35-48.
Calise, F., F. L. Cappiello, M. Dentice d’Accadia and M.
Vicidomini (2020). "Dynamic simulation, energy and
economic comparison between BIPV and BIPVT
collectors coupled with micro-wind turbines." Energy
191: 116439.
Calise, F., F. L. Cappiello, M. Dentice d’Accadia and M.
Vicidomini (2021)"Concentrating photovoltaic/thermal
collectors coupled with an anaerobic digestion process:
Dynamic simulation and energy and economic
analysis." Journal of Cleaner Production 311: 127363.
Calise, F., M. Dentice d'Accadia, L. Libertini, E. Quiriti and
M. Vicidomini (2016). "Dynamic simulation and
optimum operation strategy of a trigeneration system
serving a hospital." American Journal of Engineering
and Applied Sciences 9(4): 854-867.
Chantasiriwan, S. (2022). "Solar-aided power generation in
biomass power plant using direct steam generating
parabolic trough collectors." Energy Reports 8: 641-648.
Dong, S., M. S. Ahamed, C. Ma and H. Guo (2021) "A Time-
Dependent Model for Predicting Thermal Environment
of Mono-Slope Solar Greenhouses in Cold Regions."
Energies 14 DOI: 10.3390/en14185956.
Fitz-Rodríguez, E., C. Kubota, G. A. Giacomelli, M. E.
Tignor, S. B. Wilson and M. McMahon (2010).
"Dynamic modeling and simulation of greenhouse
environments under several scenarios: A web-based
application." Computers and Electronics in Agriculture
70(1): 105-116.
Klein SA, B. W., Mitchell JW, Duffie JA, Duffie NA,
Freeman TL, et al. (2006). "Solar Energy Laboratory,
TRNSYS. A transient system simulation program.
University of Wisconsin, Madison."
Murray, M. C., N. Finlayson, M. Kummert and J. Macbeth
(2009). Live Energy Trnsys -Trnsys Simulation within
Google Sketchup. Eleventh International IBPSA
Conference, Glasgow, Scotland July 27-30.
Okakwu, I. K., A. S. Alayande, D. O. Akinyele, O. E.
Olabode and J. O. Akinyemi (2022). "Effects of total
system head and solar radiation on the techno-
economics of PV groundwater pumping irrigation
system for sustainable agricultural production."
Scientific African 16: e01118.
Rahman, A., O. Farrok and M. M. Haque (2022).
"Environmental impact of renewable energy source
based electrical power plants: Solar, wind,
hydroelectric, biomass, geothermal, tidal, ocean, and
osmotic." Renewable and Sustainable Energy Reviews
161: 112279.
Singh, G., P. P. Singh, P. P. S. Lubana and K. G. Singh
(2006). "Formulation and validation of a mathematical
model of the microclimate of a greenhouse."
Renewable Energy 31(10): 1541-1560.
Voit, P., T. Lechner and M. T. Schuler (1994). Common EC
validation procedure for dynamic building simulation
programs - application with TRNSYS. Conference of
international simulation societies, Zürich.
Xu, Z., J. Lu and S. Xing (2022). "Thermal performance of
greenhouse heating with loop heat pipe solar collector
and ground source heat pump." Results in Engineering
15: 100626.
Xue, J. (2017). "Photovoltaic agriculture - New opportunity
for photovoltaic applications in China." Renewable and
Sustainable Energy Reviews 73: 1-9.
Dynamic Simulation and Energy, Economic and Environmental Analysis of a Greenhouse Supplied by Renewable Energy Sources
143
