
Managing Trade-off Between Cost and Time in Project Scheduling
Problems Using Discrete Event Simulation
Sena Senses
a
and Mustafa Kumral
b
Mining and Materials Engineering Department, McGill University, 3450 Rue University, Montréal, QC H3A 2A7, Canada
Keywords: Project Management, Time-Cost Trade-off, Electrical Substation Construction, Discrete-Event Simulation.
Abstract: Project Management is a key activity in engineering and business entities to achieve specific objectives (e.g.,
construction, expansion, supply chain, and replacement). Effective project management includes a detailed
investigation of the project's costs and benefits and examining the short- and long-term effects of project
design and implementation. In the mining industry, due to the operations' inherent complexity and uncertainty
associated with geological and financial inaccuracies, there is a substantial risk that the project may run over
budget and schedule. It is vital to consider the project's uncertainties to meet the project's goals. This paper
proposes a combined simulation and optimization model for time-cost trade-off project scheduling problems
under uncertainty. A numerical example is conducted to demonstrate the effectiveness of the developed model
through an electrical substation construction project conducted in a mine. By introducing numerous crashing
scenarios to quantify the impact of uncertainty on the entire project and to assess the risks, the trade-off
between time and cost is achieved under the project budget and deadline constraints. The proposed research
has a significant potential to improve the management of construction projects considering a detailed project
management methodology.
1 INTRODUCTION
Project implementation has three dimensions: (1)
completing the project in a possible earliest time, (2)
minimizing the cost through minimizing resource
usage, and (3) providing a high-quality, safe, and
environmentally friendly project outcomes. This
indicates when scheduling a project, there are
inevitable trade-offs that must be dealt with. This
paper seeks a balance between cost and completion
time. It should be noted that environmental and safety
issues cannot be balanced because they are the
uppermost priorities for a project. The first dimension
involves the decisions and questions regarding the
project completion time, project bottlenecks, and
what can be done to prevent the project from being
delayed. The second dimension addresses the
resources that need to be used such that the project is
accomplished within the budgeted cost, while at the
same time not delaying the project completion time.
The third dimension refers to scope which is difficult
to quantify. The project must provide all the
a
https://orcid.org/0000-0001-9145-585X
b
https://orcid.org/0000-0003-1370-7446
requirements included in the project scope such
as quality, safety, environmental concerns,
sustainability, or any other performance
measurements (Hickson and Owen, 2015). Large-
scale engineering projects such as mine development
call for the efficient coordination of numerous
operations carried out by several organisational units.
These projects should be handled carefully to avoid
interrupting the turnover of project length while
avoiding capital overruns because they are inherently
complicated and uncertain due to the influence of
internal and external factors. Since the value of
mining projects is sensitive to time and cost, the time
and cost management of a construction project is of
vital importance. Project planning problems
investigating the trade-off between cost and time of
the project is called time-cost trade-off (TCT)
problems in the literature.
178
Senses, S. and Kumral, M.
Managing Trade-off Between Cost and Time in Project Scheduling Problems Using Discrete Event Simulation.
DOI: 10.5220/0012004900003546
In Proceedings of the 13th International Conference on Simulation and Modeling Methodologies, Technologies and Applications (SIMULTECH 2023), pages 178-185
ISBN: 978-989-758-668-2; ISSN: 2184-2841
Copyright
c
2023 by SCITEPRESS – Science and Technology Publications, Lda. Under CC license (CC BY-NC-ND 4.0)

2 LITERATURE REVIEW
In this regard, Xu et al. (2018) developed an
integrated dynamic approach for analyzing the
project schedule risk by combining discrete event
simulation (DES) with system dynamics. The
developed model is applied to a bridge construction
project to reveal the effect of risk factors on the
schedule. Romanskaya and Berdnikov (2020)
proposed an integrated methodology for schedule risk
management, combining the The Project Evaluation
and Review Technique (PERT) with the decision tree
method. Acebes et al. (2021) proposed a new metric
to measure the impact of each activity on the total
project risk while it is underway. The probability
factor is evaluated by Monte Carlo simulation, while
the impact factor is built on the schedule risk baseline
concept. Song, Martens, and Vanhoucke (2022)
aimed to measure and evaluate if the project progress
is acceptable for resource-constrained projects
considering project delays and resource restrictions
by applying schedule risk analysis. Chen, Lu, and
Han (2022) investigated the interdependency
between the sequence of risk occurrence for
construction schedule under uncertainty by the
Bayesian-driven Monte Carlo approach. Mostafaei et
al. (2022) examined a granite mine project to carry
out a financial analysis for the exploitation duration.
Defining the sale price and annual production is
uncertain, two net present value (NPV) models were
generated utilizing Monte Carlo simulation and
Support Vector Machine (SVM).
In addition, the time-cost trade-off problems have
been studied by various simulation techniques in the
field of project management. Simulation is a powerful
tool for modelling complex problems and its ability
to accurately reflect the structure of the real world
(Hillier and Lieberman, 2010). To optimise the time-
cost trade-off scheduling problem considering the
stochastic character of the project network, Feng, Liu,
and Burns (2000) suggested a hybrid technique
including genetic algorithms with simulation
methods. A DES methodology was developed by Li
and Lei (2010) to analyse the time-cost trade-off in
uncertain construction scheduling problems. To
calculate the critical path and the project duration
under uncertainty, Jolai et al. (2013) researched a
project network problem. A numerical example was
used to compare a DES model to the conventional
deterministic approaches. In a DES environment
coupled with a system dynamics model, Alzraiee,
Zayed, and Moselhi (2015) studied a hybrid project
planning and scheduling method on a Critical Path
Method (CPM) -based network. Regarding the
uncertainties of the project costs and durations, the
proposed hybrid modelling method sought to obtain
realistic project networks and discover the
interconnections of the project's components. Botín,
Campbell, and Guzmán (2015) explored a very
complex mine development system by integrating a
stochastic DES with a Monte Carlo simulation and
PERT to minimize the pre-production development
period. For planning a hydroelectric project, Mubin,
Jahan, and Gavrishyk (2019) investigated a time-cost
trade-off problem using Monte Carlo simulation to
analyze the project completion risk. Using discrete-
event simulation, Moreno et al. (2020) proposed the
fixed start technique for construction projects. By
regulating the start time of the activities, the approach
aimed to meet the project deadline while reducing the
variability in project delay. By combining DES with
a genetic algorithm, Nili, Taghaddos, and Zahraie
(2021) introduced a new simulation-based
optimization approach for obtaining the best
sequence of tasks in maintenance projects such that
the costs are minimized.
Even though there have been several studies on
project management, multi-scenario simulation
modelling of a project planning problem considering
project crashing has not been thoroughly investigated
in the literature. In this paper, a simulation-based
approach is proposed to optimize time-cost trade-off
project planning problem under uncertainty. By using
random activity durations, the stochastic nature of the
model representing the uncertainties in project
execution is addressed. A multi-scenario framework
is developed by creating various activity crashing
scenarios in which the durations of the activities are
shortened by allocating additional resources causing
additional cost. A case study on a mine development
project is conducted to validate the proposed model.
Hence, this paper offers a thorough analysis of the
impacts of uncertainty and multiple project crashing
scenarios on project cost and completion time.
The novel contribution of this study is the
introduction of a simulation-based optimization
algorithm to address the project scheduling problem
under uncertainty, considering project deadline and
budget constraints. The algorithm also allows for the
identification of critical project activities, statistical
analysis of activity criticalities and project
completion time, as well as the development of
multiple project crashing scenarios to minimize total
cost and completion time.
The proposed methodology and algorithm are
presented in Section 2, followed by a numerical
example and computational results in Section 3.
Managing Trade-off Between Cost and Time in Project Scheduling Problems Using Discrete Event Simulation
179
Finally, the study concludes with closing remarks and
suggestions for future research in Section 4.
3 METHODOLOGY
3.1 Network Models
The network analysis in project planning, scheduling,
and controlling has become a common application in
the past decades. The CPM and the PERT, both
proposed in the late 1950s, are the two most popular
network-based project management techniques
(Kelley and Walker 1959; Winston 2004). They are
effective methods for identifying the critical tasks and
the shortest completion time and assessing the impact
of changes on project cost and duration (Agyei 2015;
Lujić, Barković, and Jukić 2019). These methods also
introduced the concept of "project crashing", which
involves allocating more labour, equipment, and
material to one or more project tasks to reduce total
project duration. Project crashing must be applied
based on a trade-off analysis between project duration
and cost because increasing the number of resources
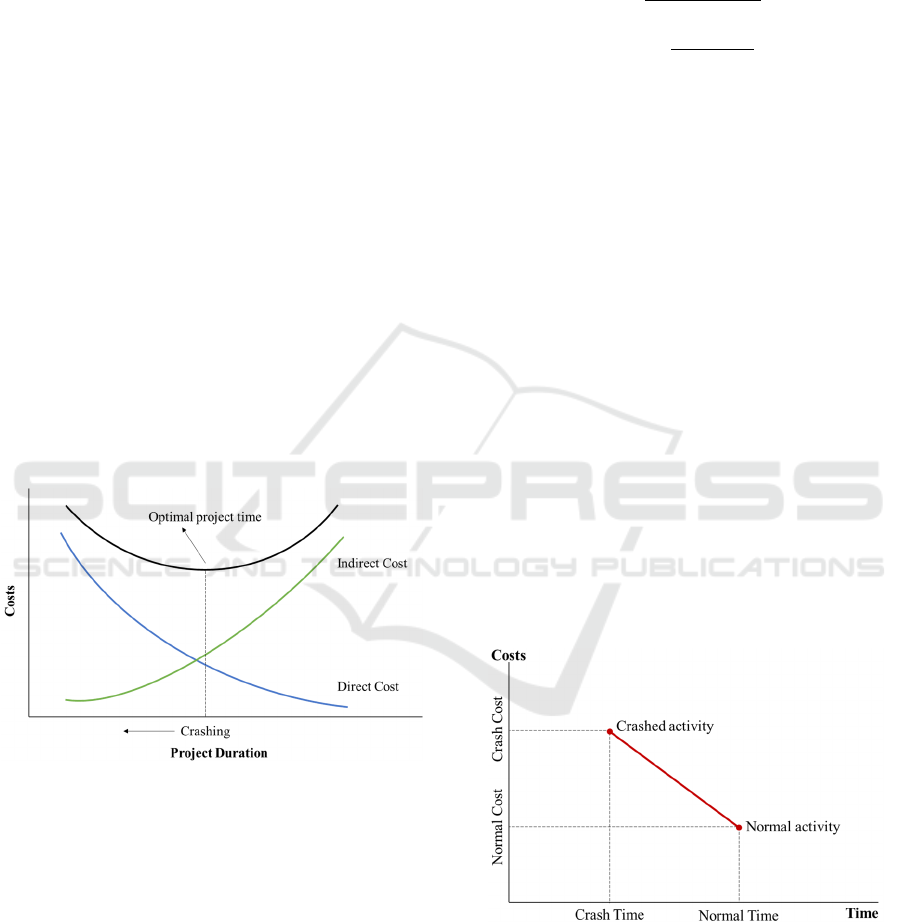
leads to additional project cost. The trade-off between
time and cost can be seen in Figure 1.
Figure 1: Time-Cost Trade-off.
The project network can then be constructed
based on Activity-On-Arc (AOA) graph or Activity-
On-Node (AON) graph. CPM is a deterministic
method to schedule well-defined activities assuming
that all activities can be scheduled with certainty. On
the other hand, PERT is a probabilistic method where
the uncertainties in each activity duration are
considered and the probability of completing the
project within a given deadline can be estimated. For
the estimation of duration values of each activity 𝑖,
three-point estimates, which are the optimistic
estimation 𝑎
, the most likely estimation 𝑚
, and the
pessimistic estimation 𝑏
are utilized. Considering 𝑇
is the duration of activity 𝑖 , PERT requires the
assumption that 𝑇
follows a beta distribution. Thus,
the mean and variance of 𝑇
may be approximated by
Eq. (1-2).
𝐸(𝑇
)=
𝑎
+4𝑚
+𝑏
6
(1)
𝑣𝑎𝑟(𝑇
)=
(𝑏
−𝑎
)
36
(2)
PERT requires the assumption that the durations
of all activities are independent. Then for any path in
the project network, the mean and variance of the
time required to complete the activities on the path
are given by Eq. (3-4).
𝐸(𝑇
)
∈
(3)
𝑣𝑎𝑟(𝑇
)
∈
(4)
One of the most difficult problems in project
planning is finding a trade-off between time and cost
that will allow the project to be completed within the
specified deadline while minimizing costs. The
project length can be shortened by crashing the
critical activity durations to meet the deadline of the
project. Crashing is achieved so that the critical
activity durations are shortened by assigning
additional resources to them. Thus, the objective is to
shorten the project duration while minimizing the
crashing cost. The relationship between normal time
and cost, and crash time and cost are represented in
Figure 2.
Figure 2: The Relationship between Normal Time and Cost,
and Crash Time and Cost.
The normal point on the graph corresponds to the
time and cost of the activity when it is executed in the
normal way. On the other hand, the crash point
represents the time and cost when the activity is fully
crashed. The crash cost per period for each activity in
SIMULTECH 2023 - 13th International Conference on Simulation and Modeling Methodologies, Technologies and Applications
180

the network can be calculated using Eq. (5), assuming
that the crash costs are linear over periods.
𝐶𝑟𝑎𝑠ℎ 𝑐𝑜𝑠𝑡 − 𝑁𝑜𝑟𝑚𝑎𝑙 𝑐𝑜𝑠𝑡
𝑁𝑜𝑟𝑚𝑎𝑙 𝑡𝑖𝑚𝑒 − 𝐶𝑟𝑎𝑠ℎ 𝑡𝑖𝑚𝑒
(5)
3.2 Discrete-Event Simulation Model
Discrete Event Simulation (DES) is a dynamic
simulation technique that can be used to model a
project management system that has a discrete
sequence of activities over the project duration. It is a
powerful technique in terms of the modelling of
uncertain and complex project management
problems. In this study, a dynamic, stochastic, and
discrete-event simulation model is developed based
on PERT.
In this study, a stochastic simulation-based
approach is proposed to examine the trade-off
between time and cost of a project planning problem
under the project deadline and budget constraints.
Randomized activity durations are used to address the
stochastic structure of the model, and a multi-scenario
framework is developed by creating various activity
crashing scenarios. Thus, determining the impact of
uncertainty and project crashing scenarios on project
completion time and cost is detailed in the current
study. The DES model is used to identify bottlenecks
in the project network and estimate the risks related
to the project's uncertain characteristics. The
objective of simulation-based optimization is to find
the best solution among multiple project crashing
scenarios such that the total cost of the project and its
completion time is minimized.
The project is divided into tasks in accordance
with the work breakdown structure (WBS). The
project network is established as an Activity-On-
Node (AON) graph 𝐺(𝑁,𝐴), where N denotes the
node sets identifying project activities and A denotes
the arc sets indicating the precedence relationships
between those activities. There are 𝑛 different project
activities in the established network model. The
predecessor and successor activity sets are designated
as 𝐽
and 𝐾
, respectively, for each activity 𝑖. Using
the crashed activity times 𝑋
and stochastic activity
durations 𝐷
for each activity 𝑖 , the precedence
relationships between activities are developed by
calculating the earliest start 𝐸𝑆
and earliest finish
𝐸𝐹
times in the forward pass, and the latest start 𝐿𝑆
and latest finish 𝐿𝐹
times in the backward pass,
through the network. The project completion time and
the critical path are determined based on the
parameters calculated in forward and backward
passes. The normal cost 𝑁𝐶, delay cost 𝐷𝐶, and
crashing cost 𝐶𝐶 are obtained at the end of the
simulation run. The normal cost is calculated as the
summation of each activity execution cost, 𝑁𝐶𝑃
. By
multiplying the delayed number of periods by the
delay penalty 𝑃, the delay cost, which only occurs if
the project completion time 𝑇
exceeds the target
project time 𝑇
, is determined. In addition, the
crashing cost is obtained by multiplying the duration
of the crashed activity 𝑋
by the activity's associated
crash cost per period, 𝐶𝐶𝑃
. As a result, the function
consisting of these three cost items is given as the
project's total cost function 𝑇𝐶 in the proposed
simulation model. The model also incorporates an
optimization tool where the objective function and
constraints of the network are introduced. The
equations specified in the optimization tool to
minimize the function of the total project cost are
displayed below.
𝑀𝑖𝑛𝑖𝑚𝑖𝑧𝑒
𝑓
(
𝑥
)
+
𝑓
(
𝑥
)
+
𝑓
(𝑥)
(6
)
𝑓
(𝑥) = (𝑁𝐶𝑃
)
(7
)
𝑓
(𝑥) = 𝑇
−𝑇
∙𝑃
(8
)
𝑓
(𝑥) = (𝑋
∙ 𝐶𝐶𝑃
)
(9
)
𝑇𝐶 ≤ 𝐵
(10
)
𝑇
≤𝑇
(11
)
The overall project cost, including normal, delay,
and crashing cost, is minimised by Equation (6),
respectively. Equations (10) and (11) make sure that
the project budget 𝐵
and project deadline 𝑇
cannot be exceeded by the total project cost 𝑇𝐶 and
project completion time 𝑇
, respectively. In addition,
the system's control and response variables are
chosen for the simulation-based optimization
approach. The decision variables of the system are
referred to as control variables, whereas the output of
a simulation run includes the response variables.
The crashing times of the activities, which are
measured as the difference between the normal
execution time and the shortest completion time of
the activity, are defined as the decision variables of
the system. As a result, multiple scenarios are built
using numerous crashing time combinations for the
activities. Hence, a stochastic discrete-event
simulation model is developed to obtain the optimal
project schedule, yielding the cost-wise best scenario
among all.
Managing Trade-off Between Cost and Time in Project Scheduling Problems Using Discrete Event Simulation
181

4 CASE STUDY
Mining construction projects are made up of
operational activities that take place over a
predetermined time. To reveal the model's capability
and applicability, the proposed simulation model is
applied to an electrical substation construction project
conducted in a mine. Table 1 represents the
construction project consisting of 19 activities.
Precedence relationships and activity durations are
determined based on expert opinions. Activity
durations are represented as minimum, most likely,
and maximum duration required to complete the
corresponding activity. The activity list includes every
step of electrical substation building, from conducting
economic feasibility study to supplying power.
Table 1: Activity list of the electrical substation
construction project.
ID Predecessors Duration
(
da
y
s
)
1 - (38,56,60)
2 1 (25,28,35)
3 2 (15,19,25)
4 3
(
75,84,152
)
5 3
(
90,105,125
)
6 3 (12,14,17)
7 6 (8,11,14)
8 6 (12,15,20)
9 6
(
5,6,8
)
10 7,8,9
(
30,34,40
)
11 10
(
38,40,45
)
12 5,11 (48,52,54)
13 5,11 (14,18,22)
14 12,13 (44,48,53)
15 12,13
(
17,20,23
)
16 4,14
(
57,62,65
)
17 15,16 (10,12,15)
18 17 (15,18,22)
19 18 (0,0,0)
On this basis, Arena® Simulation Software is
used to build the activity network diagram in a
dynamic simulation environment. The simulation
model is run considering the deterministic input
dataset which is addressed as the most likely activity
duration given in Table 1. As shown in Figure 3, the
critical path includes 10 activities, including 1, 2, 3,
5, 12, 14, 16, 17, 18, and 19. The calculated time to
complete the project is 400 days.
Following the introduction of the stochastic input
dataset as probability distributions, the developed
algorithm is computed to identify the project
bottleneck activities and analyse the risk associated
with project completion time under stochastic activity
durations. Activity durations are designated by
assigning random numbers from triangular
distributions with the parameters of minimum, most
likely, and maximum activity durations, as they are
given in Table 1.
Figure 3: The Critical Path Schedule for Path-1.
The simulation model is replicated 1,000 times to
remove the initial bias when a balancing point is
found, because of the stochasticity included into the
model. This approach enables estimation of the
distribution of the project completion times and the
associated uncertainty in the level of desired relative
precision. According to the given random activity
durations, the constructed model selects one of three
paths as the critical path, as shown in Figure 3, 4 and
5. Activities 1, 2, 3, 12, 14, 16, 17, 18, and 19 are
present on both paths. Since their probability to be on
the critical path is determined as 100%, they are
designated as bottleneck activities. The probability of
occurrence of Path-1 is calculated as 54.9%, Path-2
as 44.6%, and Path-3 as 0.5%.
Figure 4: The Critical Path Schedule for Path-2.
Figure 5: The Critical Path Schedule for Path-3.
1/1/2023 2/20/2023 4/11/2023 5/31/2023 7/20/2023 9/8/2023 10/28/2023 12/17/2023 2/5/2024
1
2
3
5
12
14
16
17
18
19
Time (dd/mm/yyyy)
Activity
Critical Path - 1
1/1/2023 2/20/2023 4/11/2023 5/31/2023 7/20/2023 9/8/2023 10/28/2023 12/17/2023 2/5/2024
1
2
3
6
8
10
11
12
14
16
17
18
19
Time (dd/mm/yyyy)
Activity
Critical Path - 2
1/1/2023 2/20/2023 4/11/2023 5/31/2023 7/20/2023 9/8/2023 10/28/2023 12/17/2023 2/5/2024
1
2
3
6
7
10
11
12
14
16
17
18
19
Time (dd/mm/yyyy)
Activity
Critical Path - 3
SIMULTECH 2023 - 13th International Conference on Simulation and Modeling Methodologies, Technologies and Applications
182
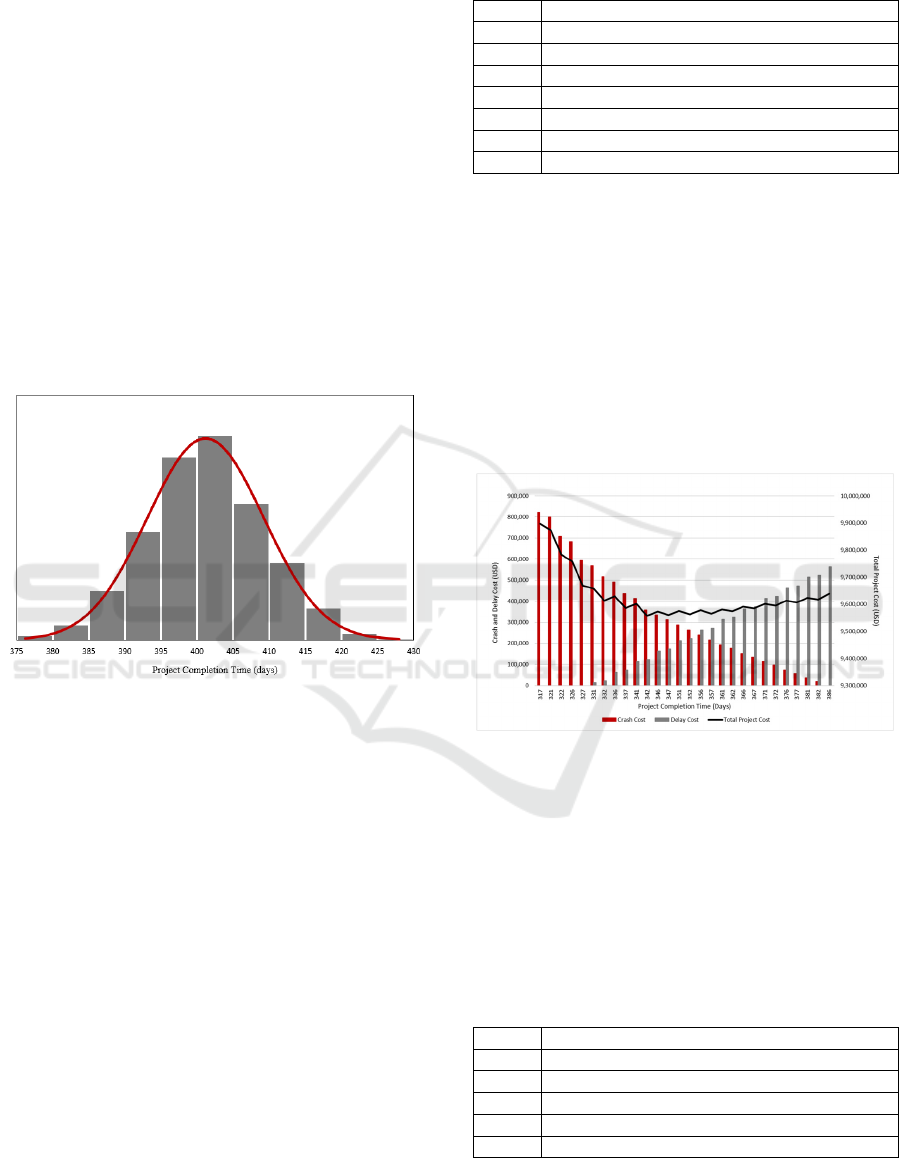
In addition, the project completion times are fitted
into the best distributions. A normal distribution with
a mean of 401.2 days and a standard deviation of 8.1
days is discovered to be able to accurately predict
project completion durations. The histogram of the
original output data and the fitted normal distribution
are shown in Figure 6. Based on the stochastic
activity durations, it is evident that the project will be
completed within 414.46 days with a 95%
probability. Additionally, it is observed that there is a
44.22% probability that the project will be completed
within 400 days. In contrast to deterministic
approach, stochastic model produces probabilistic
data that takes project uncertainties into account,
allowing the risk of delay to be evaluated. The
outcomes under these uncertainties demonstrate how
the deterministic approach deviates significantly in
terms of project completion time.
Figure 6: Fitting Normal Distribution for Project
Completion Times without Crashing.
Besides, the simulation-based optimization model
is modified to consider multiple project crashing
scenarios to reduce the overall project cost while still
adhering to the deadline and budget constraints. The
objective function and the constraints specified by
Equation (6-11) are included into the simulation
model using the OptQuest® for Arena® Simulation
Software. The crashed activity durations are defined
as the control variables of the system. Based on the
maximum crashing times listed in Table 2 and the
step of 5, 6,912 different crashing scenarios are
generated and integrated into the model. As the
response variables of the system, the activity
criticality, crashed durations, all the cost items, and
the project completion time factors are indicated.
Thus, the stochastic simulation algorithm is solved
such that the optimal project completion time is
attained through project crashing, giving the best
output among all the scenarios in terms of costs.
Table 2: Maximum crashing time of the activities.
ID Maximum Crashed Time
(
da
y
s
)
5 25
65
10 10
11 15
12 15
14 10
16 15
The simulation results of the project crashing
scenarios are shown in Figure 7. Crashing is seen to
reduce project completion time while gradually
increasing project cost. Similarly, as the delay penalty
is only paid when the project completion time reaches
a threshold value, which is set at 330 days, the delay
cost steadily rises as the project completion time
increases. Moreover, based on these two cost
elements, the project cost indicates a trade-off point,
showing the financially best schedule. The project
completion time of 342 days results in the best
solution.
Figure 7: Multi-Scenario Simulation Results on Cost Items.
According to the results, the critical path is seen
to span 10 activities, including 1, 2, 3, 5, 12, 14, 16,
17, 18, and 19, as shown in Figure 3. The optimal
crashed durations are demonstrated in Table 3 for the
cost-wise best scenario. The overall project cost is
calculated at $9,557,588.98 with 70 days of crashing,
with 94.95% of it being seen as normal cost, 3.76%
as crashing cost, and 1.29% as delay cost.
Table 3: Optimal crashed durations of DES solution.
ID Optimal Crashed Time (days)
5 25
65
10 10
11 15
16 15
Managing Trade-off Between Cost and Time in Project Scheduling Problems Using Discrete Event Simulation
183

Considering of the cost-wise optimal scenario
with the crashing durations listed in Table 3, the
simulation model is replicated 1,000 times and the
statistical analysis showed that the model constructs
three paths as the critical path, each of which covers
the activities 1, 2, 3, 12, 14, 16, 17, 18, and 19. Since
there is a 100% probability that these activities will
occur on the critical path, they are identified as
bottleneck activities. The schedules of Path-1, Path-
2, and Path-3 is depicted in Figures 3, 4, and 5,
respectively. The probability of occurrence of Path-1
is calculated as 77.4%, Path-2 as 22.3%, and Path-3
as 0.3%. In addition, the project completion times are
fitted into the best distributions. A normal distribution
with a mean of 359.5 and a standard deviation of 8.8
is also indicated to be able to identify the project
completion times. The histogram of the original
output data is shown in Figure 8, and the fit line
indicates the line of the normal distribution.
Figure 8: Fitting Normal Distribution for Project
Completion Times with Crashing.
The probability that the project will be completed
within 342 days is computed as 2.34%, when the
stochastic activity durations and 70 days of crashing
activity are considered. Additionally, it is observed
that the project will be completed within 374 days
with a 95% probability.
5 CONCLUSIONS
Predicting overall project cost and project completion
time is especially difficult for time-sensitive
engineering projects when operational uncertainties
are extremely noticeable. The timing of a
construction project is crucial in the mining industry
since a mining operation's worth depends on the gaps
in the commodity price of the mineral produced, price
cycles, the degree of market demand, the size of the
costumers, and sales potential. The risk of a project
should be controlled in accordance with the
company's willingness to take operational and
financial risk, which is highly variable depending on
the nature and objectives of the project.
In this study, a discrete-event simulation model
with multiple crashing scenarios is developed for the
time-cost trade-off project planning problems
considering stochastic and dynamic structure. The
model is then applied for an electrical substation
construction project conducted in a mine with the
total of 19 activities. To describe the scheduling of
activities, the basic project network is built as an
Activity-On-Node graph. The Arena® Simulation
Software is used to construct and run the model with
deterministic input dataset, and the project
completion time is observed as 400 days. On the other
hand, the criticality of the activities is assessed, and
the bottlenecks of the project are identified based on
simulation replications carried out with stochastic
input dataset. Statistical analysis is conducted on the
outputs of project completion times from 1,000
simulation replications. When stochastic activity
durations are considered, it is shown that there is a
44.22% probability that the project will be completed
within 400 days. Additionally, the multiple crashing
scenarios are integrated into the simulation-based
optimization model to minimize the overall project
cost under deadline and budget constraints. The
objective function and the constraints are established
and included in the generated simulation model using
the OptQuest® for Arena® Simulation Software. In
the cost-wise best scenario, the total project cost and
the project completion time are calculated
as $9,557,588.98 and 342 days, respectively, with a
total of 70 days of project crashing. 1,000 simulation
replications are run to find the best solution for the
DES model giving the most cost-effective scenario
considering the crashing durations, and the results are
statistically analysed. It is observed that the project
duration can be reduced by 9.89% under stochastic
activity durations, and the crashing durations
obtained from the best-case scenario of the DES
model. The project's outcomes produced a collection
of representations that reflect an equally probabilistic
understanding of reality including the uncertainties
encountered throughout project execution. Using this,
the decision-makers can make inference about the
risk of projects.
The model can be expanded in future research to
projects with more complicated structures. Further
research can focus on resource availability
constraints. On this basis, robust schedules can be
created that consider various schedule interruptions,
such as resource shortages and disruptions in the
SIMULTECH 2023 - 13th International Conference on Simulation and Modeling Methodologies, Technologies and Applications
184

material supply chain. Furthermore, the activity
disruptions, caused by environmental and operational
conditions such as the seasonality effect, can be
integrated to have more accurate schedules.
ACKNOWLEDGEMENTS
This research was supported by the Natural Sciences
and Engineering Research Council of Canada
(NSERC) (Fund number: NSERC RGPIN-2019-
04763). The authors are grateful for this support.
REFERENCES
Acebes, Fernando, Javier Pajares, José M. González-
Varona, and Adolfo López-Paredes. 2021. “Project
Risk Management from the Bottom-up: Activity
Risk Index.” Central European Journal of
Operations Research 29(4):1375–96. doi:
10.1007/s10100-020-00703-8.
Agyei, Wallace. 2015. “Project Planning And Scheduling
Using PERT And CPM Techniques With Linear
Programming: Case Study.” INTERNATIONAL
JOURNAL OF SCIENTIFIC & TECHNOLOGY
RESEARCH 4:8.
Alzraiee, Hani, Tarek Zayed, and Osama Moselhi. 2015.
“Dynamic Planning of Construction Activities Using
Hybrid Simulation.” Automation in Construction
49:176–92. doi: 10.1016/J.AUTCON.2014.08.011.
Botín, José Antonio, Nicholas Alexander Campbell, and
Ronald Guzmán. 2015. “A Discrete-Event
Simulation Tool for Real-Time Management of Pre-
Production Development Fleets in a Block-Caving
Project.” International Journal of Mining,
Reclamation and Environment 29(5):347–56. doi:
10.1080/17480930.2015.1086548.
Chen, Long, Qiuchen Lu, and Daguang Han. 2022. “A
Bayesian-Driven Monte Carlo Approach for
Managing Construction Schedule Risks of
Infrastructures Under Uncertainty.” SSRN Electronic
Journal 212(September 2022):118810. doi:
10.2139/ssrn.4119747.
Feng, Chung Wei, Liang Liu, and Scott A. Burns. 2000.
“Stochastic Construction Time-Cost Trade-off
Analysis.” Journal of Computing in Civil
Engineering 14(2):117–26. doi: 10.1061/(ASCE)
0887-3801(2000)14:2(117).
Hickson, R., and T. Owen. 2015. Project Management for
Mining Handbook for Delivering Project Success.
Colorado,: Society for Mining, Metallurgy &
Exploration Inc.
Hillier, Frederick S., and Gerald J. Lieberman. 2010.
Introduction to Operations Research. New York:
McGraw-Hill.
Jolai, Fariborz, Shahab Amelian, Sayyed Mohammad, Reza
Davoodi, and Abolfazl Sherafat. 2013. “Determining
Project Completion Time in Stochastic Networks
Using Discrete Event Simulation Method 1.”
Journal of Applied Sciences Research 9(4):2697–
2701.
Kelley, James E., and Morgan R. Walker. 1959. “Critical-
Path Planning and Scheduling.” Proceedings of the
Eastern Joint Computer Conference, IRE-AIEE-
ACM 1959 160–73. doi: 10.1145/1460299.1460318.
Li, Hong-xian, and Zhen Lei. 2010. “Discrete-Event
Simulation ( DES ) of Uncertainty-Based Time-Cost
Trade-off Analysis.” 2010 IEEE 17Th International
Conference on Industrial Engineering and
Engineering Management 196–99.
Lujić, Roberto, Dražen Barković, and Josip Jukić. 2019.
“Minimizing the Pessimistic Time of Activity in
Overhaul Project.” Tehnicki Vjesnik 26(2):391–97.
doi: 10.17559/TV-20180410114808.
Moreno, Francisco, Francisco Orozco, Omar Rojas, Bolivar
Senior, Mani Poshdar, and Eric Forcael. 2020. “A
Fixed Start Scheduling Approach for Repetitive
Construction Projects.” KSCE Journal of Civil
Engineering 2020 24:6 24(6):1671–82. doi:
10.1007/S12205-020-1429-8.
Mostafaei, Kamran, Shaho maleki, Mohammad Zamani
Ahmad Mahmoudi, and Dariusz Knez. 2022. “Risk
Management Prediction of Mining and Industrial
Projects by Support Vector Machine.” Resources
Policy 78(November 2021):102819. doi: 10.
1016/j.resourpol.2022.102819.
Mubin, Sajjad, Shah Jahan, and Ekaterina Gavrishyk. 2019.
“Monte Carlo Simulation and Modeling of Schedule,
Cost and Risks of Dasu Hydropower Project.”
Mehran University Research Journal of Engineering
and Technology 38(3):557–70. doi: 10.22581/
MUET1982.1903.03.
Nili, Mohammad Hosein, Hosein Taghaddos, and
Banafsheh Zahraie. 2021. “Integrating Discrete
Event Simulation and Genetic Algorithm
Optimization for Bridge Maintenance Planning.”
Automation in Construction 122(February
2020):103513. doi: 10.1016/j.autcon.2020.103513.
Romanskaya, Anastasia, and Anatoliy Berdnikov. 2020.
Project Risk Management Methodology. Vol. 1113
AISC. Springer International Publishing.
Song, Jie, Annelies Martens, and Mario Vanhoucke. 2022.
“Using Earned Value Management and Schedule
Risk Analysis with Resource Constraints for Project
Control.” European Journal of Operational
Research 297(2):451–66. doi: 10.1016/J.EJOR.
2021.05.036.
Winston, Wayne L. 2004. Operations Research:
Applications and Algorithms. 4th ed. Thomson
Learning, Inc.
Xu, Xiaoxiao, Jiayuan Wang, Clyde Zhengdao Li, Wenke
Huang, and Nini Xia. 2018. “Schedule Risk Analysis
of Infrastructure Projects: A Hybrid Dynamic
Approach.” Automation in Construction 95
(July):20–34. doi: 10.1016/j.autcon.2018.07.026.
Managing Trade-off Between Cost and Time in Project Scheduling Problems Using Discrete Event Simulation
185
