
Identification of Emergent and Floating Aquatic Vegetation Using an
Unsupervised Thresholding Approach: A Case Study of the Dniester
Delta in Ukraine
Ioannis Manakos
1
, Eleftherios Katsikis
1
, Sergiy Medinets
2
, Yevgen Gazyetov
2
,
Leonidas Alagialoglou
1
and Volodymyr Medinets
2
1
Information Technologies Institute, Centre for Research and Technology Hellas, Thessaloniki, Greece
2
Odesa National I.I. Mechnikov University, Odesa, Ukraine
Keywords: Wetland, Sentinel-2, Floating Vegetation, Emergent Vegetation, Thresholding, Multi-Class Segmentation.
Abstract: Monitoring of emergent and floating vegetation in freshwater ecosystems is of high importance for water
management in an area. This study proposes a methodology for the automatic monitoring of aquatic vegetation
using indicators estimated via remote sensing image analysis. The study area is located in the Lower Dniester
Basin in Southern Ukraine. The approach is developed using Sentinel-2 images and validated with field
measurements. The goal is to discriminate and map three classes of aquatic surface condition; namely, areas
covered with floating vegetation, or dominated by emergent vegetation, and open water. The approach is
transferable across different dates over a period of three years. Results are useful for governmental authorities
and natural/ national park administrations for near real-time monitoring of aquatic vegetation to mitigate the
impact of overgrowth on water quality, biodiversity, and ecosystem services.
1 INTRODUCTION
Freshwater ecosystems, being a valuable resource of
ecosystem services for local population wellbeing
and regional economy (e.g., drinking water
production, tourism, aquaculture, hydropower
generation), are vulnerable to anthropogenic impacts
(Sutton et al., 2011). The core driver of ecological
concerns in many transboundary river catchments,
including the Dniester, is excessive nutrients load of
anthropogenic origin as a result of agricultural,
industrial (via wastewater discharges and re-
deposition of gas emission), domestic (via sewage
discharges) and other anthropogenic activities (e.g.
Medinets et al., 2016, Medinets et al., 2020a,
Medinets et al., 2020b), which leads to a significant
increase of eutrophication in the river-deltas, their
lakes, and adjacent estuaries (Kovalova et al., 2021).
Moreover, temperature increase and precipitation
pattern alteration under changing climate, together
with fluvial water flow disturbance due to up-
regulation with hydro power constructions, often
enforce and intensify negative impacts on
biodiversity, biological resources, and ecosystem
services (Rouholahnejad et al., 2014). Along with
algal blooms, all this is also subjected to the
overgrowth of aquatic vegetation, which is often
observed in vulnerable deltaic areas.
Aquatic plants (emergent, floating and
submerged), being natural components of most water
bodies and playing an important role in aquatic
ecosystem functioning, when overgrown or bloomed,
often lead to harmful consequences for water quality,
biodiversity, ecosystem functioning and services
provision via
- decreasing dissolved oxygen level,
- increasing pH,
- reducing light penetration, slowing water velocity
(while increasing water temperature),
- increasing siltation rates (in slow streams),
- serving as mechanical substrates for filamentous
algae,
- clogging or hampering navigation channels/ areas
used for fishing and touristic purposes, and
- losing recreational/ touristic attractiveness
(Greenfield et al., 2007; Hussner et al., 2017).
Therefore, the near real time (semi-) automatic
monitoring of aquatic vegetation cover coupled with
the identification of its different types/ species is of
high value for authorities and natural/ national park
administrations. However, they are still a big
challenge in shallow water bodies.
98
Manakos, I., Katsikis, E., Medinets, S., Gazyetov, Y., Alagialoglou, L. and Medinets, V.
Identification of Emergent and Floating Aquatic Vegetation Using an Unsupervised Thresholding Approach: A Case Study of the Dniester Delta in Ukraine.
DOI: 10.5220/0012024000003473
In Proceedings of the 9th International Conference on Geographical Information Systems Theory, Applications and Management (GISTAM 2023), pages 98-103
ISBN: 978-989-758-649-1; ISSN: 2184-500X
Copyright
c
2023 by SCITEPRESS – Science and Technology Publications, Lda. Under CC license (CC BY-NC-ND 4.0)

Various histogram-based methods for automatic
earth observation features’ estimation exist in the
literature, which are based on satellite imagery
(Kordelas et al., 2018). Furthermore, based on the
success of machine learning methods in other
applications, (Chen et al., 2018) utilized decision
trees for mapping underwater vegetation, while the
study of Espel et al. (2020) compared the Random
Forest and the Support Vector Regression algorithms
for estimating submerged macrophyte cover from
very fine-scale resolution (50 cm) multispectral
Pléiades satellite imagery, and showed that both
algorithms have promising performance metrics.
Further studies aimed at classifying floating
vegetation in various water bodies using Sentinel-2
images. The results showed that the classification
accuracy was dependent on the density (Midwood et
al., 2010; Valta-Hulkkonen et al., 2004), and the
species (Ade et al., 2022) of the floating vegetation.
In this study, an approach is developed for
automatic monitoring of aquatic vegetation, by
discriminating and mapping three main classes
usually met in freshwater ecosystems (floating,
emergent vegetation, and open water-no vegetation).
Several indicators, which are derived by algebraic
combinations of the satellite bands, are exploited
within a multicriteria hierarchical analysis approach
on top of a verified unsupervised thresholding
approach (Kordelas et al., 2018, 2019; Manakos et
al., 2019). The proposed approach has been
developed and validated within the WQeMS H2020
project (Grant Agreement No. 101004157) using
reference and satellite data of the Dniester River,
which were initially registered by the authors for the
needs of ENI CBC BSB PONTOS project (Grant
Agreement No. BSB 889).
2 MATERIALS AND METHODS
2.1 Study Area
The study area is located in the Lower Dniester Basin,
covering the Dniester Delta and the adjacent Dniester
Estuary (Southern Ukraine) with a total area of
roughly 1800 km
2
(Fig. 1), including the Lower
Dniester National Nature Park (LDNNP). The
Dniester is the largest transboundary river in the
Western Ukraine and Moldova, discharging to the
Black Sea. The Lower Dniester Basin is located
within the Black Sea lowland, consisting of steppe
plains. The topography is a gently dipping plain,
which contributed to the development of extensive
wetland area in the floodplain of the river, dissected
Figure 1: Study area of the Dniester Delta (red boundaries)
and the territory occupied by the Lower Dniester National
Nature Park (dashed area), overlaid on a Google Earth
image snapshot.
by branches, ancient riverbeds that are often flooded
(OSCE, 2005).
The pilot area has a temperate continental climate.
Annual mean air temperature is 10.5°C (period of
2000-2014) varying from 8.4°C to 12.5°C (Medinets
et al., 2016). The long-term average annual
precipitation sum was 464 mm (2000-2014) but
varied substantially over the last years from 420 mm
(in 2020) to 771 mm (in 2021). The atmospheric total
N (TN) deposition rate is moderate at ca. 11.4 kg N
ha
-1
y
-1
(Medinets et al., 2020b) with around 67%
contribution from organic constituents. Such large
contribution is also observed for open waters in the
northwestern part of the Black Sea (Medinets and
Medinets, 2012; Medinets, 2014).
2.2 Satellite Imagery
Sentinel-2 (Level 2A) products are downloaded from
the Copernicus European Space Agency (ESA) hub
for the dates 11/08/2018, 05/08/2020, 30/08/2020,
05/08/2021. The acquired products refer to the tile
T35TQM.
2.3 Validation Data
Direct measurements of aquatic vegetation
boundaries were performed by field GPS tracking
using a boat in the north part of the Dniester Estuary
by the Odesa National I.I. Mechnikov University
(ONU) on an annual basis (in July) over 2010-2021
Identification of Emergent and Floating Aquatic Vegetation Using an Unsupervised Thresholding Approach: A Case Study of the Dniester
Delta in Ukraine
99

within the national projects studying Dniester
ecosystems funded by the Ministry of Education and
Science of Ukraine. This approach included the
following stages:
• Tracking of the boundaries of emergent and
floating vegetation with the boat-mounted GPS
device of Eagle SeaCharter 640CDF GPS with
horizontal accuracy of 3-5 m (when it was
impossible to distinguish floating vs. dense semi-
submerged vegetation, a sum of both was indicated
as a floating vegetation).
• Visual assessment of emergent and floating vegeta-
tion, its types and covered areas with a photo report.
• Post-expeditionary processing of geolocation data
was carried out. GPS data was downloaded and
converted into a coordinate system suitable for the
Geographical Information Systems (GIS) software.
• In a GIS software, the position of the aquatic
vegetation boundaries was checked and manually
corrected (where required) using available
spaceborne images (LandSat 5, 7, 8 and Sentinel-
2), since in some areas it was not possible to bypass
the aquatic vegetation polygons on a boat (small
vessel), because of dense vegetation cover or the
presence of other difficulties.
• Spatial analysis of aquatic vegetation polygons was
performed using a GIS software, which included
the corrections for boat indentation from the
vegetation boundaries, the production of digital
maps of emergent and floating vegetation cover,
and the analysis of spatiotemporal variations of
emergent and floating aquatic vegetation in certain
sectors of the Dniester Delta (Fig. 2). The studied
area was divided into 5 sectors according to the
geohydromorphological characteristics: (i) Sector
A: a north part of Dniester estuary with extensive
wetland area on the right bank of the river (76.3
km
2
); (ii) Sector B: the territory between two
branches (Deep Turunchuk and Dniester) of the
Dniester river (81.2 km
2
); (iii) Sector D: the
territory of the Dniester branch mouth with
adjacent area (20.3 km
2
); (iv) Sector E: the territory
of the left bank of the Dniester branch and the
Karaholsky bay (26.9 km
2
); (v) Sector F: an open
water central part of the Dniester Estuary (51.6
km
2
).
The ground reference data, which were used in this
study, were collected on 22/07/2018, 05/08/2020 and
26/07/2021, and utilized for validation as follows:
• Ground data on 22/07/2018 were used to assess the
validity of the predictions on 11/08/2018;
• Ground data on 05/08/2020 were used to assess the
validity of the predictions on 05/08/2020 and
30/08/2020;
• Ground data on 26/07/2021 were used to assess the
validity of the predictions on 05/08/2021.
Due to cloud conditions some dates of the ground
and the satellite data acquisitions are zero (0) to
twenty-five (25) days apart. The effect is considered
negligible for the development of the plant
communities during this period; however, the effect
is visible in the results and discussed, accordingly.
Figure 2: Location of sectors used for spatiotemporal
analysis of the emergent and floating vegetation cover in
the deltaic part of the Lower Dniester.
2.4 Methodology
An unsupervised approach was applied to map the
study area in three aquatic vegetation classes: namely,
i) open water, ii) emergent vegetation, and iii)
floating vegetation. The workflow is broken down in
three phases.
In the first phase the Sentinel-2 bands B04 (red),
B08 (near infrared; NIR), and B11 (shortwave
infrared; SWIR) are initially utilized to classify the
area in the land, open water and emergent vegetation
classes following the thresholding method suggested
in Kordelas et al., 2018 (Fig. 3).
All pixels with value smaller than the value of the
first deep valley (left Fig. 3 – left arrow) are classified
as open water. The emergent vegetation is identified
in the area, where following conditions apply:
a) the pixel value of the SWIR’s band histogram is
between the value of the first and the second deep
valley (Fig. 3 left – between left and right arrow),
and
b) the pixel value of the Normalized Difference
Vegetation Index (NDVI; (B08+B04)/(B08-B04))
histogram is after the first deep valley which is
greater than the value 0.3 (Fig. 3 right – after the
arrow).
GISTAM 2023 - 9th International Conference on Geographical Information Systems Theory, Applications and Management
100

The rest area is classified as land, and renamed to
unclassified, as this category is not of direct interest
for the aquatic vegetation mapping.
Figure 3: Open water (left Figure - left arrow) and emergent
vegetation (left Figure – right arrow & right figure arrow)
thresholds, estimated on the SWIR band (left Figure) and
the NDVI (right Figure), respectively (image acquisition
date: 30/08/2020).
In the second phase additionally Sentinel-2 bands
B05 (red edge; RE) and B12 (shortwave infrared;
SWIR2) are exploited. Three conditions are used to
determine the range of values that are most likely to
correspond to floating vegetation for the study area.
These conditions were identified using histogram
analysis based on the knowledge about the spectral
behavior of water and plants. Discriminating
thresholds are set accordingly. Specifically, for the
study area it is experimentally identified that a) the
B05/B11 ratio has to be between 0.6 and 1.5, b) the
Normalized Difference Water Index (NDWI) ((B08-
B11)/(B08+B11)) has to be between 0.2 and 0.45, and
c) the B12 band value has to be between 100 and 900.
In the third phase the results from the second
phase about the presence of floating vegetation are
superimposed over the previous results of the first
phase and the areas found as floating vegetation
replace any other underlying class. At the end a map
is produced, where all three classes are evident.
Accuracy assessment was performed with the
help of overall, user’s accuracy (UA) and producer’s
accuracy (PA) metrics. The overall accuracy (OA) is
calculated from the division of the number of the
correctly classified pixels by the total number of the
sampled pixels. The PA of each class, also called
precision, is the number of the correctly classified
pixels in this class divided by the number of reference
pixels in this class. The PA shows the false negative
predictions and compares the classified map with the
producers’ expectations. The UA highlights the false
positives, and it is calculated from the number of the
correctly predicted pixels of each class, divided by the
number of the pixels that have been classified in this
class and indicates how each classified pixel on the
map represents the class on the ground.
3 RESULTS AND DISCUSSION
In Fig. 4 and 5 high OA for all classes is observed
ranging from ~92% to 97%. The OA appears not to
be influenced by the day difference between the
spaceborne and ground data acquisition dates, since
even when taken 25 days apart, the OA remains
relatively stable (Fig. 4, 5). However, this is not a
consistent remark, as lower OA appears in the year
2018 (11/08/2018), where the time interval is 20 days.
This is to be accounted merely to the emergent and
floating vegetation detection performance, which
appears to drop further when two datasets are timely
apart (see specifically the PA chart – Fig. 4).
Figure 4: Producer's accuracy (in parenthesis the day
difference from the acquisition date of the ground reference
data).
Figure 5: User's accuracy (in parenthesis the day difference
from the acquisition date of the ground reference data).
Overall high OA (> 91%) at all dates is in this case
misleading for the performance of the approach in
each class, as the assessed dataset is imbalanced.
Namely, the average reference area over all dates of
the class ‘Open Water’ was 247.87 km
2
(71.86% of
the area), followed by 89.01 km
2
(25.80% of the area),
which were covered with ‘Emergent Vegetation’, and
8.07 km
2
(2.34% of the area) dominated by ‘Floating
Vegetation’ (Fig. 6). Thus, the detailed analysis with
the support of PA and UA is required.
91%
92%
93%
94%
95%
96%
97%
98%
60%
65%
70%
75%
80%
85%
90%
95%
100%
PA
05/08/2020
(same day)
PA
05/08/2021
(10 days)
PA
11/08/2018
(20 days)
PA
30/08/2020
(25 days)
Overall accuracy (%)
Producer's accuracy (%)
Open Water Emergent Vegetation
Floating Vegetation OA
91%
92%
93%
94%
95%
96%
97%
98%
60%
65%
70%
75%
80%
85%
90%
95%
100%
UA
05/08/2020
(same day)
UA
05/08/2021
(10 days)
UA
11/08/2018
(20 days)
UA
30/08/2020
(25 days)
Overall accuracy (%)
User's accuracy (%)
Open Water Emergent Vegetation
Floating Vegetation OA
Identification of Emergent and Floating Aquatic Vegetation Using an Unsupervised Thresholding Approach: A Case Study of the Dniester
Delta in Ukraine
101
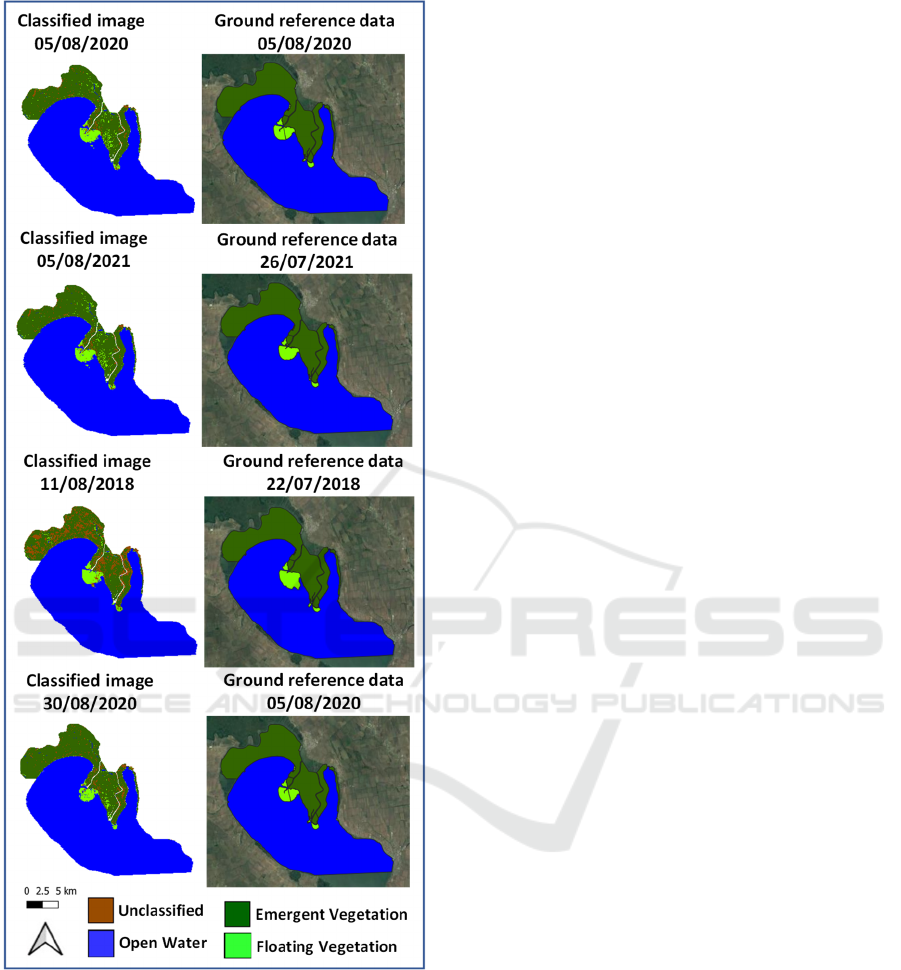
Figure 6: Aquatic vegetation maps on different dates (on the
left) juxtaposed against the ground reference data (overlaid
on Google Earth image snapshot) (on the right). Snapshot
maps are arranged from top to bottom according to the
timeliness of image vs. ground data acquisition dates.
In general, for all four validation dates, the highest
PA is shown in the class of ‘Open Water’, followed
by the class ‘Emergent Vegetation’ and the ‘Floating
Vegetation’ with the lowest PA. Latter demonstrates
the challenges that are posed for this class to be
accurately discriminated from the surrounding
environment. Furthermore, the PA is higher for the
‘Floating Vegetation’ class, when the reference and
classification dates are timely close. This observation
might be attributed to (i) the actual change of floating
vegetation distribution, and/ or (ii) wind-induced
floating vegetation polygon’s density/ geometry
change/ shift, and/ or (iii) wave- or water-level-
induced floating plant leaves moistening/ partial
flooding in the estuary during these intervals.
In contrary to the PA, where both emergent and
floating vegetation showcase an undulated pattern
through time, the UA seems not influenced for the
emergent vegetation and remains stable through time,
which however is not the case for the floating
vegetation (Fig. 5).
In addition to the aforementioned (see PA results
explanation) possible reasons for the lower
performance identifying water lilies and chestnuts
(floating vegetation in our study area), it is registered
that this type of classification error depends also on
the floating vegetation species and the density-level.
In Midwood et al. (2010) different wetlands in the
lake have been tested and the PA was higher in high-
density floating vegetation and the UA was higher in
low-density floating vegetation. Similar results are
reached in the study of the lake Luupuvesi in Finland
(Valta-Hulkkonen et al., 2004), where the dense
floating vegetation has higher PA, and the sparse
floating vegetation has higher UA. This seems to be
true for the study area and time of data acquisition, as
well. In July/August (until there is no strong flooding)
wind may substantially change the geometry and
density of floating vegetation appearance within
hours-to-days, as well as even move the water lilies
and water chestnut formations (polygons). High
waves (occurring in large-scale shallow water bodies)
may also break the polygons, by uprooting floating
rooted plant and move them.
4 CONCLUSIONS
The proposed unsupervised approach showed high
overall accuracy ranging from 92% to 97% on various
dates between 2018 and 2021, when classifying the
study area into three classes: open water, emergent
vegetation, and floating vegetation. It is found that
among the four validation dates, the open water class
had the highest OA, PA and UA, followed by the
emergent vegetation class, while the floating
vegetation class had the lowest performance (PA
between 67% - 81%, and UA between 61% – 84%),
indicating challenges in the discrimination and
monitoring of this class from space. The PA for the
GISTAM 2023 - 9th International Conference on Geographical Information Systems Theory, Applications and Management
102

floating vegetation class improved and the UA got
lower, when the reference and classification dates
were timely closer. This may be accounted to (i)
floating vegetation formation density/ geometry (in
line with international literature findings), (ii) floating
vegetation formation density/ geometry alterations
due to hydrometeorological disturbance with time,
and/ or (iii) changes in the distribution of floating
vegetation in the estuary through time (for timely
more apart reference and classification dates).
Further experimentation is required, where ground
reference data allow, to enhance the transferability of
the approach. Reference data acquisition across
additional sites may allow testing strict thresholding
performance and possibly evolving adaptive
thresholding techniques; thus, leading to
generalization of the approach. Ground data may also
support augmenting the suggested approach by
encompassing submerged aquatic vegetation
mapping. This is still a challenge for Earth
Observation due to the influence of the water column
on the reflected signal.
ACKNOWLEDGEMENTS
This research has received funding from the European
Union’s Horizon 2020 Research and Innovation
Action programme under Grant Agreement
101004157 – WQeMS, and was partially supported
by the GEF-UNEP funded ‘Towards INMS’ project
(www.inms.international). Ground reference data
were acquired within the projects NDR#602 funded
by the Ministry of Education and Science of Ukraine
(2020-2022) and ENI CBC BSB PONTOS (Grant
Agreement: BSB 889).
REFERENCES
Ade, Christiana, et al. "Genus-level mapping of invasive
floating aquatic vegetation using Sentinel-2 satellite
remote sensing." Remote Sensing 14.13 (2022): 3013.
Chen, Qi, et al. "A new method for mapping aquatic
vegetation especially underwater vegetation in Lake
Ulansuhai using GF-1 satellite data." Remote Sensing
10.8 (2018): 1279.
Espel, Diane, et al. "Submerged macrophyte assessment in
rivers: An automatic mapping method using Pléiades
imagery." Water Research 186 (2020): 116353.
Greenfield, B. K., G. S. Siemering, J. C. Andrews, M.
Rajan, S. P. Andrews Jr., Spencer D. F. (2007).
Mechanical shredding of water hyacinth (Eichhornia
crassipes): Effects on water quality in the Sacramento-
San Joaquin River Delta, California. Estuaries and
Coasts, 30, 627-640.
Kordelas, Georgios A., et al. "Fast and automatic data-
driven thresholding for inundation mapping with
Sentinel-2 data." Remote Sensing 10.6 (2018): 910.
Kovalova, N., Medinets, V., Medinets, S. (2021).
Peculiarities of Long-Term Changes in
Bacterioplankton Numbers in the Dniester Liman.
Hydrobiological Journal, 57, 27-36.
Manakos, I., Kordelas, G., Marini, K. (2019). Fusion of
Sentinel-1 data with Sentinel-2 products to overcome
non-favourable atmospheric conditions for the
delineation of inundation maps. European Journal of
Remote Sensing, DOI: 10.1080/22797254.2019.1596
757.
Medinets, S. (2014). The Black Sea nitrogen budget
revision in accordance with recent atmospheric
deposition study. Turkish Journal of Fisheries and
Aquatic Sciences, 14, 981-992.
Medinets, S. and Medinets, V. (2012). Investigations of
atmospheric wet and dry nutrient deposition to marine
surface in western part of the Black Sea. Turkish
Journal of Fisheries and Aquatic Sciences, 12, 497-505.
Medinets, S., Gasche, R., Skiba, U., Medinets, V.,
Butterbach-Bahl, K. (2016). The impact of
management and climate on soil nitric oxide fluxes
from arable land in the Southern Ukraine. Atmospheric
Environment, 137, 113-126.
Medinets, S., Kovalova, N., Medinets, V. et al. (2020a).
Assessment of riverine loads of nitrogen and
phosphorus to the Dniester Estuary and the Black Sea
over 2010-2019. In Monitoring of Geological Processes
and Ecological Condition of the Environment. EAGE.
https://doi.org/10.3997/2214-4609.202056029
Medinets, S., Mileva, A., Kotogura, S. et al. (2020b). Rates
of atmospheric nitrogen deposition to agricultural and
natural lands within the Lower Dniester catchment. In
Monitoring of Geological Processes and Ecological
Condition of the Environment. EAGE. https://doi.org/
10.3997/2214-4609.202056053
Midwood, Jonathan D., and Patricia Chow-Fraser.
"Mapping floating and emergent aquatic vegetation in
coastal wetlands of Eastern Georgian Bay, Lake Huron,
Canada." Wetlands 30 (2010): 1141-1152.
OSCE (2005). Transboundary diagnostic study for the
Dniester river basin. Project Report, November 2005.
OSCE/UNECE publication, 94 p.
Rouholahnejad, E., Abbaspour, K. C., Srinivasan, R., Bacu,
V., Lehmann, A. (2014). Water resources of the Black
Sea Basin at high spatial and temporal resolution. Water
Resources Research, 50, 5866-5885.
Sutton, M.A., Howard, C.H., Erisman, J.W. et al. (2011).
The European nitrogen assessment. Cambridge:
Cambridge University Press.
Valta-Hulkkonen, Kirsi, A. Kanninen, and P. Pellikka.
"Remote sensing and GIS for detecting changes in the
aquatic vegetation of a rehabilitated lake." International
Journal of Remote Sensing 25.24 (2004): 5745-5758.
Identification of Emergent and Floating Aquatic Vegetation Using an Unsupervised Thresholding Approach: A Case Study of the Dniester
Delta in Ukraine
103
