
Examination of the Relationship Between Smartphone Dependency
and Driving Behaviour in Young Drivers: Preliminary Analysis
Won Sun Chen
a
, James Boylan
b
and Denny Meyer
c
Department of Health Sciences and Biostatistics, Swinburne University of Technology, John Street, Hawthorn, Australia
Keywords: Smartphone Use, Driving Behaviour, Young Drivers.
Abstract: The smartphone has emerged as one of the important necessities in our daily lives. However, smartphone
dependency can have negative as well as positive impacts on our overall well-being. Young adults are likely
to demonstrate particularly problematic dependency on smartphone use. This is also the age group with a
disproportionate contribution to road deaths in Australia (approximately 25% for 17-25 year olds), for reasons
such as lack of experience and road awareness, resulting in bad choices or poor assessment of a road situation.
The current study aimed to examine the relationship between smartphone dependency and driving behaviour
in young people provided with the basic (control group) and extended (intervention group) features of an in-
car telematics device. Participants aged between 18-30 were invited to complete the self-reported
questionnaires, and an in-car telematics device with basic features was then activated over a 30-day period in
their vehicles. At the start of the second 30-day period, half of the participants had their telematics installation
extended. A linear mixed model analysis was conducted to allow for the hierarchical structure of the telematics
data, with trips nested within drivers. The results suggest that in-car telematics devices can be adopted to
improve the driving behaviour of young drivers.
1 INTRODUCTION
1.1 Background
In 2020 about 12% of the Australian population
(approximately 3.2 million) consisted of young adults
aged 15-24 years and by 2026 this number is
projected to reach 5.1 million (AIHW, 2021). In
2020-21, the reported number of road hospitalisations
and deaths was dominated by those aged 15-24 years,
accounting for 430 hospitalisations and 6.9 deaths per
100,000 young people in this age group (AIHW,
2022). Globally, young drivers have emerged to be
over-represented in accident deaths partly due to lack
of driving experience and developmental factors
(Arnett, 2022).
Smartphone ownership is gaining popularity in
Australia. In 2019, almost all Australians aged 18 and
above owned a smartphone (Granwal, 2022a). The
number of smartphone users in Australia is estimated
to reach 23.6 million by 2026, which translates to an
a
https://orcid.org/0000-0001-9077-3530
b
https://orcid.org/0000-0003-3089-8408
c
https://orcid.org/0000-0002-9902-0858
87% smartphone penetration rate in 2026 compared
to just under 75% in 2022 (Granwal, 2022b). A study
conducted by White et al. (2010) revealed that young
adults are disproportionately represented amongst the
most frequent mobile phone users in Australia
compared to other advanced countries. These young
adults tended to engage in excessive phone use and
demonstrated indications of phone addiction, such as
checking their phone continuously and thinking about
their mobile phone constantly. With the advancement
of technology, drivers have tended to broaden their
mobile phone use from traditional usage (receiving or
making call and texting) to also include using social
media applications, reading emails, taking
photographs and videos, as well as navigation
guidance. If conducted while driving these activities
are likely to put these young drivers as well as other
drivers in danger (Kaviani et al., 2020a).
Furthermore, more screen time has been found to be
significantly associated with increasingly
problematic smartphone dependency in younger
428
Chen, W., Boylan, J. and Meyer, D.
Examination of the Relationship Between Smartphone Dependency and Driving Behaviour in Young Drivers: Preliminary Analysis.
DOI: 10.5220/0012028500003479
In Proceedings of the 9th International Conference on Vehicle Technology and Intelligent Transport Systems (VEHITS 2023), pages 428-435
ISBN: 978-989-758-652-1; ISSN: 2184-495X
Copyright
c
2023 by SCITEPRESS – Science and Technology Publications, Lda. Under CC license (CC BY-NC-ND 4.0)

people (Kaviani et al., 2020b). Interestingly, a recent
Canadian study has shed some light on the reasons for
high mobile device usage during the COVID-19
pandemic. This was associated with improved social
connectedness, productivity and mental well-being
(Jonnatan et al., 2022).
In 2021, the World Health Organisation reported
that drivers engaging in mobile phone use while
driving were found to be four times more likely to be
involved in an accident than those drivers without
such engagement (WHO, 2021). Additionally, mobile
phone use while driving was found to affect drivers’
response time to braking and traffic signals (WHO,
2021; Strayer & Johnston, 2001), also influencing
their ability to maintain lateral vehicle control (Caird,
et al., 2014). Existing literature has revealed that the
main factors associated with young driver deaths on
the roads included mobile phone use while behind the
wheel (Li et al., 2016), internal factors (e.g. lack of
concentration), driver’s behaviour and driver’s
gender (Koppel et al., 2022). Arvin & Khattak (2020)
highlighted the alarming finding that a one-second
delay due to dialling or texting elevated the chance of
an accident by 5.6% and 3.6%, respectively.
1.2 In-Car Telematics
In-car telematics is defined as a system capable of
measuring and capturing real-time car usage. These
systems can easily be installed in any car and they
generally collect data for variables such as
longitudinal acceleration (forwards and backwards
movement), lateral acceleration (sideways
movement), yaw (turning speed), global positioning
system (GPS) coordinates, timestamps, vehicle
speed, speed zone, revolutions per minute (RPM),
engine load, mass airflow intake, and carbon dioxide
(CO2) intake (SIRA, 2019).
Over the last decade, the use of in-car telematics
has gained popularity because of evolving
information and communications technology (SIRA,
2019). The existing literature has found contrasting
results about the use of in-car telematics along with
the effect of feedback from these devices for
influencing driving behaviour. For example, the use
of in-car telematics along with feedback (Wijnands et
al., 2018) and related incentives for good driving
(Peer et al., 2020), tended to improve driving
behaviour. However, no such improvement was
found in a study conducted by Stevenson et al. (2021).
Findings from a Young Drivers Telematics Trial
(YDTT) conducted in Australia revealed that
telematics use led to positive impacts for young driver
behaviour (SIRA, 2019). However, the degree of
behaviour and sociodemographic characteristics of
positive impact depends on the previous driving
behaviour and the sociodemographic characteristics
of the driver, as well as the surrounding traffic
environment. Interestingly, the young drivers
reflected that the telematics devices they experienced
in the study had constantly reminded them to be more
aware of their driving behaviour (SIRA, 2019).
1.3 Study Objective
The present study aimed to compare the relationship
between smartphone dependency and driving
behaviour for participants allocated with the basic and
extended features of an in-car telematics device. Both
smartphone dependency and driving behaviour were
assessed using self-reported measures, while the
braking behaviour was investigated through
telematics data.
2 METHODOLOGY
This section provides an overview of the participant
characteristics, the self-reported measures used, the
telematics data considered and the statistical methods
used for analysis.
2.1 Participants
Participants aged between 18 and 30 years, residing
in the state of Victoria in Australia and with a valid
Victorian driver license were invited to join this study
between January and December 2022. This
naturalistic study collected data through in-car
telematics devices for a 60-day driving period, with
telematics data collected as described in section 2.2,
and a research questionnaire as explained in section
2.3. All participants completed questionnaires before
the start of the study (baseline), at the end of the first
30-day driving period (Time 1) and at the end of the
second 30-day driving period (Time 2).
This study was approved by the Swinburne
University Human Research Ethics Committee (SHR
Project 20225945-9779).
2.2 Telematics Data
The GOFAR in-car telematics devices shown in
Figure 1 were adopted for this study. All participants
were asked to install an adapter to their car’s
diagnostic port. Next, they were required to download
a GOFAR app available at the Google Play or the
Apple App store on their smartphone. After that,
Examination of the Relationship Between Smartphone Dependency and Driving Behaviour in Young Drivers: Preliminary Analysis
429
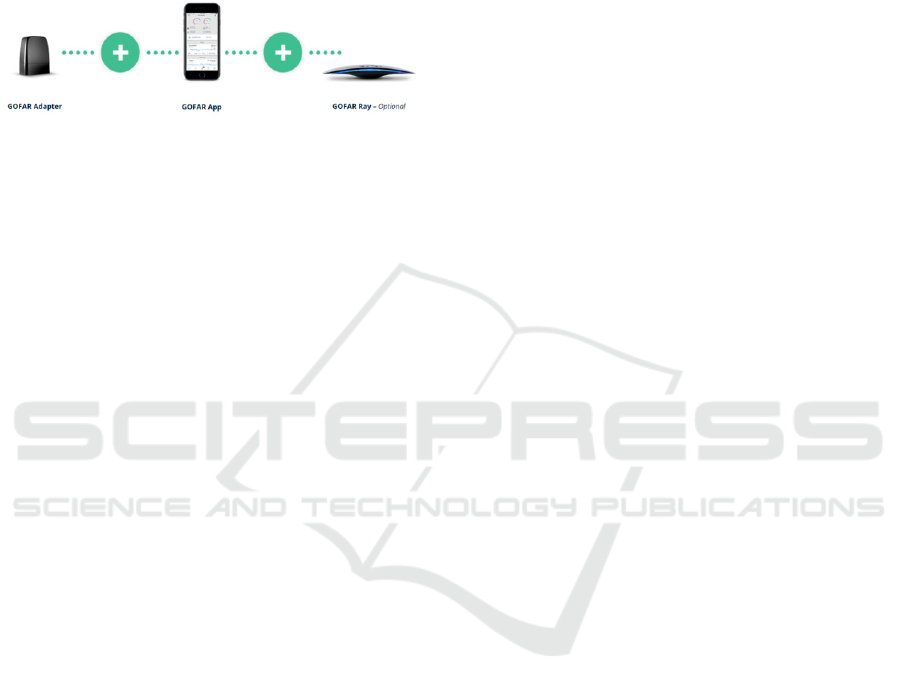
participants needed to sync their smartphone with this
adapter. The GOFAR app is capable of monitoring a
car’s efficiency, state of repair and performance. The
combination of the GOFAR app and adapter were
regarded as the basic feature of the telematics devices.
The extended feature of this device, known as the ray,
aimed to provide feedback to help participants to
become safer and more efficient in their driving.
Figure 1: GOFAR devices.
The telematics device recorded and transferred
vehicle real-time data, such as speed, braking score,
GPS coordinates, timestamp, RPM, engine load, fuel
consumption and emission, in two second intervals
when the ignition was engaged and the driver’s phone
had Bluetooth switched on.
2.3 Research Questionnaire
The research questionnaire consisted of three
components: 1) questions related to participant
demographic characteristics and driving
characteristics; 2) nomophobia severity questionnaire
(NMP-Q) developed by Yildirim & Correia (2015);
and 3) driving behaviour questionnaire (DBQ)
established as well as validated by Lawton et al.
(1997), Parker et al. (1998) and Lajunen et al. (2004).
2.3.1 Nomophobia Severity Questionnaire
(NMP-Q)
Nomophobia, which is an abbreviation for “no mobile
phone phobia”, is defined as a collection of symptoms
experienced when without a phone including 1) being
unable to communicate, 2) losing connectedness, 3)
not being able to access information and 4)
inconvenience (Yildirim & Correia, 2015).
The Nomophobia severity questionnaire (NMP-
Q) comprises 20 items across the above four
symptom domains. Each item is rated using a seven-
point Likert scale (1=strongly disagree and
7=strongly agree). The total score is calculated by
summing item responses to produce a score ranging
from 20 to 140, where higher scores indicate higher
levels of nomophobia. The total score has further
been categorised as “absence of nomophobia” (score
less than 20), “mild level of nomophobia” (score of
20 or more to less than 60), “moderate level of
nomophobia” (score of 60 or more to less than 100),
and “severe level of nomophobia” (score of 100 or
more) (Yildirim & Correia, 2015). In this preliminary
study this categorical measure was converted into a
binary measure identifying drivers with moderate to
severe nomophobia levels.
2.3.2 Driving Behaviour Questionnaire
(DBQ)
Globally, the Manchester Driver Behaviour
Questionnaire (DBQ) can be regarded as one of the
most well accepted self-reported measures of aberrant
driver behaviour for the last 20 years. The extended
27-item DBQ includes items pertaining to aggressive
violations, ordinary violations, errors and lapses
(Lawton et al., 1997; Parker et al., 1998; Lajunen et
al., 2004).
Participants were asked to respond to the 27
driving behaviour items using a six-point Likert scale
(0=never and 5=nearly all the time), based on the
vehicle they most frequently drove (Reason et al.,
1990). The total score is obtained by summing item
responses to produce a score ranging from 0 to 135,
where higher scores show more aggressive driving
behaviour (Ang et al., 2019).
2.4 Data Preparation
2.4.1 Data Collection
According to Figure 2, all participants were provided
with a basic configuration of the device during Time
1. Half of these participants were randomly allocated
to enjoy additional features of the device such as real-
time driver feedback and an alert system during Time
2 (intervention group). The remaining half of the
participants continued their driving during Time 2
with the basic configuration of the device (control
group). The main outcome measure captured from the
telematics device for each of these periods was the
braking score, with higher scores indicating less
aggressive braking behaviour. Nomophobia and DBQ
Scores were collected at the start of Time 1 and Time
2 while average Braking Scores were computed using
the Braking data collected within each of these 30-
day periods. At present, the data collection for Time
2 is still ongoing for most of the participants.
2.4.2 Data Cleaning
There were challenges associated with the cleaning of
the telematics data due to the volume of data.
VEHITS 2023 - 9th International Conference on Vehicle Technology and Intelligent Transport Systems
430

Figure 2: Data collection process.
Furthermore, the quality of data captured varied
between individual participants as did the frequency
of their driving. All trips without GPS coordinates,
with a zero braking score and less than 1km in
travelling distance were excluded from the analyses.
Furthermore, zero DBQ total score were treated as
missing values. Range checks were performed on the
responses collected for both the NMP-Q and DBQ,
and only participants with responses for all items
were included in this study.
2.5 Statistical Analysis
Descriptive statistics (such as mean, standard
deviation, median and range) were presented for
continuous data whilst frequencies and percentages
were reported for categorical data. Boxplots were
used to compare the nomophobia total scores, DBQ
total scores and braking scores for the control and
intervention groups for Time 1 and Time 2.
Pearson’s correlation coefficients were used to
examine the strength of the linear relationship
between nomophobia total scores and DBQ total
scores, between nomophobia total scores and average
braking scores, as well as between DBQ total scores
and average braking scores.
Linear mixed model analyses were conducted
allowing for the hierarchical structure of the
telematics data, with trips nested within drivers.
Separate analyses used the braking scores and the
DBQ total scores as the dependent variables whilst
testing the significance of the Nomophobia by Time
interaction effect separately for each Group. These
analyses were adjusted for age, gender and distance
travelled when comparing the relationship between
driving behaviour and nomophobia severity in the
intervention and control groups.
Diagnostic tests were conducted for normality,
linearity and multicollinearity to validate the results.
A p-value < 0.05 was deemed statistically significant
for all tests. The analyses were conducted using
STATA Intercool version 16 (Stata Corp, College
Station, TX).
3 RESULTS
3.1 Demographic Characteristics
A total of 42 participants joined this naturalistic
study, but only 32 (76%) and 9 (21%) completed data
collection for Time 1 and Time 2 respectively. These
participants were aged between 19 to 29 years with an
average age of 24 years (SD of 2.6 years). The
majority of these participants were female (51%),
with full driver licenses (67%), mostly residing in a
major city (65%).
There was a total of 3,134 and 905 driving trips
recorded for Time 1 and Time 2 respectively. The
average travelled distance per trip for participants in
Time 1 was found to be 13 km (SD of 19 km), with
individual distances travelled per trip ranging
between 1km and 499 km. On the other hand,
participants in Time 2 travelled between 1 to 228 km
per trip with an average travelled distance per trip of
16 km (SD of 25 km).
3.2 Parameter Characteristics
3.2.1 Nomophobia Total Score
Figure 3a showed participants from the control group
had higher average nomophobia total scores (M=65,
SD=0.50) compared to participants in the
intervention group (Ray) (M=51, SD=1.0),
demonstrating higher smartphone dependency. On
the other hand, the average nomophobia total score
for participants at the start of Time 1 was only slightly
lower (M=63, SD=0.5) in comparison to the
beginning of Time 2 (M=64, SD=1.0), showing no
significant difference for smartphone dependency
(Figure 3b).
Examination of the Relationship Between Smartphone Dependency and Driving Behaviour in Young Drivers: Preliminary Analysis
431

Figure 3a: Boxplot of nomophobia total score at the start of
each period by Group.
Figure 3b: Boxplot of nomophobia total score at the start of
each period by Time.
3.2.2 DBQ Total Score
It was indicated in Figure 4a that the average DBQ
total score for the control group (M=23, SD=0.3) was
only slightly higher than the intervention (Ray) group
(M=22, SD=0.6). Additionally, the average DBQ
Figure 4a: Boxplot of DBQ total score at the start of each
period by Group.
total score at the start of time 1 (M=23, SD=0.2) was
similar at the beginning of time 2 (M=23, SD=0.6)
(Figure 4b).
Figure 4b: Boxplot of DBQ total score at the start of each
period by Time.
3.2.3 Braking Scores
Figure 5a revealed that the average braking score per
trip for participants from the control group (M=76,
SD=0.1) was significantly lower than for participants
from the intervention (Ray) group (M=77, SD=0.4),
demonstrating more aggressive braking behaviour.
Furthermore, the average braking score per trip for
participants for time 1 (M=77, SD=0.1) was higher
than for time 2 (75, SD=0.3) (Figure 5b).
3.2.4 Correlations Between Parameters
Pearson correlation coefficients were computed to
assess the strength of the linear relationship between
nomophobia total scores, DBQ total scores and
average braking scores. There was a weak positive
correlation between the nomophobia total scores and
DBQ total scores (r(3541)=0.15, p<.001), indicating
Figure 5a: Boxplot of average braking score per trip by
Group.
VEHITS 2023 - 9th International Conference on Vehicle Technology and Intelligent Transport Systems
432

Figure 5b: Boxplot of average braking score per trip by
Time.
that participants with high smartphone dependency
tended to rate their driving more aggressively.
There was a weak negative correlation between
nomophobia total scores and the average braking
scores (r(3513)=-0.09, p<.001), showing that
participants with low levels of smartphone
dependency were likely to drive with less aggressive
braking behaviour. On the other hand, DBQ total
scores were found to have a weak negative
association with the average braking score (r(3626)=-
0.04, p=.031), indicating that participants who rated
their behaviour more favourably tended to have less
aggressive braking behaviour.
3.3 Linear Mixed Model
The linear mixed model analyses were conducted
based on the complete data collected for 32
participants at Time 1 and 9 participants at Time 2.
Time 2 included four (46%) and five (56%)
participants allocated to the control group and
intervention (Ray) group, respectively.
3.3.1 Braking Score
This preliminary analysis indicated that there was a
significant Nomophobia by Time interaction effect
(Z=-2.74, p=.006) for braking behaviour for
participants from the intervention group, but no such
finding was observed for participants from the control
group (Z=-1.61, p=.107). This outcome suggested
that participants who were moderately to severely
reliant on their smartphone were able to improve their
braking behaviour in the presence of real-time driver
feedback (via the Ray) (Figure 6).
Figure 6: Daily marginal means for braking scores by
nomophobia level for the intervention group.
3.3.2 DBQ Total Score
In contrast, when using the self-report DBQ total
score as an indicator of driving behaviour, no
significant Time by Nomophobia interaction effect
was found for participants from the intervention
(Ray) group (Z=1.52, p=.130) nor for those in the
control group (Z=0.49, p=.624). This suggests that
there was no significant change in self-assessed
driving behaviour that was related to smartphone
dependency for either group.
4 CONCLUSIONS
This preliminary study explored the effect of
smartphone dependency on driving behaviour over a
period of time in a naturalistic setting.
This study showed that participants exhibited a
mild to moderate level of nomophobia, meaning that
they relied on their smartphones to some extent. This
finding was consistent with other studies (Kaviani et
al., 2020a; Yildrim & Correia, 2015). However, since
nomophobia was gauged through a self-reported
questionnaire, the actual prevalence of nomophobia
remains unknown.
Both braking score and DBQ total score were
found to be important indicators of driving behaviour.
However, braking score could be regarded as the
better indicator of driving behaviour because the
braking score was estimated using real-time
telematics data for each participant, whilst the DBQ
total score was derived from self-reported responses
from the participant.
Participants who received feedback from the in-
car telematics device (Ray) have shown improvement
in their self-reported driving behaviour over time.
Examination of the Relationship Between Smartphone Dependency and Driving Behaviour in Young Drivers: Preliminary Analysis
433

This finding was consistent with the results of
Wijnands et al. (2018).
Despite only a small pool of participants included
in this preliminary study for Time 2, the results
suggest that in-car telematics use has a positive
impact on young driver behaviour. This finding aligns
with a previous study conducted by SIRA (2019).
There were a few limitations in this study. Firstly,
the use of self-reported questionnaires may have
caused bias. Participants might not have provided
accurate responses to the questionnaire designed to
gauge their smartphone dependency, due to the fear
that their behaviour might be judged to be socially
unacceptable. Secondly, only a small sample of
participants were included in this preliminary
analysis for Time 2. The research team expect to
show more reliable findings from this study after all
42 participants have completed their Time 2 driving
period. Thirdly, most of the participants captured all
their daily driving trips using the in-car telematics
devices. However, a handful of participants logged a
much lower driving frequency than the average,
making their data less reliable. Lastly, this study
commenced during the COVID-19 pandemic and the
effect of the pandemic on the study findings remains
unknown.
In conclusion, this study suggests that in-car
telematics feedback and alarm systems have the
potential to improve the braking behaviour of young
drivers who exhibit moderate/severe dependency on
their smartphones, reminding them to behave more
responsibly when behind the wheel.
ACKNOWLEDGEMENTS
The research team would like to thank Erwin
Muharemovic, who was an honours student at
Swinburne University of Technology, for his
assistance with the data collection. Furthermore, the
research team was grateful for the significant
contributions from all participants. This work was
supported by the Australian Government Department
of Infrastructure, Transport, Regional Development
and Communications (RSIF2-59).
REFERENCES
Ang, B. H., Chen, W. S., Lee, S. W. (2019). The Malay
Manchester driver behaviour questionnaire: a cross-
sectional study of geriatric population in Malaysia.
Journal of Transport & Health, 14, 100573.
https://www.doi.org/10.1016/j.jth.2019.100573
Arnett, J. J. (2022). Developmental sources of crash risk in
young drivers. Injury Prevention, 8, ii17-ii23.
https://dx.doi.org/10.1136/ip.8.suppl_2.ii17
Arvin, R., & Khattak, A. J. (2020). Driving impairments
and duration of distractions: assessing crash risk by
harnessing microscopic naturalistic driving data.
Accident Analysis & Prevention, 146, 105733.
https://doi.org/10.1016/j.aap.2020.105733
Australian Institute of Health and Welfare (AIHW). (2021).
Australia’s youth. Available: https://www.aihw.gov
.au/reports/children-youth/australias-youth/contents/de
mographics. Accessed: December 24, 2022.
Australian Institute of Health and Welfare (AIHW). (2022).
Transport accidents. Available: https://www.aihw.gov.
au/reports/injury/transport-injuries. Accessed: Dece
mber 24, 2022.
Caird, J. K., Johnston, K. A., Willness, C. R., & Asbridge,
M. (2014). The use of meta-analysis or research
synthesis to combine driving simulation or naturalistic
study results on driver distraction. Journal of Safety
Research, 49, 91.e1-96. https://doi.org/10.1016/j.
jsr.2014.02.013
Granwal, L. (2022a). Smartphone ownership Australia
2019 by age. Available: https://www.statista.com/
statistics/730101/australia-smartphone-ownership-by-a
ge/. Accessed: December 24, 2022.
Granwal, L. (2022b). Smartphone users in Australia 2017-
2026. Available: https://www.statista.com/statistics/
467753/forecast-of-smartphone-users-in-australia/. Ac
cessed: December 24, 2022.
Jonnatan, L., Seaton, C. L., Rush, K. L., Li, E. P. H., &
Hassan, K. (2022). Mobile device usage before and
during the COVID-19 pandemic among rural and urban
adults. International Journal of Environmental
Research and Public Health, 19(14), 8231.
https://www.doi.org/10.3390/ijerph19148231
Kaviani, F., Young, K. L., Robards, B., & Koppel, S.
(2020a). Nomophobia and self-reported smartphone
use while driving: an investigation into whether
nomophobia can increase the likelihood of illegal
smartphone use while driving. Transportation
Research Part F: Traffic Psychology and Behaviour,
74, 212-224. https://doi.org/10.1016/j.trf.2020.08.024
Kaviani, F., Robards, B., Young, & K. L., Koppel, S.
(2020b). Nomophobia: Is the fear of being without a
smartphone associated with problematic use?
International Journal of Environmental Research and
Public Health, 17(6024), 1-19.
Koppel, S., Stephens, A. N., Kaviani, F., Peiris, S., Young,
K. L., Chambers, R., & Hassed, C. (2022). It’s all in the
mind: the relationship between mindfulness and
nomophobia on technology engagement while driving
and aberrant driving behaviour. Transportation
Research Part F: Traffic Psychology and Behaviour,
86, 252-262. https://doi.org/10.1016/j.trf.2022.03.002
Lajunen, T., Parker, D., Summala, H. (2004). The
Manchester driver behaviour questionnaire: a cross-
sectional study. Accident Analysis and Prevention,
36(2), 231-238. https://doi.org/10.1016/S0001-
4575(02)00152-5
VEHITS 2023 - 9th International Conference on Vehicle Technology and Intelligent Transport Systems
434

Lawton, R., Parker., D., Manstead, A. S. R., Stradling, S.
(1997). The role of affect in predicting social
behaviours: the case of road traffic violations. Journal
of Applied Social Psychology, 27(14), 1258-1276.
https://doi.org/10.1111/j.1559-1816.1997.tb01805.x
Li, X., Yan, X., Wu, J., Radwam, E., & Zhang, Y. (2016).
A rear-end collision risk assessment model based on
drivers’ collision avoidance process under influences of
cell phone use and gender – a driving simulator based
study. Accident Analysis & Prevention, 97, 1-18.
https://doi.org/10.1016/j.aap.2016.08.021
Parker, D., Lajunen, T., Stradling, S. (1998). Attitudinal
predictors of aggressive driving violations.
Transportation Research Part F: Traffic Psychology
and Behaviour, 1(1), 11-24. https://doi.org/10.1016/
S1369-8478(98)00002-3
Peer, S., Muermann, A., & Sallinger, K. (2020). App-based
feedback on safety to novice drivers: learning and
monetary incentives. Transportation Research Part F:
Traffic Psychology and Behaviour, 71, 198-219.
https://doi.org/10.1016/j.trf.2020.04.005
Reason, J. T., Manstead, A. S. R., Stradling, S. G., Baxter,
J., & Campbell, K. (1990). Errors and violations on the
road – a real distinction. Ergonomics, 33(10/11), 1315-
1332.
State Insurance Regulatory Authority. (2019). NSW young
drivers telematics trial. Available: NSW-Young-
Drivers-Telematics-Trial.pdf. Accessed February 11,
2023.
Stevenson, M., Harris, A., Wijnands, J., & Mortimer, D.
(2021). The effect of telematic based feedback and
financial incentives on driving behaviour: a randomised
trial. Accident Analysis & Prevention, 159, 106278.
https://doi.org/10.1016/j.aap.2021.106278
Strayer, D. L., & Johnston, W. A. (2001). Driven to
distraction: dual-task studies of simulated driving and
conversing on a cellular telephone. Psychological
Science, 12(6), 462-466. https://doi.org/10.1111/1467-
9280.00386
Wijnands, J. S., Thompson, J., Aschwanden, G. D., &
Stevenson, M. (2018). Identifying behavioural change
among drivers using long short-term memory recurrent
neural networks. Transportation Research Part F:
Traffic Psychology and Behaviour, 53, 34-49.
White, K. M., Hyde, M. K., Walsh, S. P., & Watson, B.
(2010). Mobile phone use while driving: an
investigation of the beliefs influencing drivers’ hand-
free and hand-held mobile phone use. Transportation
Research Part F: Traffic Psychology and Behaviour,
13(1), 9-20. https://doi.org/10.1016/j.trf.2009.09.004
World Health Organisation (WHO). (2021). Road traffic
injuries. Geneva: World Health Organisation.
Available: https://www.who.int/news-room/fact-
sheets/detail/road-traffic-injuries. Accessed: February
11, 2023.
Yildirim, C., & Correia, A. P. (2015). Exploring the
dimensions of nomophobia: development and
validation of a self-reported questionnaire. Computers
in Human Behaviour, 49, 130-137.
Examination of the Relationship Between Smartphone Dependency and Driving Behaviour in Young Drivers: Preliminary Analysis
435
