
GIS Multicriteria Decision Analysis in Selecting the Optimal Location
for Urban Green Space: A Case Study of Zadar City
Rina Milošević
1
, Silvija Šiljeg
2
and Fran Domazetović
2
1
Croatian Geographical Society Zadar, Zadar, Croatia
2
Department of Geography, University of Zadar, Zadar, Croatia
Keywords: Urban Green Areas, GIS-MCDA, Optimal Location, City of Zadar.
Abstract: The urbanization process has proceeded rapidly in recent decades, resulting in the rapid transformation of
natural surfaces into impervious ones which has numerous impacts on the environment and human health.
Urban green spaces are recognized as a critical spatial component for maintaining ecological balance and
improving human mental and physical health. Therefore, the rational and even distribution of green spaces in
the city is particularly important, as they represent the most accessible natural environment for city dwellers.
The main objective of this study is to propose criteria and create a UGS suitability model (UGSSM) for the
urban area of Zadar. The model is generated by applying the GIS multicriteria decision analysis (MCDA) and
analytical hierarchical process (AHP). The model resulted in 580 ha of very high suitable (VHS) zones, mostly
located in the northwestern part of the city. However, only 0.05% (N=38) of VHS zones are consolidated
areas larger than 2 ha. Among VHS consolidated areas (>2 ha), the optimal one is depicted based on ownership
verification. This framework can be applied to other small cities with some minor modifications. For future
research, we suggest including residents with physical disabilities in the selection and landscaping of the
location.
1 INTRODUCTION
The process of urbanization has progressed rapidly in
recent decades and by United Nations projections will
inevitably continue to increase (UN, 2018). Urban
areas are already home to approximately half of the
world's population and most industrial activities
(Semeraro, 2021, The World Bank, 2020). Life in
highly urbanized areas affects residents’ living
rhythm, which has become faster and more stressful.
Additionally, urbanization affects the environment in
various ways transforming natural surfaces into
impervious such as roads, roofs, or parking lots. Some
direct effects are the occurrence of urban heat islands
(Song et al. 2015, Xu et al. 2022), pluvial floods, and
biodiversity loss (McDonald et al. 2013, Song et al.
2015).
To mitigate these negative effects the importance
of the natural environment is emphasized due to its
various benefits. Urban green spaces (UGS) are
considered one of the main components of urban
environments (Gupta et al. 2012) in the context of
recreation, social contributions (Nath et al., 2018),
health (Jennings & Bamkole, 2019), and
environmental outcomes (Hunter et al. 2019). It
maintains the urban ecological balance by affecting
the urban microclimate, purifying the air, and
reducing the risk of heat islands, soil erosion, and
pluvial or flash flooding (Hunter et al. 2019). UGS
positively impacts city residents' mental and physical
health by reducing stress, providing social contact,
enabling physical activity, and reducing exposure to
pollutants, noise, and excessive heat (Jennings &
Bamkole, 2019). They are also considered one of the
indicators of quality of life and housing in cities
(Šiljeg et al. 2018).
There are various definitions of UGS. According
to the Urban Green Belt project, UGS is defined as
any public or private open space covered with
vegetation, directly or indirectly accessible to users
(Šiljeg et al. 2018). The World Health Organization
defines it as any urban space that is covered with
vegetation and is crucial in promoting healthy living
conditions for all urban residents (WHO, 2017).
According to the ANGSt (Accessible Natural
Green Space standard) developed by Natural
England, green spaces are places where human
activities are not intense and natural processes prevail
Miloševi
´
c, R., Šiljeg, S. and Domazetovi
´
c, F.
GIS Multicriteria Decision Analysis in Selecting the Optimal Location for Urban Green Space: A Case Study of Zadar City.
DOI: 10.5220/0012031400003473
In Proceedings of the 9th International Conference on Geographical Information Systems Theory, Applications and Management (GISTAM 2023), pages 237-243
ISBN: 978-989-758-649-1; ISSN: 2184-500X
Copyright
c
2023 by SCITEPRESS – Science and Technology Publications, Lda. Under CC license (CC BY-NC-ND 4.0)
237

(English Nature, 2003, Šiljeg et al. 2020). This
standard emphasizes that green space is available
when it can be used without fees and time constraints.
In addition, the importance of size (area) and distance
of UGS are emphasized. The upgrade of this
methodology (ANGSt Plus) includes the concept of
connectivity, defined as the physical possibility of
access to green spaces. It also states the importance
of an even distribution of green spaces in urban areas
with respect to the socioeconomic characteristics of
the area.
The mentioned definitions are not encompassing
the importance of arrangement and mantainment the
UGS. However, to use a particular UGS for rest and
recreation some basic elements of accessibility must
be achieved. These include basic infrastructure such
as paths and benches, that do not significantly alter
the natural environment. This infrastructure is
especially important for people with physical
disabilities who often do not use the benefits of UGS
due to its lack of adaptation. The rationality and
equity of UGS distribution are particularly important
nowadays as the UGS is the most accessible natural
environment for city residents (Semeraro, 2021).
However, UGS management can be very challenging,
especially in densely populated city areas (Haaland et
al. 2015), and is often affected by the specific
characteristics of each urban area (Linh et al. 2022).
Some of the studies of UGS are focused on the
ecological suitability of the location (Li et al., 2018;
Linh et al. 2022). For the big cities, several general
criteria are typically used. However, for smaller urban
areas, the selected criteria are more specific to their
locations, involving their individual distances and
infrastructure (WHO, 2017; Linh et al. 2022).
Therefore, the main goal of this study is to
determine the optimal location for UGS landscaping
in the city of Zadar. The mentioned study case is
depicted because Šiljeg et al. 2018 performed a UGS
accessibility analysis and pointed out the lack of
landscaped UGS in the city. The multiple-criteria
decision analysis (MCDA), and AHP process were
used to determine additional potential locations for
UGSs arrangement.
2 STUDY AREA
Zadar (25 km²) is the administrative center of Zadar
county (Figure 1). In the last decades, Zadar is
characterized by intense urban sprawl followed by an
increase in urban population due to dynamic and
strong development as a regional center (Magaš,
1991, Magaš, 2011). At the latest census (2021), the
total population was 75,082 (DZS, 2021). Recent
economic and demographic trends are also reflected
in urban physiognomy. For example, the old city
center (Peninsula) is predominantly the central
business district, while peripheral parts (Novi
Bokanjac, Dračevac, Smiljevac) are now having a
residential role (Graovac, 2004). Rapid urbanization
also resulted in an increase in impervious surfaces
and a lack of UGS (Šiljeg et al. 2018).
Figure 1: Study area.
3 MATERIALS AND METHODS
The main goal of this study is to suggest criteria and
create the UGS suitability model (UGSSM) for the
urban area of Zadar. To create the model GIS-MCDA
and Analytical hierarchical process (AHP) were
used. Since the Zadar is a smaller urban area, the
selected criteria are specific to the research area
involving individual distances and infrastructure.
GISTAM 2023 - 9th International Conference on Geographical Information Systems Theory, Applications and Management
238
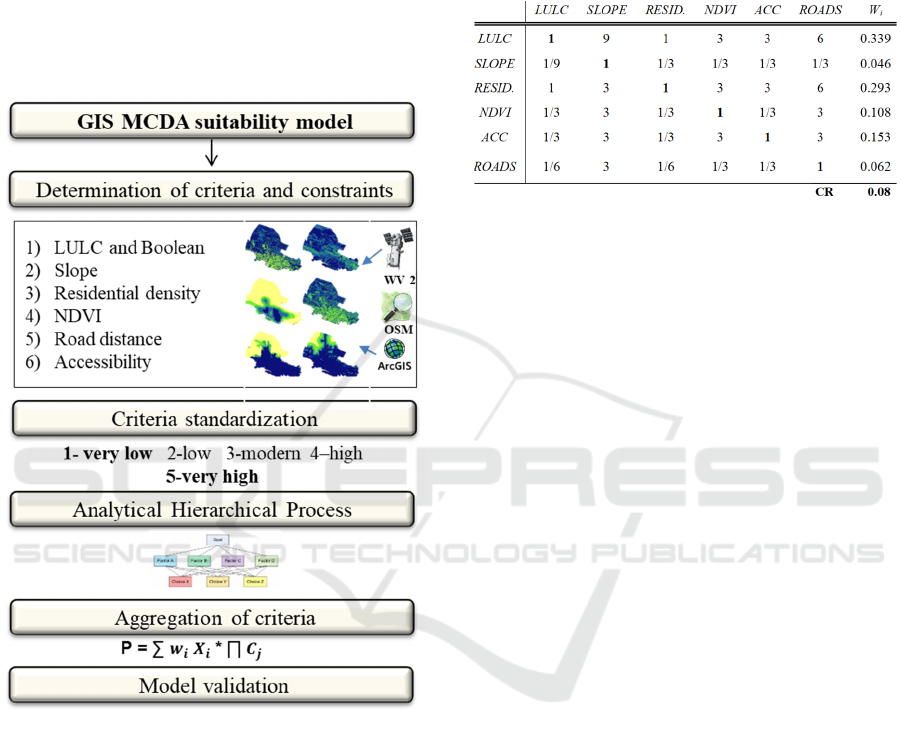
3.1 GIS - MCDA
The GIS-MCDA is one of the most popular
procedures used to estimate the suitability of land for
various purposes (Modica et al. 2014). The procedure
consists of 1) identification of the problem and
defining the goal, 2) criteria selection, 3) criteria
standardization, 4) calculation of weight coefficients,
5) criteria aggregation, and 6) model validation
(Domazetović et al. 2019) (Figure 2).
Figure 2: Methodology workflow.
To create UGSSM, criteria were derived in the
ArcGIS environment using Network Analyst (Service
area), Spatial Analyst (Slope, Point Density, Raster
Calculator), and Analysis tool (Proximity - Buffer).
Input data include WorldView 2 (WV-2)
multispectral (MS) imagery and OpenStreetMap
(OSM) data. The land cover model (LULC) is
generated from the WV-2 MS imagery, using the
Geographic Object-Based Image Analysis
(GEOBIA) and Support Vector Machine (SVM)
algorithm.
To be comparable, all derived criteria (except
Boolean) were standardized to scale from 1 to 5 (1 –
very low suitability, 5 – very high suitability) using
the Jenks method. Boolean criteria were standardized
to a binary scale (0-false and 1-true). An AHP was
used to rank criteria according to their level of
suitability and to calculate the weighting coefficient
for each (W
i
). For the matrix validation consistency
ratio was calculated (CR) (Figure 3).
Figure 3: Pairwaise matrix (AHP).
The following formula is used to aggregate the
criteria (Eastman 1999):
P = ∑ 𝑤𝑖 𝑋𝑖 * ∏ 𝐶𝑗
where: P = suitability 𝐶𝑗 = restriction 𝑤𝑖 =
weighted coefficient ∑ =sum of weighted criteria; ∏
= sum of restrictions (1 – suitable, 0 – unsuitable) 𝑋𝑖
= criteria value.
3.2 Selection of Optimal Location
The generated GIS-MCDA suggests the most suitable
location for UGS based on the selected criteria.
However, verifying public availability, i.e.,
ownership of potential UGS is necessary. Verification
of ownership is a complex process due to the large
number of cadastral parcels in the Zadar. Therefore,
ownership is verified only for the very high UGS
suitability classes. The ownership verification is
performed by overlaying the GIS-MCDA model with
the official cadastral parcel map prepared by the State
Geodetic Administration (DGU). In addition, the
UGSs with a larger area have priority in the selection
of the optimal site.
4 RESULTS AND DISCUSSION
4.1 Criteria Selection
To select the optimal location for UGS seven criteria
were used: land cover model (LULC), slope,
residential object density, accessibility, road distance,
NDVI, and constraints (Boolean).
GIS Multicriteria Decision Analysis in Selecting the Optimal Location for Urban Green Space: A Case Study of Zadar City
239
4.1.1 LULC and Boolean
Land cover has an important role in the selection of
locations for UGSs as it determines the feasibility of
UGSs (Linh et al. 2022). Therefore, it is ranked as the
most important criterion in selecting the location for
UGS in the urban area of Zadar.
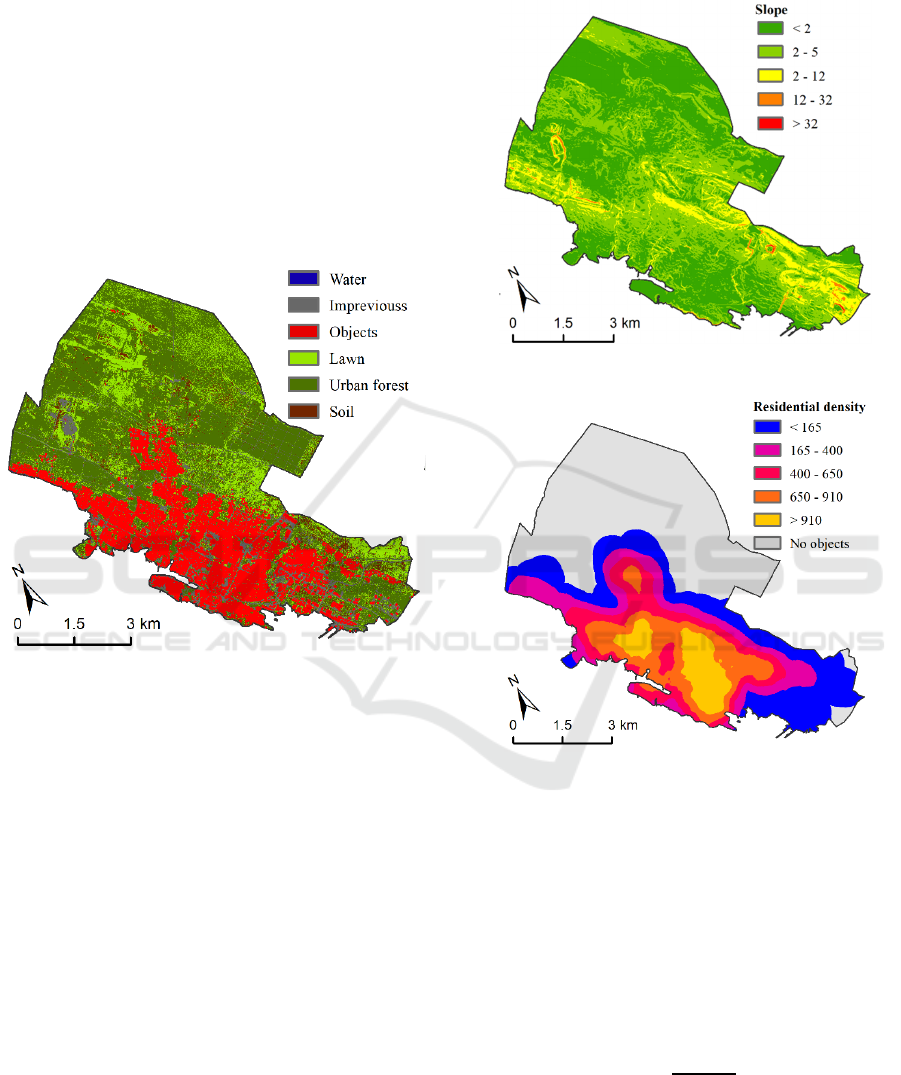
The land cover model consists of a total of eight
classes (Figure 4). The existing UGS such as lawns
and forest vegetation were rated as the most suitable
classes for arrangement. The Boolean criterium is
based on LULC and all build-up areas (impervious
and objects), bare land (soil), and water surfaces are
classified as constraints.
Figure 4: Land cover model (LULC).
4.1.2 Slope
Generally, low-incline areas are considered more
appropriate for the UGS as it will determine the soil
characteristics and rate of erosion (Sharma et al.
2022). Accordingly, gentle slopes are classified as
the most suitable for UGS landscaping. Although
the most of urban area of Zadar is characterized by
a gentle slope, the most suitable zones are located in
the north-western part of the city (Figure 3). Ovo je
dio grada
4.1.3 Residential Objects Density
The residential objects’ density represents the
spatial distribution of the population. To make UGS
accessible to as many people as possible, areas with
a higher density of residential buildings were
assessed as more suitable. The highest density of
residential buildings is in the central part of the city
(Figure XX), while the density decreases towards
the outskirts where most of the arable agricultural
areas are located.
Figure 5: Slope.
Figure 6: Residential objects density.
4.1.4 NDVI
NDVI represents the vegetation’s health and helps
distinguish areas with poorer vegetation health from
areas with healthier and dense vegetation. The higher
values of NDVI indicate more suitable locations for
UGS (Linh et al. 2022). In the area with an NDVI
value lower than 0.1 UGS is deemed inappropriate.
NDVI was extracted from the multispectral WV2
satellite image using the following formula:
𝑁𝐷𝑉𝐼
(1)
GISTAM 2023 - 9th International Conference on Geographical Information Systems Theory, Applications and Management
240
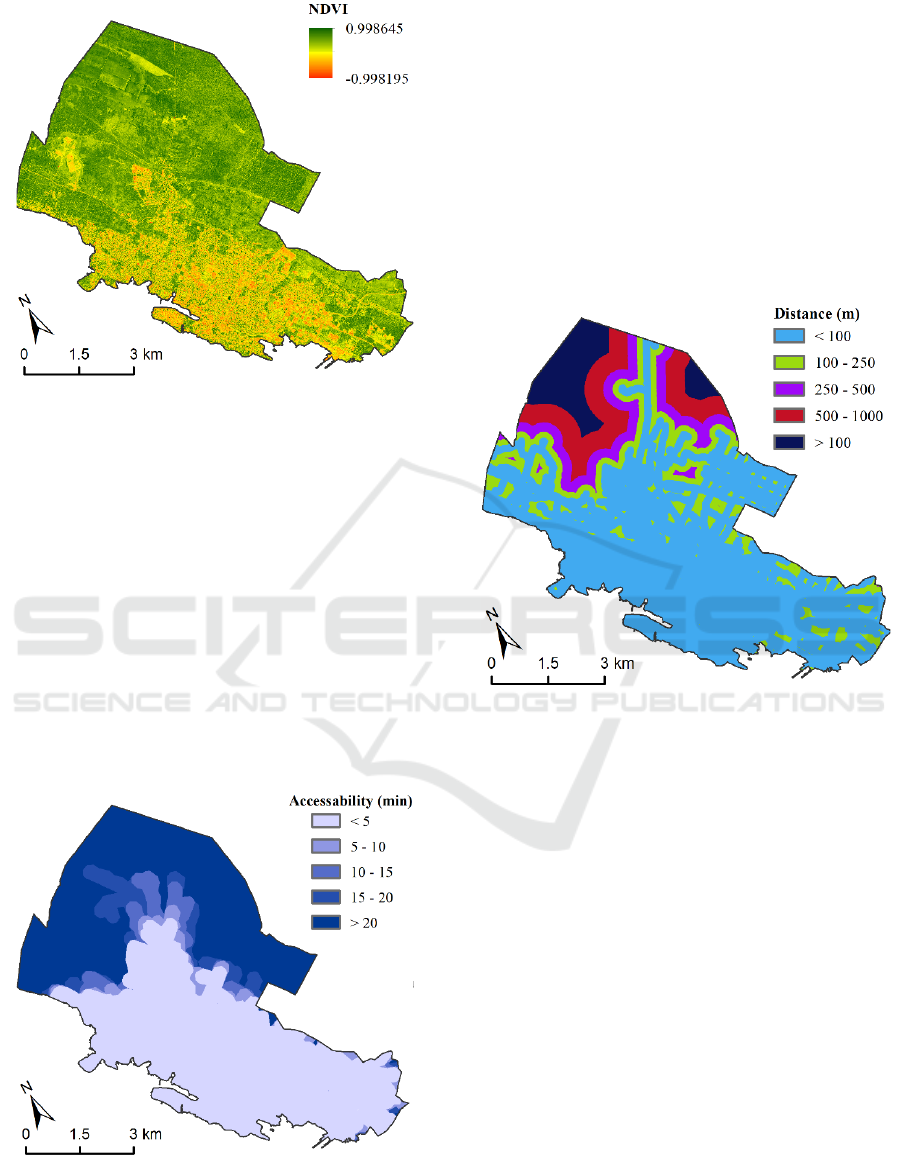
Figure 7: NDVI.
4.1.5 Accessibility
The accessibility refers to the amount of time required
to get from the residential buildings to the first UGS.
According to European Environment Agency (EEA),
an individual should have access to a green space
within 15 min (walking distance) of their residence
(David et al., 1995). However, this distance differs
depending on the region (Lieh, 2022). Using the
Network Analyst Service area tool five zones of
accessibility were created for Zadar urban area: less
than 5 minutes, 5 - 10, 10 - 15, 15- 20, and more than
20 minutes (walking) from residential buildings. Due
to the dense road network most of the urban area of
Zadar is accessible within 5 minutes (Figure 8).
Figure 8: Accessibility from residential units (minutes).
4.1.6 Distance to Main Roads
The distance from roads is important regarding
people’s ability to easily access UGS areas (Linh et
al. 2022). In this study, main roads include all road
infrastructure together with pedestrian and bicycle
routes. Macadam roads on the outskirts of the city
were excluded from the analysis due to inaccessibility
and poor maintenance. Using the Multiple buffer tool
five classes of road distance are derived: 0-100 m,
100-250 m, 250-500 m, 500-1000 m, and more than
1000 m. Most of the city area is within less than 100
meters distance from roads (Figure 9).
Figure 9: Road distance.
4.1.7 Urban Green Spaces Suitability Model
GIS-MCDA resulted in a total of 64,128 polygons
representing the most suitable UGS (5- very high
suitability (VHS)) (Figure 7). The total area of VHS
is 558 ha.
VHS land classes are mostly located in the
western part of the city, while the very low suitable
classes are predominately located in the old city
centrum. High-suitable classes are located in the
eastern part of the city, near the industrial zone
“Gaženica”. Arranging UGS in this part of the city
would maintain the ecological balance. However,
UGS in this part of the city is not accessible from
many residential objects within 5 or 10 minutes.
4.1.8 Selection of Optimal Location
To select the optimal location two additional criteria
were included: size and ownership. From the total
number of generated VHS classes, only polygons
(N=38) with an area higher than 2 hectares were
GIS Multicriteria Decision Analysis in Selecting the Optimal Location for Urban Green Space: A Case Study of Zadar City
241
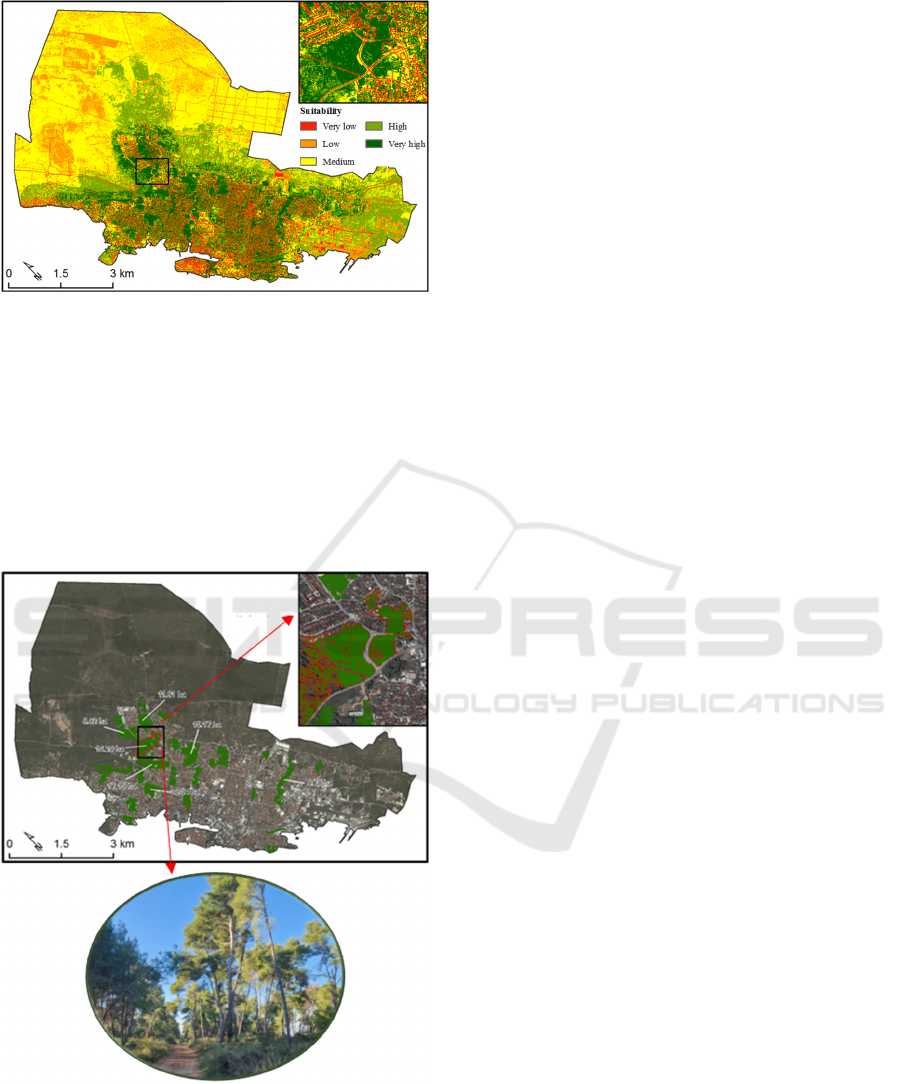
Figure 10: GIS-MCDA suitability model.
extracted (Figure 8). This criterium is included
because of ANGst’s suggestion: each resident should
have at least one UGS of more than 2 ha in size at a
maximum distance of 300 m. Based on the ownership
verification, it appears that almost all very high
suitability land classes are privately owned and
cannot be used by the public. Only one UGS is
property of Zadar city and can potentially be
landscaped (Figure 11).
Figure 11: Extracted UGS (> 2 ha and very high suitable)
and selected optimal location for potential UGS in Zadar.
5 CONCLUSIONS
This paper represents an attempt to improve UGS
accessibility in small urban areas by suggesting
criteria and conducting the GIS-MCDA process. The
research has shown that GIS-MCDA is an efficient
technique that can be used in urban green
infrastructure planning and related fields. Created
suitability model resulted in several zones of very
high suitability. Among these zones, the optimal one
is depicted based on ownership verification. For
future research, we suggest including residents in the
selection of the location. To gather information about
their needs and preferences it is recommendable to
conduct a public perception survey. In addition, it is
particularly important to include people with
disabilities in research to recognize the measures that
can be taken to improve accessibility. With some
minor modifications, this framework can be applied
to other small cities. The results of this research could
be useful to decision-makers in developing land use
plans.
ACKNOWLEDGEMENTS
This paper is conducted as part of DORAS project
UP.04.2.1.11.0172. Non-refundable funds were
awarded by European Social Fund (85%), as well as
the State budget of the Republic of Croatia (15%). For
more info on funds, visit www.strukturnifondovi.hr
and www.esf.hr
REFERENCES
Bell, D., & Jayne, M. (2006). Conceptualizing small cities.
In Small Cities (pp. 1-18). Routledge.
David, S. Europe’s Environment—The Dobris Assessment;
Philippe, B., Ed.; European Communities: Brussels,
Belgium, 1995; ISBN 92-826-5409-5.
David, S. Europe’s Environment—The Dobris Assessment;
Philippe, B., Ed.; European Communities: Brussels,
Belgium, 1995; ISBN 92-826-5409-5.
Domazetović, F., Šiljeg, A., Lončar, N., & Marić, I. (2019).
Development of automated multicriteria GIS analysis
of gully erosion susceptibility. Applied geography, 112,
102083.
Eastman, J. R. (1999). Multi-criteria evaluation and GIS.
Geographical information systems, 1(1), 493-502.
English Nature (2003). Providing accessible natural
greenspaces in towns and cities: a practical guide to
assessing the resources and implementing local
standards for provision, UK.
GISTAM 2023 - 9th International Conference on Geographical Information Systems Theory, Applications and Management
242

Graovac, V. (2004). Populacijski razvoj Zadra. Geoadria,
9(1), 51-72.
Gupta, K., Kumar, P., Pathan, S. K., & Sharma, K. P. (2012).
Urban Neighborhood Green Index–A measure of green
spaces in urban areas. Landscape and urban planning,
105(3), 325-335.
Haaland, C.; van den Bosch, C.K. Challenges and strategies
for urban green-space planning in cities undergoing
densification: A review. Urban For. Urban Green. 2015,
14, 760–771.
Handy, S., Heinen, E., & Krizek, K. (2012). Cycling in
small cities. City cycling, 257-286.
Hunter, R. F., Cleland, C., Cleary, A., Droomers, M.,
Wheeler, B. W., Sinnett, D., ... & Braubach, M. (2019).
Environmental, health, wellbeing, social and equity
effects of urban green space interventions: A meta-
narrative evidence synthesis. Environment international,
130, 104923.
Jennings, V., & Bamkole, O. (2019). The relationship
between social cohesion and urban green space: An
avenue for health promotion. International journal of
environmental research and public health, 16(3), 452.
Li, Z., Fan, Z., & Shen, S. (2018). Urban green space
suitability evaluation based on the AHP-CV combined
weight method: A case study of Fuping county, China.
Sustainability, 10(8), 2656.
Linh, N. H. K., Tung, P. G., Chuong, H. V., Ngoc, N. B., &
Phuong, T. T. (2022). The Application of Geographical
Information Systems and the Analytic Hierarchy
Process in Selecting Sustainable Areas for Urban Green
Spaces: A Case Study in Hue City, Vietnam. Climate,
10(6), 82.
Magaš, D. (1991). Neke promeje u gradskim naseljima
zadarske regije u razdoblju 1857.-1971. godine. Radovi
Zavoda za povijesne znanosti HAZU u Zadru, (33),
239-258.
Magaš, D. (2011). Koncept teritorijalnog ustroja Jadranske
Hrvatske. Geoadria, 16(2), 211-236.
McDonald, R. I., Marcotullio, P. J., & Güneralp, B. (2013).
Urbanization and global trends in biodiversity and
ecosystem services. Urbanization, biodiversity and
ecosystem services: challenges and opportunities: a
global assessment, 31-52.
Modica, G., Laudari, L., Barreca, F., & Fichera, C. R.
(2014). A GIS-MCDA based model for the suitability
evaluation of traditional grape varieties: the case-study
of ‘Mantonico'Grape (Calabria, Italy). International
Journal of Agricultural and Environmental Information
Systems (IJAEIS), 5(3), 1-16.
Nath, T. K., Han, S. S. Z., & Lechner, A. M. (2018). Urban
green space and well-being in Kuala Lumpur, Malaysia.
Urban Forestry & Urban Greening, 36, 34-41.
Semeraro, T., Scarano, A., Buccolieri, R., Santino, A., &
Aarrevaara, E. (2021). Planning of urban green spaces:
An ecological perspective on human benefits. Land,
10(2), 105.
Sharma, Richa, Pradhan, Lolita, Kumari, Maya and
Bhattacharya, Prodyut. "Urban Green Space Planning
and Development in Urban Cities Using Geospatial
Technology: A Case Study of Noida" Journal of
Landscape Ecology, vol.15, no.1, 2022, pp.27-46.
https://doi.org/10.2478/jlecol-2022-0002
Šiljeg, S., Marić, I., Nikolić, G., & Šiljeg, A. (2018).
Accessibility analysis of urban green spaces in the
settlement of Zadar in Croatia. Šumarski list, 142(9-10),
487-496.
Šiljeg, S., Milosevic, R., & Vilic, E. (2020). Multiscale GIS
based Analysis of Urban Green Spaces (UGS)
Accessibility: Case Study of Sisak (Croatia). In
GISTAM (pp. 240-245).
Song, Y., Li, F., Wang, X., Xu, C., Zhang, J., Liu, X., &
Zhang, H. (2015). The effects of urban impervious
surfaces on eco-physiological characteristics of Ginkgo
biloba: A case study from Beijing, China. Urban
Forestry & Urban Greening, 14(4), 1102-1109.
The World Bank. Urban Population. Available online:
https://data.worldbank.org/indicator/SP.URB.TOTL.I
N.ZS (accessed on 19 July 2020).
United Nations (2018). World population to reach 9.7
billion by 2050 - UN, retrieved from (URL 4
https://www.dw.com/en/world-population-to-reach 97-
billion-by-2050-un/a-49241728) Accessed at 02
January 2020.
World Health Organization. Urban Green Spaces: A Brief
for Action; World Health Organization: Copenhagen,
Denmark, 2017
Xu, C., Chen, G., Huang, Q., Su, M., Rong, Q., Yue, W., &
Haase, D. (2022). Can improving the spatial equity of
urban green space mitigate the effect of urban heat
islands? An empirical study. Science of The Total
Environment, 841, 156687.
GIS Multicriteria Decision Analysis in Selecting the Optimal Location for Urban Green Space: A Case Study of Zadar City
243
