
An Investigation of Deep-Learned Features for Classifying Radiographic
Images of COVID-19
Pedro Lucas Miguel
1
, Adriano Mauro Cansian
1 a
, Guilherme Botazzo Rozendo
1
,
Giuliano Cardozo Medalha
2
, Marcelo Zanchetta do Nascimento
3 b
and Leandro Alves Neves
1 c
1
Department of Computer Science and Statistics (DCCE), S
˜
ao Paulo State University (UNESP), Rua Crist
´
ov
˜
ao Colombo,
2265, 15054-000, S
˜
ao Jos
´
e do Rio Preto-SP, Brazil
2
WZTECH NETWORKS, Avenida Romeu Strazzi (room 503-B), 325, 15084-010, S
˜
ao Jos
´
e do Rio Preto-SP, Brazil
3
Faculty of Computer Science (FACOM), Federal University of Uberl
ˆ
andia (UFU), Avenida Jo
˜
ao Naves de
´
Avila 2121,
Bl.B, 38400-902, Uberl
ˆ
andia-MG, Brazil
Keywords:
Radiographic Images, COVID-19, Convolutional Neural Networks, Deep-Learned Features, RelieF.
Abstract:
In this proposal, a study based on deep-learned features via transfer learning was developed to obtain a set
of features and techniques for pattern recognition in the context of COVID-19 images. The proposal was
based on the ResNet-50, DenseNet-201 and EfficientNet-b0 deep-learning models. In this work, the chosen
layer for analysis was the avg pool layer from each model, with 2048 features from the ResNet-50, 1920
features from the DenseNet0201 and 1280 obtained features from the EfficientNet-b0. The most relevant
descriptors were defined for the classification process, applying the ReliefF algorithm and two classification
strategies: individually applied classifiers and employed an ensemble of classifiers using the score-level fusion
approach. Thus, the two best combinations were identified, both using the DenseNet-201 model with the
same subset of features. The first combination was defined via the SMO classifier (accuracy of 98.38%)
and the second via the ensemble strategy (accuracy of 97.89%). The feature subset was composed of only
210 descriptors, representing only 10% of the original set. The strategies and information presented here are
relevant contributions for the specialists interested in the study and development of computer-aided diagnosis
in COVID-19 images.
1 INTRODUCTION
The analysis of radiographic images is one of the
stages widely used in medicine to define diagnostics
and prognostics for different diseases. For instance,
when the investigation of COVID-19 is considered,
radiographic images were commonly used to identify
the possible patterns of this disease. Thus, computa-
tional systems can be developed and applied to sup-
port specialists in this process (Organization, 2023),
with the definition and classification of the main de-
scriptors. This type of application has been widely in-
vestigated to define a computer-aided diagnosis, with
multiple methodologies (Su et al., 2022; Song et al.,
2022; Deb et al., 2022; Tuncer et al., 2020).
The process of analyzing radiographic images us-
a
https://orcid.org/0000-0003-4494-1454
b
https://orcid.org/0000-0003-3537-0178
c
https://orcid.org/0000-0001-8580-7054
ing convolutional neural networks (CNN) is a widely
explored issue in the field of image processing, with
important applications in the study of COVID-19
images. In this context, (Kedia et al., 2021) pre-
sented a CNN named CoVNet-19. This model was
obtained using various techniques, such as transfer
learning and an ensemble strategy, providing an accu-
racy of 99.71% in the context of radiographic images.
Furthermore, another strategy presented by (Ashour
et al., 2021) involved an ensemble method, with mod-
els based on bag-of-features. The choice of this type
of model considered the variations and spatial orienta-
tions of the images. This proposal was able to provide
an accuracy of 98.60% in the classification of radio-
graphic images of lung regions. Finally, the authors
in (Deb et al., 2022) used an ensemble with multi-
ple pre-trained models, such as VGGNet, GoogleNet,
DenseNet and NASNet and provided an accuracy of
98.58%.
Miguel, P., Cansian, A., Rozendo, G., Medalha, G., Zanchetta do Nascimento, M. and Neves, L.
An Investigation of Deep-Learned Features for Classifying Radiographic Images of COVID-19.
DOI: 10.5220/0012038500003467
In Proceedings of the 25th International Conference on Enterprise Information Systems (ICEIS 2023) - Volume 1, pages 675-682
ISBN: 978-989-758-648-4; ISSN: 2184-4992
Copyright
c
2023 by SCITEPRESS – Science and Technology Publications, Lda. Under CC license (CC BY-NC-ND 4.0)
675

Despite the existence of several studies that pro-
posed specific networks to solve the problem of clas-
sification in focus, other studies also address the use
of already consolidated networks. In (Walvekar et al.,
2020), the authors proposed an approach that em-
ployed a ResNet-50 model which was pre-trained on
the ImageNet dataset with transfer learning. The ex-
periments were defined via a public dataset (Cohen
et al., 2020), with 359 radiographic images from the
lung region that indicated the presence of pneumonia
caused or not by COVID-19. This proposal was able
to indicate an accuracy of 96.23%. The study pre-
sented by (Shamila Ebenezer et al., 2022) involved
the EfficientNet-b0 model with enhanced images via
Laplace algorithms and wavelet transform. The main
goal was to verify the impact of these adjustments
on the complete training of the CNN models. This
approach provided an accuracy of 94.56%, consid-
ering radiographic images of two classes infected by
COVID-19 and not infected with this disease.
In this context, there were few studies based on
a detailed analysis of deep features, a fact that moti-
vated the development of this proposal. For instance,
the model presented by (Tuncer et al., 2020) consid-
ered a strategy responsible for defining features called
residual exemplar local binary pattern. The features
were ranked via the RelieF algorithm and classified
with multiple methods. This proposal achieved an ac-
curacy of 100% through the SVM classifier, exploring
representative radiographic images of Covid-19 and
healthy. The study proposed by (Rajpal et al., 2021)
used the ResNet-50 model to extract a subset of the
most relevant features, considering the 2048 attributes
present in the avg pool layer. The authors manu-
ally evaluated a group of 252 features. This subset
was studied via principal component analysis (PCA).
A new subset was defined with the 64 most impor-
tant attributes. Finally, these features were reduced
again after being used as input to a feed-forward net-
work, which selected only 16 features. The model
provided an accuracy of 94.40%, considering a total
of four classes: viral pneumonia; bacterial pneumo-
nia; COVID-19 and not infected.
In this study, a proposal based on deep-learned
features via transfer learning is defined to indicate
the main combinations of attributes and techniques
for the classification and pattern recognition in ra-
diographic images of COVID-19. The presented
approach explores three different CNN models for
COVID-19 images. The corresponding deep-learned
features were obtained, and a ranking method was
applied to maximize the classification performance.
The analysis was defined via an ensemble classifi-
cation, considering the score-level fusion approach.
This proposal allows for identifying the main asso-
ciations with competitive results concerning the spe-
cialized literature. The main contributions presented
here are:
• A strategy capable of identifying the main deep-
learned features, with competitive results con-
cerning consolidated and widely explored meth-
ods in the context of COVID-19;
• A model capable of identifying the main combi-
nations via a reduced number of features;
• Indications of associations and conditions for the
improvement of computer-aided diagnosis with a
focus on the analysis of radiographic images of
COVID-19.
2 METHODOLOGY
The proposed method was divided into three steps.
The first step was defined to extract the deep-learned
features, exploring specific layers of relevant CNN
models. The second stage was proposed to compose
and select the most relevant features. Finally, the third
step (analysis and knowledge extraction) was indi-
cated to guarantee the analysis of the selected fea-
tures through two experiments: predictions through
classifiers applied individually to each set of features;
results via an ensemble classification process. An
overview of the proposal is shown in Figure 1.
2.1 Dataset
This investigation explored representative radio-
graphic images of COVID-19 that were obtained
through a public dataset (Cohen et al., 2020). This
dataset consists of images from different public
sources. It is important to highlight that this dataset
is considered dynamic, therefore, the number of sam-
ples that represent each class, as well as the type
of those, are updated frequently. The used version
for this study explored a total of 2.040 images di-
vided into two classes: Healthy with 1602 samples
and COVID-19 with 438 samples. It is important to
note that the samples belonging to the healthy class
are people who have been properly tested as non-
carriers of COVID-19. Also, the images are repre-
sentative of segmented regions, where it is possible
to observe only the patient’s lungs. In addition, the
images have multiple sizes, therefore, in the training
phase of the fully connected layers of each model, the
images were resized to 224 pixels of height and 224
pixels of width. Figure 2 illustrates available images
in the dataset explored here.
ICEIS 2023 - 25th International Conference on Enterprise Information Systems
676

Figure 1: An overview of the proposed method for analyz-
ing COVID-19 images.
Figure 2: Illustration of images explored in our study from
the dataset presented by (Cohen et al., 2020).
2.2 Step 1: Feature Extraction
The COVID-19 images were analyzed through three
deep-learning models. The chosen architectures were
a residual neural network with 50 layers (ResNet-
50), dense convolutional neural network with 201
layers (DenseNet-201) and the EfficientNet baseline
(EfficientNet-b0) (He et al., 2016; Huang et al., 2016;
Tan and Le, 2020).
2.2.1 Selected Layers
In this investigation, the features were obtained from
the ResNet-50, DenseNet-201, and EfficientNet-b0
neural networks pre-trained on the ImageNet dataset
(Deng et al., 2009). The adopted strategy in this
proposal considered the indications presented by
(Pereira dos Santos and Antonelli Ponti, 2019). In
this case, the convolutional features from the initial
layers were capable to bring local information about
the analyzed images, like low levels of forms, bor-
ders, and colors. While features from the last layers
tend to provide global descriptors. Thus, the convolu-
tional attributes obtained from the networks were iso-
lated through a strategy that allows the storing of the
output from the layers into auxiliary structures. These
structures were used as input to the feature selection
method, capable of identifying the most relevant and
generalizable feature sets. In this study, the avg pool
layer of each network was selected for the analyses,
considering that this layer can provide contributions
related to the local and global information of the im-
ages. A summary of the number of features used in
our proposal is illustrated in Table 1, considering each
layer here explored.
Table 1: Number of features of each avg pool layer for each
network model.
Network Number of features
ResNet-50 2048
DenseNet-201 1920
EfficientNet-b0 1280
2.3 Step 2: Definition of the Most
Relevant Features
The convolutional attributes were defined through n-
dimensional matrices called N
i
[...], where i represents
one of the layers under investigation. Each column
in the N
i
matrix was sequentially sorted into feature
vectors K
i
[...], where the number of elements in N
i
is
equal to the number of elements in K
i
. From K
i
, the
RelieF algorithm was applied to rank the most rele-
vant deep features. Thus, each set K
i
was distributed
into subsets F in relation to j best-ranked attributes.
It is important to highlight that each subset was de-
fined through different cutoff points, considering an
approach successfully applied to classify colorectal
histological images (Ribeiro et al., 2019). However,
our proposal identified the most relevant subset in a
wider attribute space (with the first 250 best-ranked
attributes), mainly due to the differences present in
the context investigated here, for instance, with more
attributes and samples. Thus, the initial subset was
defined with j = 10, being incremented in steps of
10 attributes. Moreover, this limited number of deep
features was established to obtain optimized solutions
(with a reduced number of features) in order to mini-
mize the presence of overfitting.
An Investigation of Deep-Learned Features for Classifying Radiographic Images of COVID-19
677

2.4 Step 3: Analysis and Knowledge
Extraction
This step considered two experiments: The first ex-
periment was defined to investigate the discrimina-
tive capabilities of the deep-learned features through
multiple classifiers (individually applied). The used
classifiers were: function based, such as support vec-
tor machine (SVM) and sequential minimal optimiza-
tion (SMO) (Vapnik, 1963; Platt, 1998); lazy learning
based, such as locally weighted learning (LWL) and
instance based k (IBk) (Frank et al., 2003; Atkeson
et al., 1996); and decision tree based, such as ran-
dom forest (RaF) and random tree (RaT) (Breiman,
2001; Frank and Kirkby, 2023). The goal of this anal-
ysis was to obtain capable models in order to obtain
the best performances, with the lowest number of fea-
tures, that could contribute to the comprehension of
the explored context.
The second experiment was addressed to complete
the analyses previously indicated, exploring an en-
semble strategy with the classifiers used in the first
step. The adopted approach was a score-level fusion
in order to explore the strongest points of each clas-
sifier (Ross and Nandakumar, 2009). As in the first
experiment, the 250 deep features were analyzed with
sets arranged for every ten features.
In addition, a 10-fold cross-validation method was
applied to validate our experiments. Finally, the re-
sults were verified through different metrics, such as
accuracy (ACC), F-measure and the area under the re-
ceiver operating characteristic curve (AUC).
2.4.1 Development Environment
Both the algorithm responsible to obtain the deep-
learned features, and the algorithm to explore the
ResNet, DenseNet, and EfficientNet models were de-
veloped in the Python language. Especially, to ex-
plore the models, the Pytorch framework was used
(Paszke et al., 2019). This framework provides the
ResNet-50, DenseNet-201, and EfficientNet-b0 previ-
ously coded and trained on the ImageNet dataset, con-
sidering the specifications presented by the authors of
each model (He et al., 2016; Huang et al., 2016; Tan
and Le, 2020).
To test the performance of each network model,
the framework Pytorch Ignite was also used (Fomin
et al., 2020), being so responsible for the training of
the last fully connected layer of each model. The pro-
posal was realized in a notebook with an Intel Core i5-
10210U, 16 GB of RAM, NVIDIA MX 110 graphics
card, and the Windows 11 operating system. Finally,
the Weka 3 package was used to classify the deep-
learned features, as well as to obtain all the metrics
used by this project (Witten et al., 2011; Hall et al.,
2009).
3 RESULTS
The approach was applied to analyze radiographic
images of COVID-19 with two experiments via the
deep-learned features of avg pool layers, ResNet-50,
DenseNet-201 and EfficientNet-b0 models. Thus,
taking into account the accuracy metric as an initial
reference, Figure 3 shows the obtained results with
the ensemble of classifiers.
Figure 3: ACC values (%) for each subset of features,
exploring the ensemble of classifiers and avg pool layers
(ReseNet-50, DenseNet-201, and EfficientNet-b0).
From the obtained results in the different com-
positions of deep features, it was noticed that the
DenseNet-201 model indicated the best performance,
with a subset of 210 attributes and an ACC value of
97.89%. In this case, the F-measure value was 0.979
and the AUC rate was 0.9941 (a performance close
to that of an ideal system). These results are interest-
ing and indicate an important contribution of the pro-
posed methodology, since it was possible to identify
a combination of techniques capable of providing an
acceptable solution with only 10.94% of the original
features, avoiding overfitting in this model. Also, this
combination indicated a class distinction capability.
The second experiment was defined with a combi-
nation of the deep-learned features via SVM, SMO,
LWL, IBK, RaF and RaT classifiers, with perfor-
mances obtained individually. The results are pre-
sented in Figures 4, 5, and 6, considering the ResNet-
50, DenseNet-201 and EfficientNet-b0 models, re-
spectively.
Taking into account the results in Figure 4
(ResNet-50 model), the SMO classifier in combina-
ICEIS 2023 - 25th International Conference on Enterprise Information Systems
678
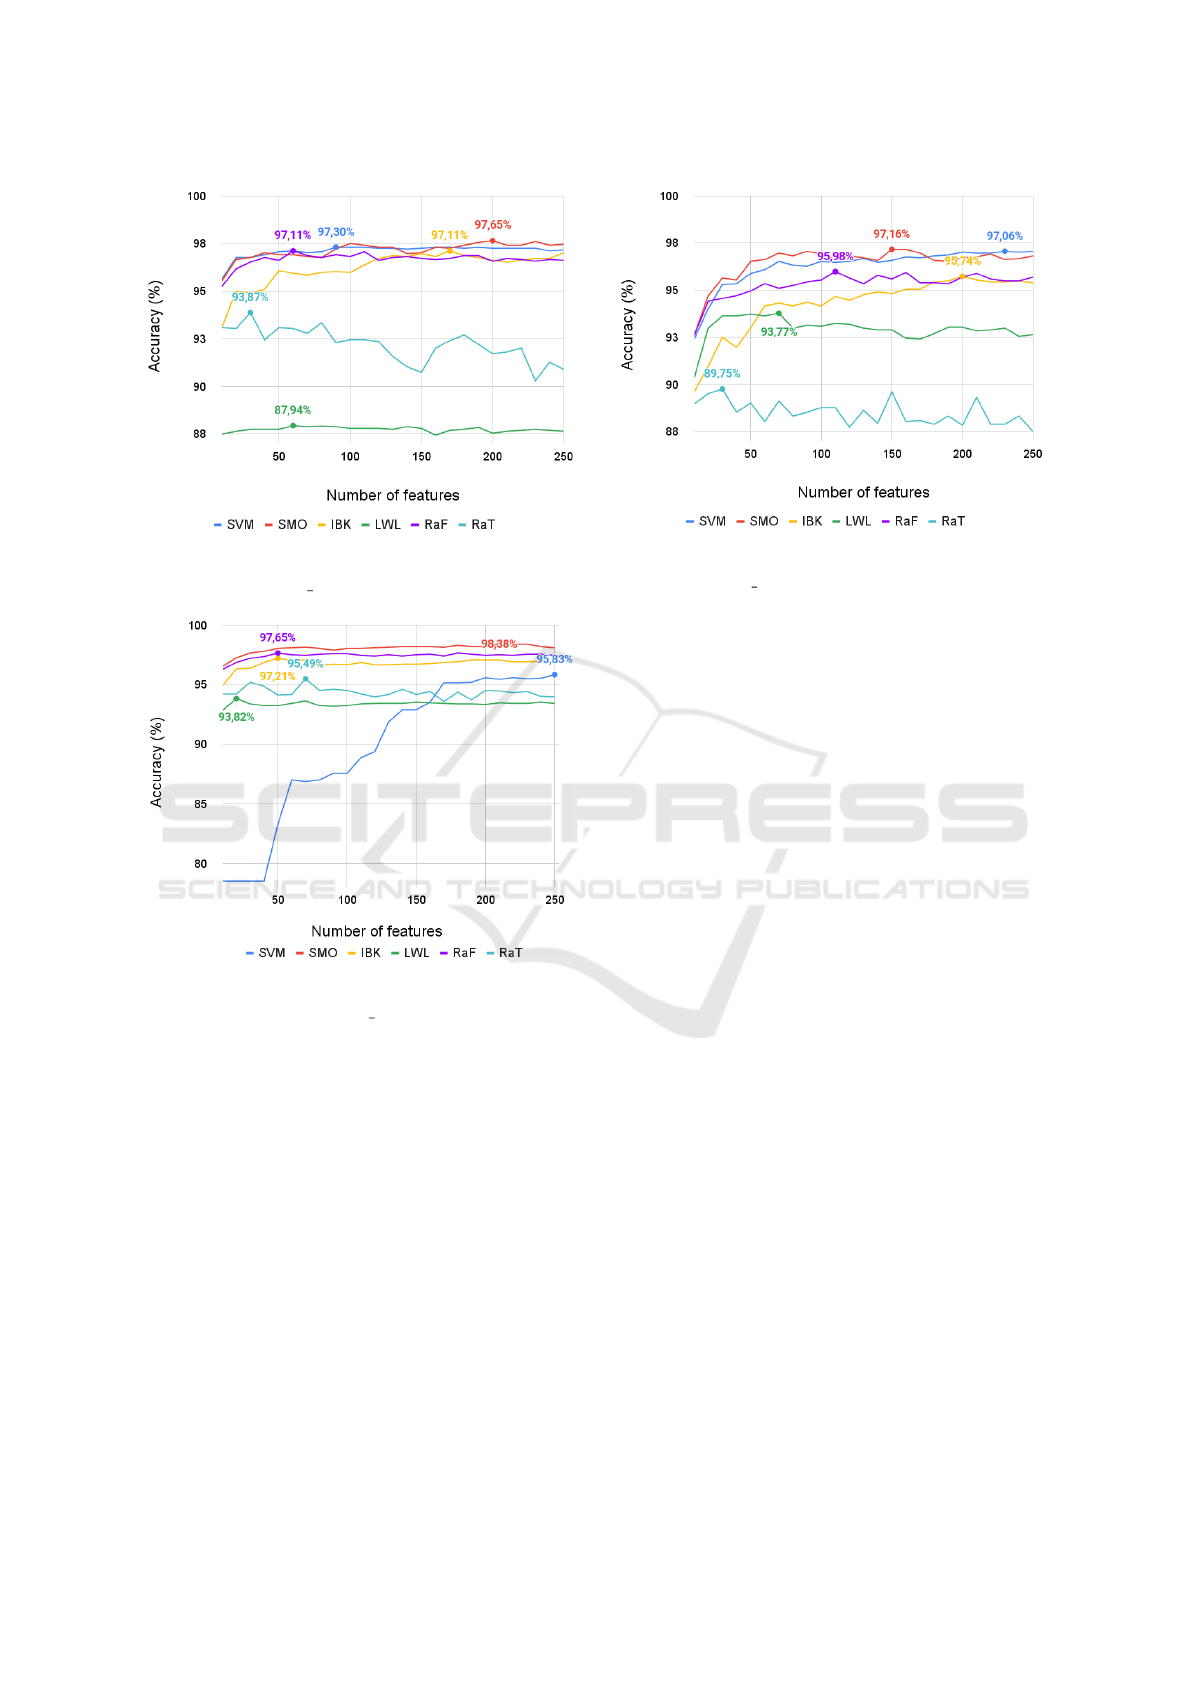
Figure 4: Accuracy values (%) obtained through the differ-
ent subsets of features with each classifier: ResNet-50 and
the corresponding avg pool layer.
Figure 5: Results obtained of ACC values (%) provided by
different subsets of features with each classifier: DenseNet-
201 and the corresponding avg pool layer.
tion with 200 deep features indicated the main strat-
egy, with an ACC of 94.17%, F-measure of 0.9410
and an AUC of 0.9056. In relation to the DenseNet-
201 model (Figure 5), the SMO classifier with 210
features indicated the best combination in this study,
with an ACC of 98.38%, F-measure of 0.984 and
an AUC value of 0.9814. When the EfficientNet-b0
model is considered (Figure 6), the best combina-
tion was also obtained through the SMO classifier, but
with a fewer number of features (150 features). The
ACC value was 97.16%, an F-measure of 0.972 and
an AUC rate of 0.9603. It is important to emphasize
that the SMO classifier presented the best results in
each test, indicating a relevant pattern in the context
investigated here.
In order to complement this analysis, Table 2
summarizes the best five results, considering all tests
Figure 6: Accuracy values (%) achieved via different sub-
sets of features with each classifier: EfficientNet-b0 and the
corresponding avg pool layer.
defined here.
From Table 2, it is observed that the first position
is a solution involving a single classifier. However,
the ensemble strategy appears in three of the five best
combinations observed in this study. Moreover, in the
first two positions, the solutions were obtained with
the same subset: 210 deep-learned features. Also,
considering the ACC metric, the difference is less
than 1% among these two solutions. The second-best
combination can be highlighted for its AUC (0.9941),
surpassing the result obtained via the best individual
combination, with the advantage of using an ensem-
ble of classifiers.
In order to contextualize other contributions of
this study, the best result according to the ACC met-
ric (Table 2) was observed in relation to the best
results obtained via ResNet-50, DenseNet-201 and
EfficientNet-b0 networks (all applied directly to clas-
sify the same set of images). It is important to note
that the CNN models were pre-trained into the Im-
ageNet dataset. Thus, it was necessary to train the
last fully connected layer of each network to adjust
the number of classes in this analysis (Healthy and
COVID-19). The training of the last fully connected
layer was defined with a total of 50 epochs, consider-
ing the details presented by (He et al., 2016). Also, in
order to validate the results of each epoch, the orig-
inal dataset was divided into training and test sets,
with an 80-20 split. The ACC, F-measure and loss
metrics were considered in these experiments. Figure
7 illustrates the obtained results through the accuracy
values for each epoch. The DenseNet-201 provided
the best result with 33 epochs, an accuracy value of
96.57%, a loss of 0.12 and an F-measure of 0.94. On
the other hand, this performance is lower in compar-
An Investigation of Deep-Learned Features for Classifying Radiographic Images of COVID-19
679
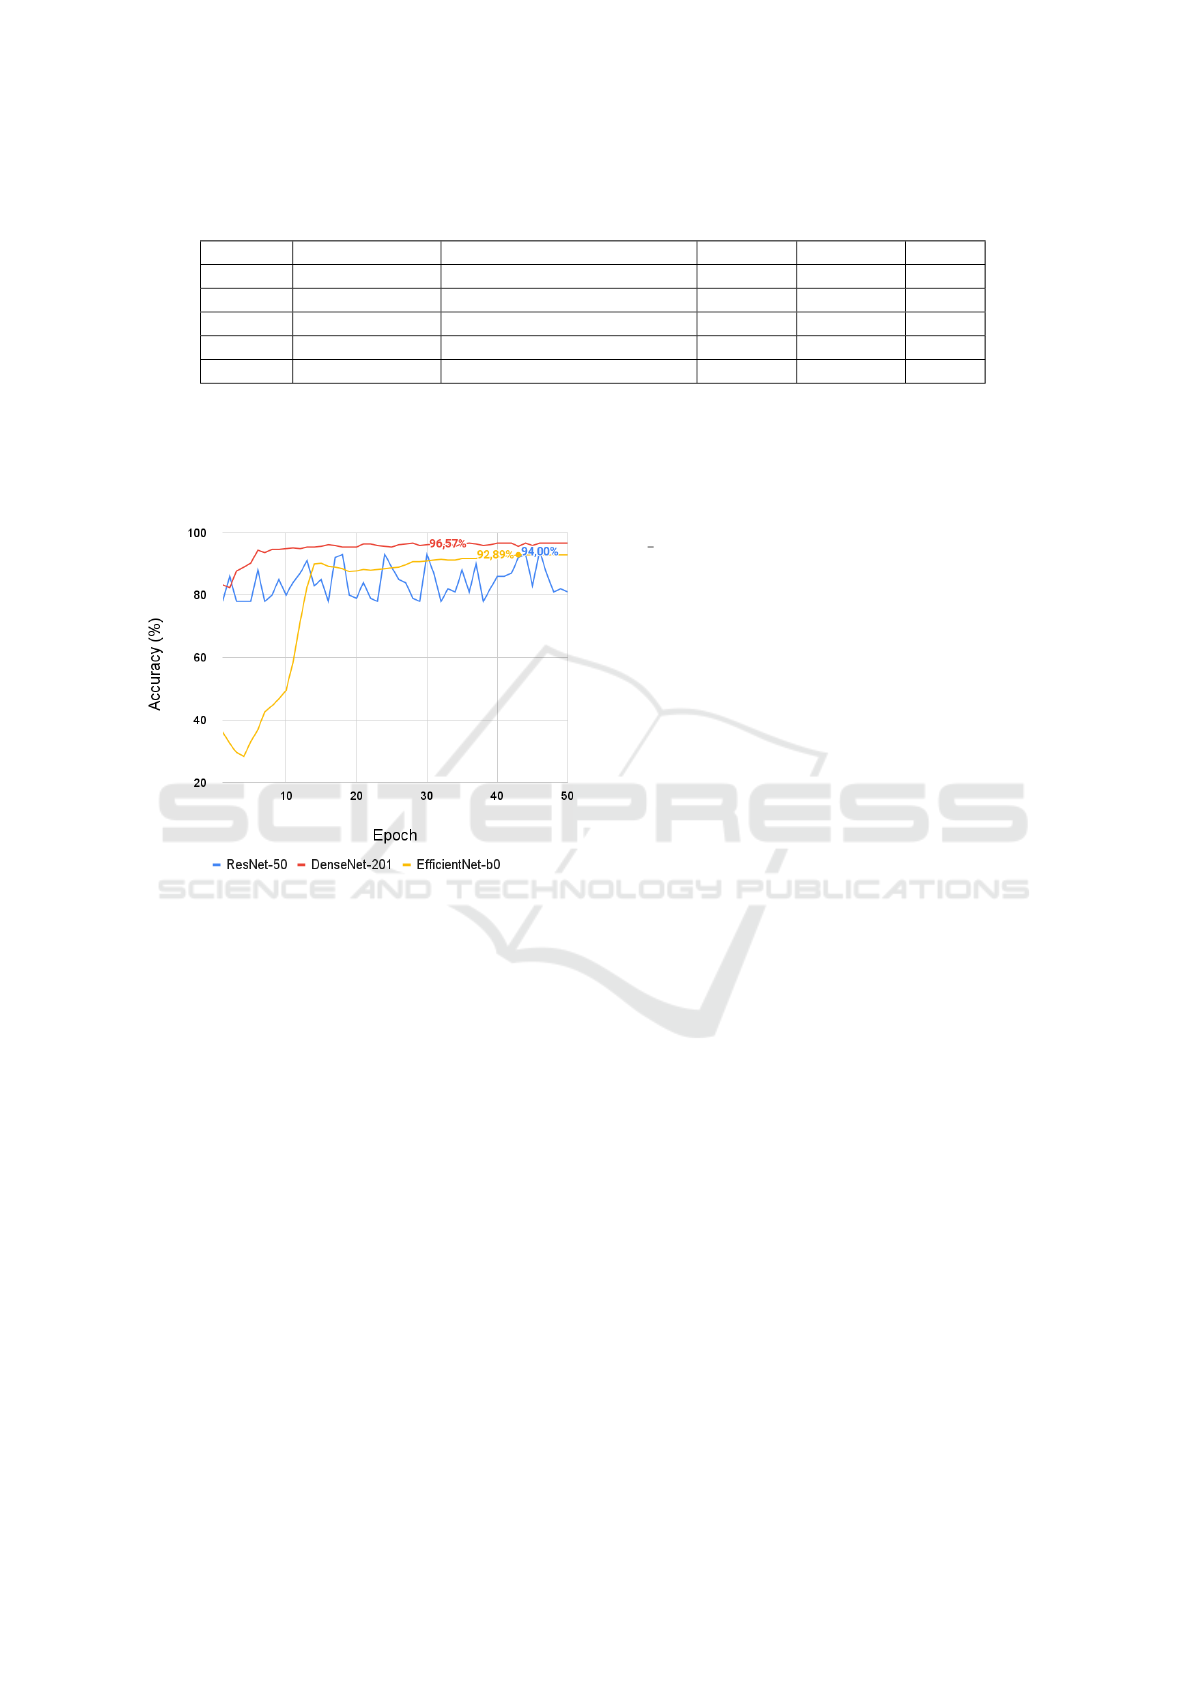
Table 2: Definitions of the five best associations to classify the COVID-19 images, with the corresponding performances
(ACC, F-measure and the AUC).
Ranking Network Combination ACC (%) F-measure AUC
1
◦
DenseNet-201 210 Features, SMO classifier 98.38% 0.984 0.9814
2
◦
DenseNet-201 210 Features, Ensemble 97.89% 0.979 0.9941
3
◦
ResNet-50 200 Features, Ensemble 97.70% 0.977 0.9932
4
◦
ResNet-50 200 Features, SMO classifier 97.65% 0.977 0.9684
5
◦
EfficientNet-b0 250 Features, Ensemble 97.59% 0.970 0.9882
ison to those via proposed associations, as shown in
Table 2. This information indicates another important
contribution of this study.
Figure 7: Accuracy values (%) obtained after classifying the
images with the ResNet-50, DenseNet-201 and EffientNet-
b0 models, exploring results with up to 50 epochs.
Finally, the relevance of the best result in relation
to the specialized Literature was verified. It is noted
that the explored techniques consider different strate-
gies and datasets from those explored here. Thus,
these facts do not allow a direct comparison between
the approaches but provide an illustrative overview of
the model through some important works in this area,
Table 3.
From Table 3, it is verified that the best combi-
nation from our proposal was capable of obtaining
results between the main works available in the spe-
cialized Literature. Even with the less expressive re-
sult compared to those indicated by some methods
(Tuncer et al., 2020; Kedia et al., 2021; Ashour et al.,
2021; Deb et al., 2022), the advantage of the proposed
methodology was a solution with competitive results
via a reduced number of features, making the knowl-
edge more comprehensive for specialists interested in
computer-aided diagnosis.
4 CONCLUSIONS
This work presented a detailed study of deep-
learned features via transfer learning, considering
avg pool layer from the ResNet-50, DenseNet-201,
and EfficientNet-b0 networks. The best combinations
were identified with a full understanding of the subset
of deep-learned features for the classification and pat-
tern recognition in COVID-19 images. The reduced
set of features was obtained via a strategy based on the
RelieF algorithm, with the use of multiple classifiers
and a robust ensemble strategy. This type of associa-
tion and the obtained information through our exper-
iments are relevant contributions presented here. For
instance, the best two combinations were obtained
from the DenseNet-201 model, using the same sub-
set: 210 deep-learned features. This total of features
represented only 10.94% of the original set. In the
test applying individual classifiers, the SMO algo-
rithm was capable of indicating the best results, with
an ACC of 98.38%. In the test with the ensemble
strategy, the result was an ACC of 97.89%, a value
subtly lower than that indicated via the SMO associa-
tion.
When the best results were compared to those ob-
tained with the use of complete neural networks, it
was verified that the solutions with our proposal sur-
passed the performances provided by the CNN mod-
els. Finally, when the results were observed in rela-
tion to some related works, our study was able to de-
fine models with performances among the available
specialized literature, providing relevant information
regarding the main associations via a reduced number
of deep features. Therefore, we believe that this con-
tribution is useful for specialists interested in inves-
tigating computational systems for radiographic im-
ages of COVID-19.
In future works, it is intended to explore different
architectures of CNNs and perform the combined use
with descriptors based on fractal techniques, in ad-
dition to the indication of techniques to highlight the
best-ranked attributes in the activation maps (class ac-
tivation mapping).
ICEIS 2023 - 25th International Conference on Enterprise Information Systems
680

Table 3: Illustrative overview of the different methods available in the specialized literature to investigate the context of
radiographic images of COVID-19.
Reference Approach ACC (%) AUC
(Tuncer et al., 2020)
ResExLBP, RelieF,
SVM
100% -
(Kedia et al., 2021)
CoVNet-19, Ensemble Learning,
Transfer learning
99.71% 0.99
(Ashour et al., 2021)
Bag of features, Ensemble
98.60% 0.98
(Deb et al., 2022) Multi model ensemble architecture 98.58% 0.95
Proposed
Transfer learning, DenseNet-201,
RelieF, SMO
98.38% 0.98
(Walvekar et al., 2020)
ResNet-50
96.23% 0.96
(Shamila Ebenezer et al., 2022)
EfficientNet-b0, Image Enchancement
94.56% 0.93
(Rajpal et al., 2021)
Handpicked Features, ResNet-50
94.40% 0.97
(Hemdan et al., 2020)
DenseNet-121, VGG19
90.00% 0.90
ACKNOWLEDGEMENTS
This study was financed in part by the: National
Council for Scientific and Technological Develop-
ment CNPq (Grants #313643/2021-0, #311404/2021-
9 and #120993/2020-1); State of Minas Gerais Re-
search Foundation - FAPEMIG (Grant #APQ-00578-
18); WZTECH NETWORKS, S
˜
ao Jos
´
e do Rio Preto,
S
˜
ao Paulo.
REFERENCES
Ashour, A. S., Eissa, M. M., Wahba, M. A., Elsawy, R. A.,
Elgnainy, H. F., Tolba, M. S., and Mohamed, W. S.
(2021). Ensemble-based bag of features for auto-
mated classification of normal and covid-19 cxr im-
ages. Biomedical Signal Processing and Control,
68:102656.
Atkeson, C., Moore, A., and Schaal, S. (1996). Locally
weighted learning. AI Review.
Breiman, L. (2001). Random forests. Machine learning,
45(1):5–32.
Cohen, J. P., Morrison, P., and Dao, L. (2020). Covid-19
image data collection. arXiv 2003.11597.
Deb, S. D., Jha, R. K., Jha, K., and Tripathi, P. S. (2022). A
multi model ensemble based deep convolution neural
network structure for detection of covid19. Biomedi-
cal Signal Processing and Control, 71:103126.
Deng, J., Dong, W., Socher, R., Li, L.-J., Li, K., and Fei-
Fei, L. (2009). Imagenet: A large-scale hierarchical
image database. In 2009 IEEE conference on com-
puter vision and pattern recognition, pages 248–255.
Ieee.
Fomin, V., Anmol, J., Desroziers, S., Kriss, J., and Te-
jani, A. (2020). High-level library to help with train-
ing neural networks in pytorch. https://github.com/
pytorch/ignite.
Frank, E., Hall, M., and Pfahringer, B. (2003). Locally
weighted naive bayes. In 19th Conference in Uncer-
tainty in Artificial Intelligence, pages 249–256. Mor-
gan Kaufmann.
Frank, E. and Kirkby, R. (2023).
RandomTree Classifier. Weka.
https://weka.sourceforge.io/doc.dev/weka/classifiers/
trees/randomtree.html.
Hall, M., Frank, E., Holmes, G., Pfahringer, B., Reutemann,
P., and Witten, I. H. (2009). The weka data min-
ing software: An update. SIGKDD Explor. Newsl.,
11(1):10–18.
He, K., Zhang, X., Ren, S., and Sun, J. (2016). Deep resid-
ual learning for image recognition. In Proceedings of
the IEEE conference on computer vision and pattern
recognition, pages 770–778.
Hemdan, E. E.-D., Shouman, M. A., and Karar, M. E.
(2020). Covidx-net: A framework of deep learning
classifiers to diagnose covid-19 in x-ray images.
Huang, G., Liu, Z., van der Maaten, L., and Weinberger,
K. Q. (2016). Densely connected convolutional net-
works.
Kedia, P., Anjum, and Katarya, R. (2021). Covnet-19:
A deep learning model for the detection and anal-
ysis of covid-19 patients. Applied Soft Computing,
104:107184.
Organization, W. H. (2023). Coronavirus disease (COVID-
19). World Health Organization. https://www.who.
int/health-topics/coronavirus\#tab=tab\ 1.
Paszke, A., Gross, S., Massa, F., Lerer, A., Bradbury, J.,
Chanan, G., Killeen, T., Lin, Z., Gimelshein, N.,
Antiga, L., Desmaison, A., Kopf, A., Yang, E., De-
Vito, Z., Raison, M., Tejani, A., Chilamkurthy, S.,
Steiner, B., Fang, L., Bai, J., and Chintala, S. (2019).
Pytorch: An imperative style, high-performance deep
learning library. In Advances in Neural Information
Processing Systems 32, pages 8024–8035. Curran As-
sociates, Inc.
Pereira dos Santos, F. and Antonelli Ponti, M. (2019).
Alignment of local and global features from multiple
An Investigation of Deep-Learned Features for Classifying Radiographic Images of COVID-19
681

layers of convolutional neural network for image clas-
sification. pages 241–248.
Platt, J. (1998). Fast training of support vector machines us-
ing sequential minimal optimization. In Schoelkopf,
B., Burges, C., and Smola, A., editors, Advances
in Kernel Methods - Support Vector Learning. MIT
Press.
Rajpal, S., Lakhyani, N., Singh, A. K., Kohli, R., and Ku-
mar, N. (2021). Using handpicked features in conjunc-
tion with resnet-50 for improved detection of covid-19
from chest x-ray images. Chaos, Solitons & Fractals,
145:110749.
Ribeiro, M. G., Neves, L. A., Nascimento, M. Z. d.,
Roberto, G. F., Martins, A. M., and Tosta, T. A. A.
(2019). Classification of colorectal cancer based on
the association of multidimensional and multireso-
lution features. Expert Systems With Applications,
120:262––278.
Ross, A. and Nandakumar, K. (2009). Fusion, Score-Level,
pages 611–616. Springer US, Boston, MA.
Shamila Ebenezer, A., Deepa Kanmani, S., Sivakumar, M.,
and Jeba Priya, S. (2022). Effect of image transforma-
tion on efficientnet model for covid-19 ct image clas-
sification. Materials Today: Proceedings, 51:2512–
2519. International Conference on Advances in Mate-
rials Science.
Song, Y., Ren, S., Lu, Y., Fu, X., and Wong, K. K. (2022).
Deep learning-based automatic segmentation of im-
ages in cardiac radiography: A promising challenge.
Computer Methods and Programs in Biomedicine,
220:106821.
Su, H., Zhao, D., Elmannai, H., Heidari, A. A., Bourouis,
S., Wu, Z., Cai, Z., Gui, W., and Chen, M. (2022).
Multilevel threshold image segmentation for covid-19
chest radiography: A framework using horizontal and
vertical multiverse optimization. Computers in Biol-
ogy and Medicine, 146:105618.
Tan, M. and Le, Q. V. (2020). Efficientnet: Rethinking
model scaling for convolutional neural networks.
Tuncer, T., Dogan, S., and Ozyurt, F. (2020). An automated
residual exemplar local binary pattern and iterative re-
lieff based covid-19 detection method using chest x-
ray image. Chemometrics and Intelligent Laboratory
Systems, 203:104054.
Vapnik, V. (1963). Pattern recognition using generalized
portrait method. Automation and remote control,
24:774–780.
Walvekar, Sanika, Shinde, and Swati, D. (2020). Detec-
tion of covid-19 from ct images using resnet50. 2nd
International Conference on Communication & Infor-
mation Processing.
Witten, I. H., Frank, E., and Hall, M. A. (2011). Data
Mining: Practical Machine Learning Tools and Tech-
niques. Morgan Kaufmann Publishers Inc., San Fran-
cisco, CA, USA, 3rd edition.
ICEIS 2023 - 25th International Conference on Enterprise Information Systems
682
