
Developing and Evaluating a Tool to Support Predictive Tasks
José Augusto Câmara, José Maria Monteiro and Javam Machado
Universidade Federal do Ceará, Brazil
Keywords:
Machine Learning, Predictive Tasks, Regression, Classification.
Abstract:
Currently, professionals from the most diverse areas of knowledge need to explore their data repositories in
order to extract knowledge and create new products or services. Several tools have been proposed in order
to facilitate the tasks involved in the Data Science lifecycle. However, such tools require their users to have
specific (and deep) knowledge in different areas of Computing and Statistics, making their use practically
unfeasible for non-specialist professionals in data science. In this paper, we present the developing and evalu-
ating of a tool called DSAdvisor, which aims to encourage non-expert users to build machine learning models
to solve predictive tasks (regression and classification), extracting knowledge from their data repositories. To
evaluate DSAdvisor, we applied the System Usability Scale (SUS) questionnaire to measure aspects of usabil-
ity in accordance with the user’s subjective assessment and the Net Promoter Score (NPS) method to measure
user satisfaction and willingness to recommend it to others. This study involved 20 respondents who were
divided into two groups, namely experts and non-expert users. The SUS method had a score of 68.5 which
means a “good” product, and the results of using NPS get a value of 55% which means “very good” NPS.
1 INTRODUCTION
Due to a large amount of data currently available,
arises the need for professionals of different areas to
extract knowledge from their repositories to create
new products and services. For example, tax audi-
tors may want to explore their databases in order to
predict the likelihood of tax evasion. However, the
volume and variety of data far exceed human capacity
for manual analysis. In response, complex algorithms
have been developed which allow identifying patterns
hidden in these datasets. The convergence of these
phenomena has driven the development and popular-
ization of data science (Provost and Fawcett, 2013).
Data science is a multidisciplinary area involving
the extraction of knowledge from large data reposi-
tories (Provost and Fawcett, 2013). Nevertheless, to
extract knowledge from the data, we must be able to
(i) understand yet unsolved problems with the use of
data mining techniques, (ii) understand the data and
their interrelationships, (iii) extract a data subset, (iv)
create machine learning models in order to solve the
selected problem, (v) evaluate the performance of the
new models, and (vi) demonstrate how these models
can be used in decision-making (Chertchom, 2018).
The complexity of these tasks explains why only ex-
perts can master the Data Science lifecycle.
On the other hand, several tools have been pro-
posed to support the tasks involved in the Data Sci-
ence lifecycle. However, such tools require their users
to have specific (and deep) knowledge in different
areas of Computing and Statistics, making their use
practically unfeasible for non-specialist professionals
in data science. In addiction, the usability nature of
data science tools is a key characteristic to achieve
the acceptance of users regardless of their expertise.
Usability is defined as the extent to which a specific
user in a certain context can use a product to achieve a
defined goal effectively, efficiently and satisfactorily.
Satisfaction is related to how the users believe or feel
positively that the product meet their requirements.
In this context, we present the developing and
evaluating of a tool called DSAdvisor, which aims to
encourage non-expert users to build machine learn-
ing models to solve predictive tasks (regression and
classification). In order to evaluate DSAdvisor we ap-
plied the System Usability Scale (SUS) questionnaire
to measure aspects of usability in accordance with the
user’s subjective assessment. Next, we explored the
Net Promoter Score (NPS) method to measure user
satisfaction and willingness to recommend DSAdvi-
sor to others. The SUS method had a score of 68.5
which means a “good” product, and NPS get a value
of 55% which means a “very good” satisfaction.
Câmara, J., Monteiro, J. and Machado, J.
Developing and Evaluating a Tool to Support Predictive Tasks.
DOI: 10.5220/0012039200003467
In Proceedings of the 25th International Conference on Enterprise Information Systems (ICEIS 2023) - Volume 1, pages 279-286
ISBN: 978-989-758-648-4; ISSN: 2184-4992
Copyright
c
2023 by SCITEPRESS – Science and Technology Publications, Lda. Under CC license (CC BY-NC-ND 4.0)
279

The remainder of this paper is organized as fol-
lows. Section 2 briefly reviews related works. The
implementation of DSAdvisor is illustrated in section
3. Section 4 details the usability tests (SUS and NPS)
performed to evaluate DSAdvisor in everyday situa-
tions and their results. Finally, in section 5 we present
our conclusions and suggestions for future research.
2 RELATED WORKS
Traditional data mining tools help companies estab-
lish data patterns and trends by using a number of
complex algorithms and techniques. Some of these
tools are installed on the desktop to monitor the data
and highlight trends, and others capture information
residing outside a database. As example of such tools,
we can cite: KEEL, Knime, Orange, RapidMiner and
WEKA (Hasim and Haris, 2015).
KEEL (Knowledge Extraction based on Evolu-
tionary Learning) is a software that facilitates the
analysis of the behavior of evolutionary learning in
different approaches of learning algorithm such as
Pittsburgh, Michigan, IRL (iterative rule learning)
and GCCL (genetic cooperative-competitive learn-
ing) (Alcalá-Fdez et al., 2009).
Knime is a modular environment that enables easy
integration of new algorithms, data manipulation and
visualization methods. It’s interface is configurable
allowing the selection of different methods. Specifi-
cally, one can select data sources, data prepossessing
steps, machine learning algorithms, as well as visu-
alization tools. To create the workflow, the user drag
some nodes, drop onto the workbench, and link it to
join the input and output ports.
The Orange tool has different features which are
visually represented by widgets (e.g. read file, dis-
cretize, train SVM classifier, etc.). Each widget has a
short description within the interface. Programming
is performed by placing widgets on the canvas and
connecting their inputs and outputs (Demšar et al.,
2013).
RapidMiner provides a visual and user friendly
GUI environment. This tool use the process concept.
A process may contain subprocesses. Processes con-
tain operators which are represented by visual compo-
nents. An application wizard provides prebuilt work-
flows for a number of common tasks including direct
marketing, predictive maintenance, sentiment analy-
sis, and a statistic view which provides many statisti-
cal graphs (Hofmann and Klinkenberg, 2016).
Weka offers four operating options: command-
line interface (CLI), Explorer, Experimenter and
Knowledge flow. The “Explorer” option allows
the definition of data source, data preparation, run
machine learning algorithms, and data visualization
(Hall et al., 2009).
In (Filho et al., 2021a), the authors propose a
guideline to support predictive tasks in data science.
In addition to being useful for non-experts in Data
Science, the proposed guideline can support data sci-
entists, data engineers or programmers which are
starting to deal with predictive tasks. In (Filho and
Monteiro, 2021), the authors propose a tool which
aims to encourage non-expert users to build ma-
chine learning models. The proposed tool follows the
guideline presented in (Filho et al., 2021b).
A key challenge in developing and deploying Ma-
chine Learning (ML) systems is understanding their
performance across a wide range of inputs. In this
context, Wexler et al. (Wexler et al., 2020) created
the What-If Tool, an open-source application that al-
lows practitioners to probe, visualize, and analyze ML
systems, with minimal coding. The What-If Tool lets
practitioners test performance in hypothetical situa-
tions, analyze the importance of several features, and
visualize model behavior across multiple subsets of
input data. It also lets practitioners measure ML mod-
els according to multiple fairness metrics. In (Khod-
nenko et al., 2020), the authors proposed the SMILE
platform which allows creating ML projects without
programming. For now, over 80 ML methods have
been added to the SMILE platform.
3 DEVELOPING THE DSAdvisor
TOOL
We built a tool called DSAdvisor to encourage non-
expert users to build machine learning models to solve
predictive (regression or classification) tasks. DSAd-
visor was developed in Flask (Grinberg, 2018) and
Python. Besides, DSAdvisor follows all stages of the
guideline proposed in (Filho et al., 2021b).
3.1 Phase 1: Exploratory Analysis
The first phase of the DSAdvisor aims to analyze a
dataset, provided by the user, and next, describe and
summarize it. This phase comprises the following
activities: uploading the data, checking the type of
variables, removing variables, choosing missing value
codes, exhibiting descriptive statistics, plotting cate-
gorical and discrete variables, analyzing distributions,
and displaying correlations. Figure 1 illustrates the
first phase of DSAdvisor.
ICEIS 2023 - 25th International Conference on Enterprise Information Systems
280
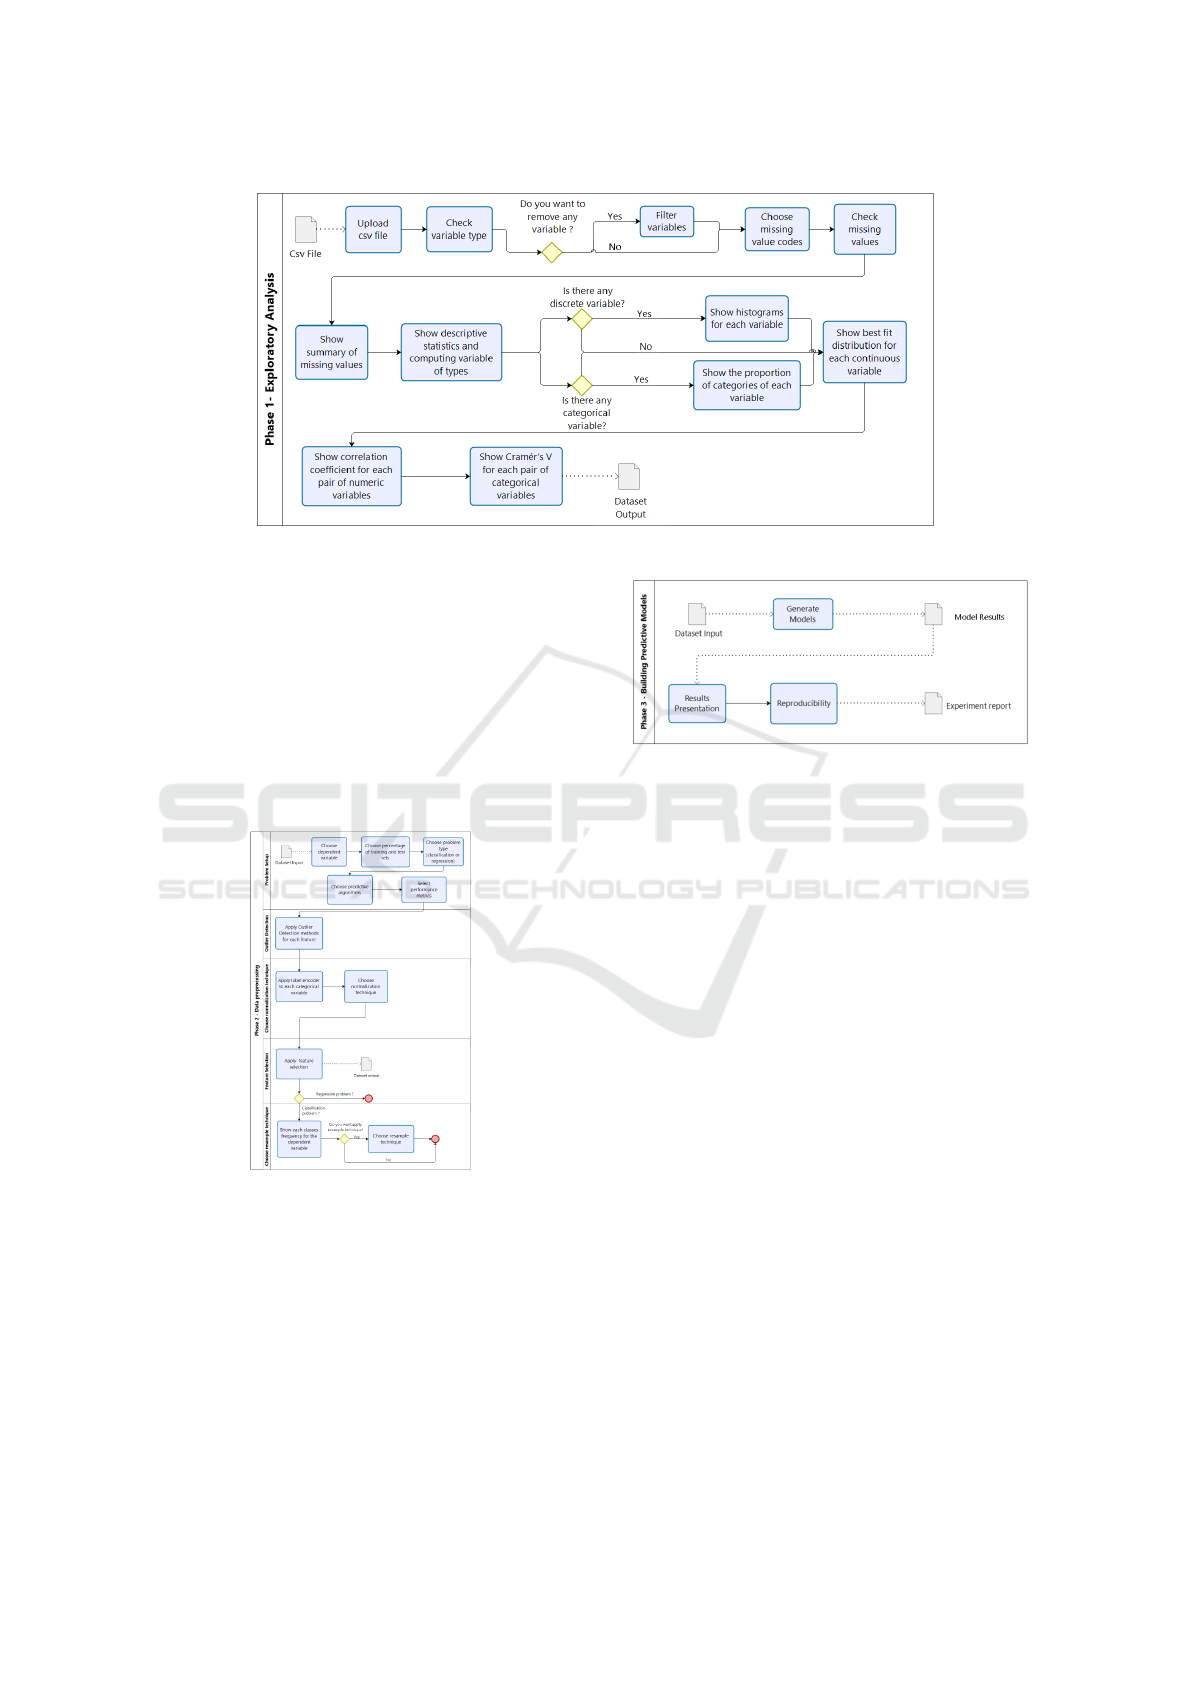
Figure 1: Phase 1 - Exploratory Analysis.
3.2 Phase 2: Data Preprocessing
Data preprocessing is an essential component to solve
many predictive tasks. The purpose of the second
phase of DSAdvisor is to prepare the data in order
to use it to build predictive models. This phase in-
cludes activities related to outlier detection, data nor-
malization, choose the independent variable, selection
of attributes, data balancing, feature selection, and di-
vision of training and testing sets (Figure 2).
Figure 2: Phase 2 - Data preprocessing.
3.3 Phase 3: Building Predictive Models
This phase aims to generate predictive models and an-
alyze their results. Figure 3 illustrates the activities
that make up this phase, which typically involves a
fixed sequence of processing steps (e.g., feature ex-
traction, dimensionality reduction, learning and mak-
ing predictions).
Figure 3: Phase 3 - Building Predictive Models.
4 EVALUATING THE DSAdvisor
TOOL
The usability nature of DSAdvisor is a key aspect to
achieve the acceptance of expert and non-expert users.
In this section, we will detail the usability and satis-
faction assessment performed to evaluate DSAdvisor.
Usability is defined as the extent to which a spe-
cific user in a certain context can use a product to
achieve a defined goal effectively, efficiently and sat-
isfactorily. Satisfaction is related to how the users
believe or feel positively that the product meet their
requirements.
4.1 Usability Tests
Usability is the “extent to which a product can be used
by specified users to achieve specified goals with ef-
fectiveness, efficiency and satisfaction in a specified
context of use”. So, usability is measured through
user interaction while using softwares, products or
services, seeking to achieve goals with efficacy, effi-
ciency and user satisfaction according to (Bevan et al.,
2016). The word “usability” relates to the methods
used to facilitate usage of a product or service, during
the design process , where every detail is strategically
Developing and Evaluating a Tool to Support Predictive Tasks
281

thought and built (Nielsen et al., 2012).
Usability evaluation ensures that products or ser-
vices are adapted to the users and their tasks. Its
goal is to assess the degree of utility, efficiency, effi-
cacy, learnability, accessibility and satisfaction. Util-
ity means the user’s ability to use a particular product
to achieve a specific goal. Efficacy is related to how
well the system meets the tasks for which it was de-
signed. Efficiency refers to the speed and precision
that the user achieves goals. Learning is the accu-
mulated knowledge used by the user to handle a par-
ticular product. Accessibility consists in having ac-
cess to products to achieve goals. Satisfaction refers
to the user’s perception of the product (Charlton and
O’Brien, 2019).
Usability tests are user-centric design techniques
used to evaluate a product or software in everyday
situations. They allow feedback directly from users
who work with or perform tasks with the analyzed ob-
ject. It can measure how efficient and effective it is for
predetermined goals. Besides, when carrying out the
proposed tests, users often surprise the evaluators by
taking unexpected actions while testing the software.
To carry out a usability test, it is ideal to use already
well-established methods, models and artifacts. Some
popular usability tests are: Nielsen’s usability heuris-
tics Nielsen (Nielsen, 1995), System Usability Scale
(SUS) (Lewis, 2018), Net Promoter Scores (NPS)
(Mandal, 2014), Software Usability Measurement
Inventory (SUMI) (Kirakowski and Corbett, 1993),
Website Analysis and Measurement Inventory Ques-
tionnaire (Wammi) (Claridge and Kirakowski, 2011),
and User Experience Questionarie (UEQ) (Schrepp,
2015).
4.1.1 Net Promoter Score (NPS)
The NPS is a metric designed to measure the satis-
faction of a customer or user (Ras et al., 2017). The
concept of NPS relies on approaching customers or
users on how likely they are to recommend product-
s/services to their peers (Korneta, 2014). The respon-
dents give their answers on a scale of 0 (unlikely) to
10 (very likely), and they are labeled as “promoters”,
“passives” or “detractors”. Users that answer with
9 or 10 are called promoters. Customers that give
grades 7 or 8 are called passives (or indifferent), and
those who give grades between 0 and 6 are called de-
tractors. Promoters are classified as loyal customers
who will always provide product/service recommen-
dations to third parties. Passives are satisfied with the
company’s products/services but have the potential to
accept other products/services offered by competitors.
Finally, detractors are dissatisfied customers, driving
other people away from using the company’s product-
s/services.
Finally, the NPS is calculated as the difference be-
tween the proportion of promoters and detractors and
can thus lie between +100 (promoters only) and -100
(detractors only) percent. Values above 0 are consid-
ered “good”, above 50 are classified as “very good”,
and above 70 are interpreted as “excellent”, in terms
of product and service quality (Lee, 2018). It is im-
portant to note that the NPS calculation does not use
passive users.
4.1.2 System Usability Scale (SUS)
System Usability Scale (SUS) is a standardized ques-
tionnaire widely used to assess perceived usability.
The survey consists of ten questions; each has a five-
point Likert response continuum (from strongly agree
to strongly disagree) (Brooke, 1996; Lewis, 2018).
The SUS scoring system requires ratings for all
10 items, so if a respondent leaves an item blank, they
should receive a raw score of 3 (the center of the five-
point scale). To calculate the SUS score, initially,
the participant’s scores (called raw item scores) for
each question are converted to a new number (called
adjusted scores or score contributions) as described
next. For odd items, subtract one from the user re-
sponse. For even items, subtract the user responses
from 5. This process will scale all values from 0 to
4 (with four being the most positive response). Next,
add up the converted responses for each user and mul-
tiply that total by 2.5. This converts the range of pos-
sible values from 0 to 100 instead of from 0 to 40.
Though the scores are 0-100, they are not percent-
ages and should be considered only in their percentile
ranking. The following equation shows a more con-
cise way to calculate a standard SUS score from a set
of raw item ratings:
SUS = 2.5 ∗[[(Q1 +Q3 + Q5 + Q7 + Q9)
+(Q2 + Q4 + Q6 + Q8 + Q10)]]
The SUS provides a score from 0 to 100. Accord-
ing to (Bangor et al., 2009) a score of 85 or higher
represents “exceptional” usability, a value between 72
to 85 denotes a “good” result, a score between 52
and 71 means “ok” and a value below 52 represents
unacceptable usability. One of the main benefits of
the SUS is that its output is an easy-to-understand
score, ranging from 0 to 100, where the higher the
SUS value, the better the usability of the product.
This unitless score works very well for making rela-
tive comparisons. SUS allows you to evaluate a wide
variety of products and services, including hardware
and software.
ICEIS 2023 - 25th International Conference on Enterprise Information Systems
282

4.2 Usability Assessment Settings
The usability assessment performed in this work was
designed to address two different user profiles: ex-
perts (experienced people in the data science area) and
non-experts (people with minimal or without knowl-
edge in the data science area). The usability tests were
carried out remotely and the participants performed a
set of tasks using DSAdvisor.
The DSAdvisor was made available in an Ama-
zon EC2 instance. So, the participants could access
DSAdvisor from their machine without installing any
prerequisites, using just an URL. Before performing
any task using DSAdvisor, the participants filled out
a demographic form to map their respective profiles.
After performing a set of data analysis tasks, the par-
ticipants filled out the SUS and NPS surveys.
4.2.1 Population
This usability test was attended by 20 people, of
which 10 had a varied profile (including professionals
from information technology, engineering and similar
areas, all of them without knowledge in data science)
and 10 data science practitioners. The age group of
the participants ranged between 20 and 40 years old.
4.2.2 Usability Assessment Interviews
In order to carry out the usability assessments, we pre-
viously scheduled the first interview with each of the
20 participants. Initially, the participants filled out a
demographic form. This form collects personal data,
such as age, gender, user experience, experience in the
data science area and previous experience with data
science tools or programming languages. Finally, the
interviewee informed the date and time available for
the following interview.
In the second interview, the participants accessed
the DSAdvisor tool through a URL to an instance
available on Amazon’s EC2. Next, we provide partic-
ipants with a dataset in a ".csv" file. We designed this
dataset to make it possible to explore all the DSAvisor
features. Then, we provide a set of data analysis tasks
to be performed using DSAdvisor, including choosing
the “best fit distribution” and “outlier detection”. Af-
ter performing these tasks, the participants filled out
the SUS and NPS surveys.
4.3 Usability Tests Results
This section will present and discuss the results of
the performed usability tests, more precisely, NPS
and SUS. We will organize and present the results us-
ing three different scenarios: non-expert users, expert
users and both (or general, including expert and non-
expert users together). This approach highlights the
differences present in the assessments of these three
different profiles. Besides, this strategy will make it
possible to identify which profile demonstrates better
acceptance of the DSAdvisor. Thus, we could answer
the following question: For which user profile is the
DSAdvidor tool best suited?
4.3.1 NPS Results
This section will present the results obtained for the
NPS method, following the organization described
previously.
• NPS results for non-expert users:
Figure 4 shows the NPS answers assigned by the
ten non-expert respondents. Note that DSAdvisor had
6 “promoters” (9-10), 2 “passives” (8) and 2 “detrac-
tors” (5 and 6). The NPS is calculated as the differ-
ence between the proportion of promoters and detrac-
tors. Then, NPS score = 60% - 20% = 40%. Scores
between 0 and 50 means “good” satisfaction. Thus,
DSAdvisor achieved a “good” level of satisfaction
among non-expert respondents.
• NPS results for expert users:
Figure 5 shows the NPS answers assigned by the
ten expert respondents. Note that DSAdvisor had 8
“promoters” (9-10), 1 “passives” (8) and 1 “detrac-
tors” (5). Then, NPS score = 80% - 10% = 70%.
Scores between 51 and 70 means “very good” sat-
isfaction. Thus, DSAdvisor achieved a “very good”
level of satisfaction among expert respondents. This
result is not by chance, since for expert users, many
features present in DSAdvisor are well-knowledge,
leading to higher scores.
• NPS results for both user profiles:
Figures 4 and 5 show the NPS answers assigned
by the non-expert and expert respondents, respectivty.
Note that DSAdvisor had 14 “promoters”, 3 “pas-
sives” and 3 “detractors”. Then, NPS score = 70%
- 15% = 55%. Scores between 51 and 70 means
“very good” satisfaction. Thus, DSAdvisor achieved
a “very good” level of satisfaction among all respon-
dents. Therefore, DSAdvisor had a “very good” ac-
ceptance among the participants.
4.3.2 SUS Results
This section will present the results obtained for the
SUS method, following the organization described
previously. Recalling that to calculate the SUS score
we have 10 questions to be answered on a scale from
0 to 5, where odd items have a positive tone and the
Developing and Evaluating a Tool to Support Predictive Tasks
283
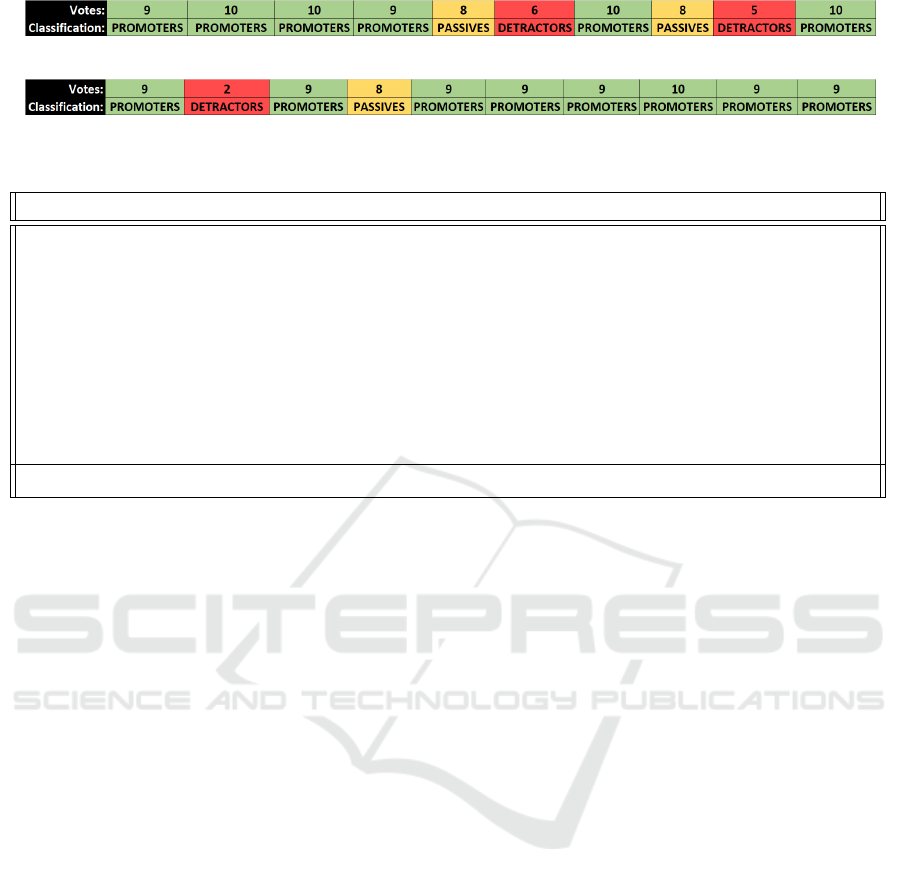
Figure 4: NPS score for non-expert users.
Figure 5: NPS applied to expert users.
Table 1: SUS results for non-expert users.
Q1 Q2 Q3 Q4 Q5 Q6 Q7 Q8 Q9 Q10 SUS RAW SCORE SUS FINAL SCORE
5 2 4 3 5 2 4 2 4 3 30 75
4 2 4 3 5 2 5 2 4 1 32 80
4 2 4 4 5 3 4 2 4 3 27 67.5
4 2 4 5 5 4 4 2 3 2 25 62.5
4 2 3 4 4 3 4 3 3 5 21 52.5
3 1 4 4 3 3 4 2 2 3 23 57.5
5 1 3 4 4 1 4 1 4 4 29 72.5
3 3 4 2 4 2 3 2 4 1 28 70
3 2 4 4 4 2 2 2 3 2 24 60
4 2 4 5 5 1 4 1 4 4 28 70
AVG: 67.5
even items have a negative tone. The scores given by
the users are called raw scores. Next, the raw scores
are converted to adjusted scores, as described next.
For odd items, subtract one from the user response.
For even items, subtract the user responses from 5.
Then, we sum the adjusted scores and multiplied the
result by 2.5 to obtain the standard SUS score (Lee,
2018).
• SUS results for non-expert users:
Table 1 shows the SUS answers assigned by the
ten non-expert respondents. Note that the SUS final
score is the avegare of the SUS scores obtained for
the ten non-expert respondents. The SUS final score
for non-expert users was 66.75. Remember that a
SUS score between 52 and 71 means “ok” concern-
ing usability, while a value between 72 to 85 denotes
a “good” usability. Then, we can argue that the SUS
score obtained by DSAdvisor among non-expert par-
ticipants (66.75) is very close to the range related to a
“good” usability.
• SUS results for expert users:
Table 2 shows the SUS answers assigned by the
ten expert respondents. Note that the SUS final score
is the average of the SUS scores obtained for the ten
expert respondents. The SUS final score for expert
users was 70.25. Then, we can argue that the SUS
score obtained by DSAdvisor among expert partic-
ipants (70.25) is very close to the range related to
a “good” usability (72 to 85). As in the NPS as-
sessment, expert users gave higher grades than non-
experts. This result stems from the fact that many
features present in DSAdvisor are well-knowledge by
experts.
• SUS results for both user profiles:
Table 3 shows the SUS answers assigned by the all
twenty respondents. The SUS final score was 68.5.
Then, we can argue that the SUS score obtained by
DSAdvisor among all participants (68.5) is very close
to the range related to a “good” usability (72 to 85).
Although the SUS results did not vary much among
the user profiles as the NPS results, we believe that
DSAdvisor is able to meet the needs of the general
public, concerning to support predictive tasks in data
science.
5 CONCLUSIONS AND FUTURE
WORKS
Professionals from the most diverse areas of knowl-
edge need to explore their data repositories to extract
knowledge and create new products or services. On
the other hand, several tools have been proposed to
facilitate the tasks involved in the Data Science life-
cycle. However, such tools require their users to have
specific (and deep) knowledge in different areas of
Computing and Statistics, making their use practi-
cally unfeasible for non-experts in data science.
In this paper, we presented the developing and
evaluating of a tool called DSAdvisor, which aims to
encourage non-expert users to build machine learning
ICEIS 2023 - 25th International Conference on Enterprise Information Systems
284

Table 2: SUS results for expert users.
Q1 Q2 Q3 Q4 Q5 Q6 Q7 Q8 Q9 Q10 SUS RAW SCORE SUS FINAL SCORE
5 3 3 4 5 2 3 2 4 4 25 62.5
2 5 2 5 4 2 1 4 1 4 10 25
3 4 5 4 1 1 4 1 4 4 23 57.5
3 2 4 1 4 2 4 2 3 1 30 75
4 2 4 4 4 2 4 2 4 2 28 70
5 2 4 3 4 1 5 2 4 1 33 82.5
5 1 4 2 4 2 4 2 4 2 32 80
4 1 5 2 5 2 4 1 5 1 36 90
4 4 5 1 5 1 5 1 5 1 36 90
4 3 4 2 4 1 4 1 3 4 28 70
AVG: 70.25
Table 3: SUS results for both user profiles.
Q1 Q2 Q3 Q4 Q5 Q6 Q7 Q8 Q9 Q10 SUS RAW SCORE SUS FINAL SCORE
5 3 3 4 5 2 3 2 4 4 25 62.5
2 5 2 5 4 2 1 4 1 4 10 25
3 4 5 4 1 1 4 1 4 4 23 57.5
3 2 4 1 4 2 4 2 3 1 30 75
4 2 4 4 4 2 4 2 4 2 28 70
5 2 4 3 4 1 5 2 4 1 33 82.5
5 1 4 2 4 2 4 2 4 2 32 80
4 1 5 2 5 2 4 1 5 1 36 90
4 4 5 1 5 1 5 1 5 1 36 90
4 3 4 2 4 1 4 1 3 4 28 70
5 3 3 4 5 2 3 2 4 4 25 62.5
2 5 2 5 4 2 1 4 1 4 10 25
3 4 5 4 1 1 4 1 4 4 23 57.5
3 2 4 1 4 2 4 2 3 1 30 75
4 2 4 4 4 2 4 2 4 2 28 70
5 2 4 3 4 1 5 2 4 1 33 82.5
5 1 4 2 4 2 4 2 4 2 32 80
4 1 5 2 5 2 4 1 5 1 36 90
4 4 5 1 5 1 5 1 5 1 36 90
4 3 4 2 4 1 4 1 3 4 28 70
AVG: 68.5
models to solve predictive tasks, extracting knowl-
edge from their data repositories. To evaluate DSAd-
visor, we applied the System Usability Scale (SUS)
questionnaire to measure aspects of usability in accor-
dance with the user’s subjective assessment and the
Net Promoter Score (NPS) method to measure user
satisfaction and willingness to recommend it to oth-
ers. This study involved 20 respondents who were
divided into two groups, namely experts and non-
expert. The SUS method had a score of 68.5 which
means a “good” product, and the results of using NPS
get a value of 55% which means “very good” NPS. As
future works we intent to improve DSAdvisor from
the outputs of the performed tests. Besides, we will
extend DSAdvidor to support other data science tasks
like clustering and association rules.
REFERENCES
Alcalá-Fdez, J., Sanchez, L., Garcia, S., del Jesus, M. J.,
Ventura, S., Garrell, J. M., Otero, J., Romero, C., Bac-
ardit, J., Rivas, V. M., et al. (2009). Keel: a software
tool to assess evolutionary algorithms for data mining
problems. Soft Computing, 13(3):307–318.
Bangor, A., Kortum, P., and Miller, J. (2009). Determining
what individual sus scores mean: Adding an adjective
Developing and Evaluating a Tool to Support Predictive Tasks
285

rating scale. Journal of usability studies, 4(3):114–
123.
Bevan, N., Carter, J., Earthy, J., Geis, T., and Harker, S.
(2016). New iso standards for usability, usability re-
ports and usability measures. In International confer-
ence on human-computer interaction, pages 268–278.
Springer.
Brooke, J. (1996). Sus: a “quick and dirty’usability. Us-
ability evaluation in industry, 189(3).
Charlton, S. G. and O’Brien, T. G. (2019). Handbook of
human factors testing and evaluation. CRC Press.
Chertchom, P. (2018). A comparison study between data
mining tools over regression methods: Recommenda-
tion for smes. In 2018 5th International Conference
on Business and Industrial Research (ICBIR), pages
46–50. IEEE.
Claridge, N. and Kirakowski, J. (2011). Wammi: website
analysis and measurement inventory questionnaire.
Retrived May, 20(2013):57–66.
Demšar, J., Curk, T., Erjavec, A., Gorup,
ˇ
C., Ho
ˇ
cevar, T.,
Milutinovi
ˇ
c, M., Možina, M., Polajnar, M., Toplak,
M., Stari
ˇ
c, A., et al. (2013). Orange: data mining
toolbox in python. the Journal of machine Learning
research, 14(1):2349–2353.
Filho, J. A. C. and Monteiro, J. M. (2021). Dsadvisor: A
tool to support predictive tasks in data science. In
Anais Estendidos do XXXVI Simpósio Brasileiro de
Bancos de Dados, pages 81–86, Porto Alegre, RS,
Brasil. SBC.
Filho, J. A. C., Monteiro, J. M., Mattos, C. L. C., and
Nobre, J. S. (2021a). A practical guide to support
predictive tasks in data science. In Filipe, J., Smi-
alek, M., Brodsky, A., and Hammoudi, S., editors,
Proceedings of the 23rd International Conference on
Enterprise Information Systems, ICEIS 2021, Online
Streaming, April 26-28, 2021, Volume 1, pages 248–
255. SCITEPRESS.
Filho, J. A. C., Monteiro, J. M., Mattos, C. L. C., and
Nobre, J. S. (2021b). A practical guide to support
predictive tasks in data science. In Filipe, J., Smi-
alek, M., Brodsky, A., and Hammoudi, S., editors,
Proceedings of the 23rd International Conference on
Enterprise Information Systems, ICEIS 2021, Online
Streaming, April 26-28, 2021, Volume 1, pages 248–
255. SCITEPRESS.
Grinberg, M. (2018). Flask web development: develop-
ing web applications with python. " O’Reilly Media,
Inc.".
Hall, M., Frank, E., Holmes, G., Pfahringer, B., Reutemann,
P., and Witten, I. H. (2009). The weka data min-
ing software: an update. ACM SIGKDD explorations
newsletter, 11(1):10–18.
Hasim, N. and Haris, N. A. (2015). A study of open-source
data mining tools for forecasting. In Proceedings of
the 9th International Conference on Ubiquitous Infor-
mation Management and Communication, pages 1–4.
Hofmann, M. and Klinkenberg, R. (2016). RapidMiner:
Data mining use cases and business analytics appli-
cations. CRC Press.
Khodnenko, I., Ivanov, S. V., Prokofiev, K., and Lantseva,
A. (2020). A lightweight visual programming tool
for machine learning and data manipulation. In 2020
International Conference on Computational Science
and Computational Intelligence (CSCI), pages 981–
985.
Kirakowski, J. and Corbett, M. (1993). Sumi: The software
usability measurement inventory. British journal of
educational technology, 24(3):210–212.
Korneta, P. (2014). What makes customers willing to rec-
ommend a retailer-the study on roots of positive net
promoter score index. Central European Review of
Economics & Finance, 5(2):61–74.
Lee, S. (2018). Net promoter score: Using nps to measure
it customer support satisfaction. In Proceedings of the
2018 ACM SIGUCCS Annual Conference, pages 63–
64.
Lewis, J. R. (2018). The system usability scale: past,
present, and future. International Journal of Human–
Computer Interaction, 34(7):577–590.
Mandal, P. C. (2014). Net promoter score: a conceptual
analysis. International Journal of Management Con-
cepts and Philosophy, 8(4):209–219.
Nielsen, J. (1995). How to conduct a heuristic evaluation.
Nielsen Norman Group, 1:1–8.
Nielsen, J. et al. (2012). Usability 101: Introduction to us-
ability.
Provost, F. and Fawcett, T. (2013). Data science and its rela-
tionship to big data and data-driven decision making.
Big data, 1(1):51–59.
Ras, Z. W., Tarnowska, K. A., Kuang, J., Daniel, L., and
Fowler, D. (2017). User friendly nps-based recom-
mender system for driving business revenue. In Inter-
national Joint Conference on Rough Sets, pages 34–
48. Springer.
Schrepp, M. (2015). User experience questionnaire hand-
book. All you need to know to apply the UEQ suc-
cessfully in your project.
Wexler, J., Pushkarna, M., Bolukbasi, T., Wattenberg, M.,
Viégas, F., and Wilson, J. (2020). The what-if tool: In-
teractive probing of machine learning models. IEEE
Transactions on Visualization and Computer Graph-
ics, 26(1):56–65.
ICEIS 2023 - 25th International Conference on Enterprise Information Systems
286
