
Process Automation and Monitoring Systems Based on IIoT Using
Private LoRaWAN Networks: A Case Study of ArcelorMittal Vega
Facilities
Danilo Farias de Carvalho
a
and Charles Christian Miers
b
Graduate Program in Applied Computing (PPGCAP), Santa Catarina State University (UDESC), Brazil
Keywords:
Industry 4.0, IoT, IIoT, Legacy Systems, LoRaWAN, Process Automation.
Abstract:
The Internet of Things (IoT) is increasingly pervasive and ubiquitous in various areas. The industry is incorpo-
rating intelligence into its processes through the Industrial IoT (IIoT). However, availability and performance
issues may limit IoT usage on the shop floor. Several IoT and IIoT initiatives can be applied on the factory
floor to improve processes, also allowing the inclusion of less reliable equipment. Thus, there are several
implementation approaches, wireless being the most used one due to its deployment flexibility and centered
management. We analyze a real shop floor environment, identifying opportunities for using IIoT systems
and equipment such as Long Range Wide Area Network (LoRaWAN) technologies. Our results show the
possibility of improving process automation and monitoring using simple IIoT devices in Small and Medium
Enterprises (SMEs) still far from Industry 4.0 level.
1 INTRODUCTION
The Operational Technology (OT) is an area known
for being conservative (Wollschlaeger et al., 2017),
and often dilatory related to more intensive Informa-
tion Technology (IT) usage on shop floor. Recently,
IT and OT have been converging in a way they are of-
ten part of the same department, and may share phys-
ical resources, including cyber and physical manufac-
turing spaces (Cheng et al., 2018). The advent of
Industry 4.0 allows for a greater technological inte-
gration between processes, in which it is possible to
have more intelligent sensors and actuators with the
support of Industrial Internet of Things (IIoT) (Sauter
et al., 2011a). Furthermore, fifth-generation Wire-
less (5G) technology adoption allows to intensify new
possibilities of IIoT usage on shop floor to be eval-
uated and studied. Based on a list of requirements
and a compliance analysis, assessing which technolo-
gies can be used to integrate legacy systems is pos-
sible. Since performing this type of integration can
bring some complexity, depending on how it is re-
alized. Thus, it should consider how the associated
legacy system was designed, what technologies were
used, whether there is adequate documentation, etc.
a
https://orcid.org/0000-0003-3992-5484
b
https://orcid.org/0000-0002-1976-0478
Furthermore, it is also necessary to identify the prob-
lem of OT to integrate simple to complex processes,
and there must have a way of communicating to form
systems.
There are several possibilities for using process
automation and monitoring to bring information from
the shop floor to the computational clouds. There-
fore, searching for case studies showing the feasibil-
ity and benefits of low-cost IIoT equipment with Long
Range Wide Area Network (LoRaWAN) is relevant
to encourage its wide adoption. We emphasized here
that mission-critical equipment that can cause human
harm is not the focus of our study and already has an
extensive literature.
We analyzed a real shop floor environment, cat-
egorized it, and identified opportunities to use IIoT
systems and equipment. Moreover, we adopted the
LoRaWAN private networks to identify whether these
are adherent to the scenario of this study.
This work is organized as follows. Section 2
presents the fundamentals. Section 3 enlists key char-
acteristics of industrial automation and Industry 4.0,
IIoT, and LPWAN. Section 4 presents how the in-
dustrial systems are divided based on ISA-95 Model.
Section 5 briefly lists the main reasons for evolution
concerning to automation. Section 6 presents and
evaluates the ArcelorMittal Vega environment, expos-
Farias de Carvalho, D. and Miers, C.
Process Automation and Monitoring Systems Based on IIoT Using Private LoRaWAN Networks: A Case Study of ArcelorMittal Vega Facilities.
DOI: 10.5220/0012039300003482
In Proceedings of the 8th International Conference on Internet of Things, Big Data and Security (IoTBDS 2023), pages 243-254
ISBN: 978-989-758-643-9; ISSN: 2184-4976
Copyright
c
2023 by SCITEPRESS – Science and Technology Publications, Lda. Under CC license (CC BY-NC-ND 4.0)
243

ing our case study details. Section 7 describes our
implementation and identified results.
2 FUNDAMENTAL CONCEPTS
Automation is a reality being incorporated more and
more, both in homes (also known as domotic automa-
tion or smart house) (Flores et al., 2018), (Giorgetti
et al., 2008), as in industries (Sauter et al., 2011b).
In this context Internet of Things (IoT) emerged as
a way to enable interaction mainly between devices
that until then was essentially between people and
devices (Hassan, 2018). The IoT concept was used
very broadly, with several residential use cases and
cities, but industrial use was slower due to legacy sys-
tems (Choi et al., 2018). Thus, industrial automation
has occurred for several generations and comprises
the types of devices and the networks used to connect
the devices.
The evolution has led the industry to the concept
of IIoT, which is the use of IoT with industrial re-
quirements, including in spite of the shop floor. Aim-
ing at a parameterization and organization concerning
what is performed by OT, IIoT is organized in several
levels defining fundamental aspects of operation and
their operational requirements.
Both IoT and IIoT have accelerated adoption.
While in some cases, there is the only change from
older legacy systems, there are several new opportu-
nities for new applications and the need to integrate
the new possibilities with the already installed base.
According to estimates from International Data Cor-
poration (IDC) (Reinsel et al., 2018), there will be
41.6 billion “connected things” in 2025. At first, IoT
integrates a network of physical objects with a series
of sensors connected with the possibility of exchang-
ing information with other devices using the Inter-
net as a path. The applicability of this type of solu-
tion since domestic applications, through companies
in various segments, medical applications, industrial
applications, etc. For a device to be considered intel-
ligent, it is not enough to be connected to the Internet.
Developing conceptual applications or prototypes on
some device (e.g., Arduino, ESP8266, or ESP32), to
remotely turn on a light, read sensor data or start a
small motor can be considered a good way of learn-
ing, but this does not mean you have a smart device
and it is a simple device connected using the Inter-
net. When some sensors and software interpret this
data and add an ”intelligence” layer to the processing,
there will be a real application of IoT.
Industrial IoT or IIoT refers to the application
of IoT technology in industrial environments, espe-
cially regarding the instrumentation and control of
sensors and devices involving cloud technologies.
Some branches of industry are currently looking for
Machine to Machine (M2M) type communication to
achieve wireless automation and control. The emer-
gence of cloud computing (whether public or private)
and other technologies (e.g., advanced analytics and
Machine Learning (ML)) allow different sectors to
reach a new layer of automation, being able to cre-
ate new revenues and business models. The IIoT also
defines the set of technologies and services, allowing
devices, computers, and smart objects to be intercon-
nected through the Internet. The IIoT is often asso-
ciated with Industry 4.0. However, a factory or pro-
duction process that only has IIoT cannot be consid-
ered as belonging to Industry 4.0. Besides technolo-
gies such as Big Data, IoT, and cloud computing, it
is possible to reduce costs and make production more
automated and autonomous (Mohamed, 2018), con-
tributing to the overall result of the company. Another
aspect is the industry has specific requirements that
must be highlighted, such as performance require-
ments in IoT / industrial automation services, which
can be subdivided into:
1. Motion Control: Category that includes continu-
ous processes as in some steel industries, speed
variation of conveyors, painting systems, etc.;
2. Mobile Robots: Robotic control can be static
(e.g., assembly line), or autonomous; as well as
camera systems and cooperative motion systems;
3. Mobile Control Panels with Safety Functions:
Overhead cranes, systems that monitor safety
zones (e.g., NR 12 - Safety at Work in Machinery
and Equipment - Used in Brazil), robotic arms;
and
4. Process Automation / Monitoring: Supervision
and control systems of a process in which sensors
and actuators can be read.
An industrial plant integrates several automation
systems, e.g., measurement systems, welding ma-
chines, etc. Thus, heterogeneity is part of this reality.
Table 1 lists and categorizes the central industrial au-
tomation systems, taking into account important re-
quirements (Brown et al., 2018), covering the main
systems in any industrial plant.
Table 1 performance criteria (Brown et al., 2018):
1. Service Availability: It is the percentage of avail-
ability of an end-to-end type of communication;
2. Cycle Time and Latency: Refers to the maximum
time allowed in communication, in which the time
of sending a command to the actuator or request-
ing a sensor reading until the return of the execu-
tion confirmation; and
IoTBDS 2023 - 8th International Conference on Internet of Things, Big Data and Security
244

Table 1: Industrial Automation Performance Requirements
/ IIoT Requirements.
Use Case (High Level) Availability
Cycle
Time
Typical
Payload
Size
Number of
Devices
Typical
Service
Area
Motion Control
Printing
Machine
>99,9999% <2ms 20 bytes >100
100m x
100m x 30m
Machine
Tool
>99,9999% <0,5ms 50 bytes ∼20
15m x 15m
x 3m
Packaging
Machine
>99,9999% <1ms 40 bytes ∼50
10m x 5m
x 3m
Mobile Robots
Cooperative
Motion Control
>99,9999% 1ms 40-250 bytes 100 <1 km
2
Video-Operated
Remote Control
>99,9999% 10-100ms 15-150 bytes 100 <1 km
2
Mobile Control Panels with
Safety Functions
Assembly Robots or
Milling Machines
>99,9999% 4-8ms 40-250 bytes 4 10m x 10m
Mobile Cranes >99,9999% 12ms 40-250 bytes 2 4m x 60m
Process Automation (Process Monitoring)
>99,99% >50ms several 10.000 devices per km
2
3. Service Area and Density: Indicates whether the
desired performance has been achieved and the
number of devices within a predefined area.
Compliance with the mentioned criteria will di-
rectly impact ”how” the automation system will be
designed, built, and maintained. The time cycles cri-
terion can determine the level of hardware or redun-
dancy required for the automation system. If the sys-
tem is monitored only in a process in which there is
no risk to human safety, equipment safety, or the envi-
ronment, the level of redundancy may be lower. The
intensification of the use of industrial networks, re-
placing the old serial communications (e.g., RS232,
RS422, RS485, etc.), and the need to transfer data
from the lowest levels to the highest levels in con-
vergence to the ISA-95 standard has become even
greater (Hood, 2015).
3 INDUSTRIAL AUTOMATION
Process automation, also known as industrial au-
tomation, is an area known to be conserva-
tive (Wollschlaeger et al., 2017), and sometimes even
reactive in using IT resources. However, conser-
vatism impacts finances or the necessity of a com-
plex infrastructure. In this context, there is a need
to interconnect devices through communication net-
works that may be similar, or even the same type,
as the networks used in IT. It is an important high-
light among the various possibilities of shareable re-
sources: networks (wired, wireless, etc.), data cen-
ters, servers, databases, monitoring systems, clusters,
storage systems, support teams, etc. The advent of
Industry 4.0 promoted a technological integration be-
tween processes is proposed, in which it is possible
to have improved sensors and actuators supported by
IIoT (Sauter et al., 2011a). Therefore, a fundamental
issue is the role of communication networks, whether
they originate in IT or OT; in the end, these are tech-
nologies, and they must contribute to the evolution of
society. The purpose of technology is not found in
itself but in what it proposes to do with it.
Industry 4.0 has some characteristics and provides
some resources. Still, suppose a company has one of
them. In that case, this does not indicate that such
a company is in this category, as a comprehensive
analysis of the technologies and processes involved
is necessary. Some authors (Mohamed, 2018) have
grouped and highlighted the following characteris-
tics: Autonomous Robots, Simulations, Systems In-
tegration, IoT, Cybersecurity, Cloud Computing, 3D
Printing, Augmented Reality, and Big Data. The ex-
pected benefits of applying the concept of Industry
4.0 are: Cost Reduction, Energy Savings, Increase
in Security, Environmental Conservation, Error Re-
duction, End of Waste, Business Transparency, In-
crease in Quality of Life, Unprecedented Customiza-
tion, and Scale. Even though some essential technolo-
gies emerged during the Industry 3.0 phase (e.g., In-
ternet, mobile telephony, and cloud computing), they
are still part of the Industry 4.0 basis (Colombo et al.,
2021).
Industry 3.0 will continue to be relevant for a long
time, not only because it has elements composing the
Industry 4.0 basis; but also because there is a whole
legacy that cannot be replaced in a short time (Iyer,
2018). The change from Industry 2.0 to Industry 4.0
in a single step is practically unfeasible, being a ”step
by step” approach most suitable, investing in equip-
ment from the beginning will bring a gain in scale
(e.g., robots, etc.), which will allow the company to
enter Industry 3.0, and new or modernized equipment
will also serve at the time of migration to Industry 4.0,
reducing the technological leap (Iyer, 2018).
3.1 IIoT
IIoT technology is an integral part of Industry 4.0 and
can be considered a means for this transition (Pilsan
et al., 2019). Thus, defining the set of technologies
and services allows interconnecting devices, comput-
ers, and smart objects through the internet or indus-
trial network. One of the features inherited from IoT,
and which can be very useful in the industry, is the
possibility of communication between devices and
the collaboration between them M2M (Da Xu et al.,
2014). Several companies in Brazil are still in Indus-
try 1.0 and Industry 2.0, and it will take some time
to replace these legacy systems; in this way, new ap-
proaches arose, and driving characteristics of IIoT can
help in the evolution of these systems. As an example,
some micro-controlled devices serving as gateways or
remotes for Programmable Logic Controller (PLC)s
in the field, based on IoT technologies (e.g., ZigBee,
LoRaWAN, ESP32, ESP8266, RaspBerry Pi, among
others). These can also contribute to raising the level
Process Automation and Monitoring Systems Based on IIoT Using Private LoRaWAN Networks: A Case Study of ArcelorMittal Vega
Facilities
245

of monitoring of an industrial process. In companies
where industrial automation is already in Industry 3.0,
the applicability of IIoT can be observed in different
contexts, whether in a traditional automation system
or in the integration with the cloud, Edge Computing,
and Smart Factories, among others. The possibility of
having the processing at the end devices (i.e., in the
sensors themselves) and that these can be connected
in the private enterprise cloud, processes like the eval-
uation of a stock, or production order, can be initiated
or have a certain level of monitoring without human
intervention. An area that can also benefit from IoT
and IIoT is prescriptive maintenance, which is one in
which you can calculate and estimate the ideal time to
be performed with a high level of reliability; being a
smarter approach, it combines the detection of equip-
ment degradation, with statistical models already con-
solidated (Choubey et al., 2019), and later with the in-
troduction of Artificial Intelligence (AI) and Machine
Learning (ML). Thus, it can also take advantage of
IIoT, with the implementation of sensors and wire-
less networks, using devices with a lower cost than
those existing in traditional architecture with PLCs;
and in this way, generating historical data which are
essential to understand the ”behavior of a production
process”, including in terms of maintenance. A model
refined with such statistical data, and forecasting tech-
niques can provide users with options regarding cor-
rective measures (MATTIOLI et al., 2020).
3.2 LPWAN
Low Power Wide Area Networks (LPWAN) is a
generic term for a group of technologies allow-
ing long distances communications, low cost, and
reduced energy consumption (Lin et al., 2017).
LPWAN is suitable for IoT applications that need to
transmit small amounts of information over a certain
distance. The IoT market has expanded rapidly, and
technologies based on LPWAN can be used in a wide
variety of scenarios. Several technologies LPWAN
represented in Figure 1 emerged in licensed and unli-
censed markets (e.g., Long Term Evolution (LTE)-M,
SigFox, Long Range (LoRa), and Narrowband Inter-
net of Things (NB-IoT), etc.).
LPWAN can cover distances between 10km and
40km in rural areas and between 1km to 5km in urban
areas (Mekki et al., 2019). An important characteris-
tic of LPWAN is that they work in the Sub-Ghz bands,
directly impacting their ability to overcome obstacles.
As a LPWAN technology, it significantly improves
the power consumption of IoT and IIoT devices, with
a battery life of around ten years. It also has spectrum
efficiency, especially in indoor coverage, as it belongs
Wifi / Mobile Tecnologies
Short Distance
LPWAN
802.11ac
802.11ad
802.11n
802.11a
802.11b
802.11g
5G
4G
3G
2G
Bluetooth BLE
RFID/NFC
ZigBee 802.15.4
WPAN 802.15.4
WBAN 802.15.6
LoRa
SigFox
NB-IoT
LTE-M
Distance
Required Bandwidth
Figure 1: Bandwidth Required vs. Reached Distance.
to a Sub-Ghz (Mekki et al., 2019) category. Table 2
shows some characteristics of LPWAN technologies
in evidence in IoT and IIoT.
Table 2: IoT Technologies - Characteristics.
Standard 802.11
Bluetooth Low
Energy (BLE)
ZigBee Pro SigFox LoRa LTE-M NB-IoT 5G
3GPP Adherence? No No No No No
Yes
(Release 13)
Yes
(Release 13)
Yes
(Release 15)
Coverage Area
17 - 30
(m)
∼1 - 50
(m)
∼1 a 250
(m)
<12
(km)
<10
(km)
<10
(km)
<15
(km)
<12
(km)
Spectrum /
Bandwidth
2.4 Ghz
(802.11)
2.4 Ghz
(802.15.1)
2.4 Ghz
(802.15.4)
900 Mhz 900 Mhz 7 - 900 Mhz 8 - 900 Mhz
5 - 900Mhz
(entre outras)
Baud Rate
450
(Mbps)
(802.11n)
1
(Mbps)
250
(kbps)
∼100 - 600
(bps)
∼200 - 50
(kbps)
<1
(Mbps)
<144
(kbps)
∼10
(Gbps)
Cost
4.00 USD
(2016)
4.00 USD
(2016)
3.00 USD
(2016)
4.00 USD
(2015)
2.64 USD
(2020)
4.00 USD
(2015)
2.64 USD
(2020)
5.00 USD
(2015)
3.30 USD
(2020)
4.00 USD
(2015)
2 - 3 USD
(2020)
<2.00 USD
Latency
20 - 40
(ms)
6
(ms)
40
(ms)
1 - 30
(s)
61 - 371
(ms)
50 - 100
(ms)
1.6 - 10
(s)
5 - 50
(ms)
Security 256 bits
128 bits
AES
128 bits 16 bits
32 bits
AES-128
3GPP
128 - 256 bits
3GPP
128 - 256 bits
3GPP
256 bits
Evaluating the data in the Table 2, when there
are long distances for industrial applications, some
of these can already be discarded (e.g., IEEE 802.11,
BLE and ZigBee) for not fit this requirement.
4 IIoT SCENARIOS, PROBLEMS,
CHALLENGES, AND
OPPORTUNITIES
A traditional representation or classification regard-
ing systemic levels within an industry is the ”Automa-
tion Pyramid”, based on the The International Society
for Measurement and Control (ISA) model, the ISA-
95 (Hood, 2015). Each specialty (or level) is repre-
sented by a layer that composes the pyramid. Figure 2
presents the concept of ISA-95 and some processes
exemplifying at which levels they are and how the
levels are divided not only in the view of traditional
automation but also in the so-called informatics. It
is also important to be concerned with issues such as
network segmentation, DMZ, firewalls, etc.
This representation starts from the sensor/actuator
that is in the base until it reaches the Business Intel-
ligence (BI) systems. At each of these levels, one or
more interfaces may perform the role of process in-
tegrator. Since each system can compose each level,
IoTBDS 2023 - 8th International Conference on Internet of Things, Big Data and Security
246

Sensors Drivers Actuators Robots
Process
Batch
Control
Discrete
Control
Drive
Control
Process
Control
Basic
Control
Safety
Control
Supervisory
Client
Area
Supervisory
Control
Supervisory
Application
Server
PIMS
System
Engineering
Workstation
Remote
Access
Server
Site
Operations
and Control
Level 0
Level 1
Level 2
Level 3
Level 4
Level 5
Site Business Planning and Logistics
Network
Enterprise Network
Cell / Area
Zone
Industrial
Security
Zone
Industrial
DMZ
Industrial
Security
Zone
Supervisory
Client
E-mail, Intranet,
Etc
Operator
Interface
Operator
Interface
Engineering
Workstation
Web
E-Mail
CIP
Application
Mirror
Web
Services
Operations
Application
Server
Remote
Gateway
Services
Patch
Management
Anti-Virus
Server
Figure 2: Automation Levels (Hood, 2015).
which can be customized and heterogeneous, differ-
ent interfaces can be created for this role (Li et al.,
2020).
Table 3 lists and categorizes the hierarchical lev-
els present in the ISA-95 Model, which are present
in medium and large companies / industrial plants.
The difference for smaller companies may be the ab-
sence of a BI system or an Enterprise Resource Plan-
ning (ERP). ISA-95, is a widely known model and
derived from ISA-88. These models are used by
manufacturing companies, providing references and
standards in automation, integration systems between
companies and operations, and Manufacture Opera-
tions Management (MOM) (Hood, 2015). Interna-
tional Electrotechnical Commission (IEC) also has
a widely used IEC62264 standard, which provides
criteria and terminology for batch control systems,
sometimes known as batch processes.
Table 3: Automation Levels - ISA-95 Model (Hood, 2015).
ISA Levels Activities ISA Name Type of System Example
Level 5 Business Intelligence BI BI
Level 4
Business-related activities needed to manage a
manufacturing organization
Enterprise ERP, CRM ERP, CRM, Logistics
Level 3
Activities of the work flows to produce
the desired end products
Site, Area,
Work Centre,
Work Unit
MES. LIMS, CMM
City X Plant,
Cookie Making Area,
Cookie Packaging,
Line Work Center
Level 2
Activities of monitoring and controlling
the physical processes
PLC
HMI, SCADA,
Batch Systems
Process Optimization,
Mathemathical Model
Level 1
Activities and sensors involved in manipulating
the physical process
Device,
Control Model
I/O, Devices, Sensors
Cookie Wrapper Paper,
Tension Measurer
Level 0 Physical Process Equipment Cookie Wrapper
Table 3 not only exemplifies how the systemic lev-
els division but also groups types of systems and some
examples. ISA-95 model is the reference to process
automation. This division of levels of industrial infor-
matics includes the segregation of processes and func-
tions that the applications in each level need to have,
as well as an adequate level of segregation. From the
point of view of information security, in some com-
panies, firewalls are installed between the automation
network and the corporate network, as seen in Fig-
ure 2. For our study, the present work focuses on the
controllers and Human Machine Interfaces (HMIs)
that makeup Level 1, up to the Supervisory Control
And Data Acquisition (SCADA) and process opti-
mization systems, which are part of Level 2. The
challenges of data communication and it is integra-
tion from the shop floor to the cloud in a production
process are already consolidated in a large company
or process, or even in a smaller process, part of the
same principle; and in this way, even a small process
can take advantage of this integration. This study can
benefit companies before Industry 3.0, and IoT and
IIoT can contribute to this process. Exploring a little
more these factors, regarding the problems and chal-
lenges, essential features can be grouped into 8 groups
((Technologies, 2019), (NetSuite, 2020), (Artemenko,
2021) and (Jayalaxmi et al., 2021): Interoperabil-
ity, Reliability, Security, Performance, Management,
Storage, Scalability, and Change Mindset.
5 PROBLEM DEFINITION
An industrial plant consists of integrating several au-
tomation systems, and heterogeneity is one of its char-
acteristics. Regarding the project, management and
technical/economic feasibility are the same regardless
of whether a project is automated or not. Thus, if the
project is not motivated by legal or safety issues, such
a project needs to be ”attractive”. The automation of a
production process in a traditional way from scratch,
known as (greenfield), or even a reform (brownfield
- also known as revamp), can demand engineering,
in several specialties, such as: electrical, mechanical,
civil, automation, metallic structures, etc. In the case
of a revamp, there is the additional risk that if the ren-
ovation is not carried out within the stipulated dead-
lines, it may cause damage to a production line that
was previously producing (i.e., operational and finan-
cial stability problems). When an industry decides to
automate it is functions, the motivator is commonly
different from types of processes (Autor, 2015):
1. Operation: Improvement of operating conditions,
which includes possible technical feasibility;
2. Quality: Product quality, that is, manufacturing
in narrower error tolerance bands, using efficient
quality control;
3. Safety: Physical integrity of human beings and/or
equipment;
4. Flexibility: Easily and quickly allow changes in
the parameters of the manufacturing process;
5. Regulatory: When there is a new regulatory stan-
dard or the revision of an existing one;
Process Automation and Monitoring Systems Based on IIoT Using Private LoRaWAN Networks: A Case Study of ArcelorMittal Vega
Facilities
247
6. Productivity: Efficient use of raw materials, ma-
chine time, personal availability, etc.; and
7. Control: Increase the level of process control,
generation of statistical data, reports, Key Perfor-
mance Indicators (KPIs), etc.
However, some questions emerge: (i) What to
do when an automation project is necessary but not
economically viable? (ii) When does a company
of type Small and Medium-sized Enterprises (SME)
have budget constraints? (Powell et al., 2013) state
SMEs face financial and resource difficulties in ac-
quiring new technologies, one of the reasons why
these companies still behave cautiously in this mat-
ter. The present work aims at a real case study to
analyze how IIoT can contribute to production lines
where there is a low level of automation and may not
have financially attractive. This case may be what
happens in SMEs; in this way, our study can be use-
ful for this industrial segment and those companies or
processes before Industry 3.0.
6 PROPOSAL
For the evaluation of a case study and Proof of
Concept (PoC), a real production environment was
chosen at the company ArcelorMittal (https://brasil.
arcelormittal.com/en) Vega located in the city of S
˜
ao
Francisco do Sul - Brazil, one of the most modern
flat steel transformation units in the world at the time
of its startup, but after years it has legacy systems.
Standing a total production capacity of 1.6 million
tons/year of pickled, cold-rolled and hot-dip coated
coils, it mainly serves the automotive, home appli-
ance, pipe production, and civil construction indus-
tries. During the analysis phase, the main automation
systems in all production lines were evaluated, includ-
ing the systems considered as ”auxiliaries”. All data
were tabulated and classified according to Table 1.
Thus, Table 4 was created, which is a sample. Other
characteristics were also evaluated (e.g., servers, con-
trollers, remotes, actuators, database, etc.).
The grouping represented in Table 4 evidenced the
most predominant characteristic is the ”Automation /
Process Monitoring” systems; therefore, this was cho-
sen for the present analysis. In quantitative terms,
23 different types of automation systems were cata-
loged, and more than one production line can have the
same system. Thus, in this case, this was counted as
just one. Within this category, approaching the vision
of industrial automation, the following characteristics
can be highlighted as essential for the types of indus-
trial processes evaluated: (i) Availability in the order
of 99.99%; (ii) Cycle time (also called ”scan”), on the
Table 4: Case Study: Fragment of Study Environment.
System Description Factory Network Protocol Category Sub-Category
CCK
Energy and utilities
monitoring system
All Ethernet TCP
Process Automation /
Process Monitoring
Eurotherm
Dew point
monitoring system
BAF, SPM
and RCL 1
Ethernet Modbus TCP, OPC
Process Automation /
Process Monitoring
Byond
Zinc ingot
management system
CGL 1 and
CGL 2
802.11
TCP, Zigbee
and MQTT
Process Automation /
Process Monitoring
AMPTEM
Cold strip mill bearing
monitoring system
TCM Ethernet Zigbee
Process Automation /
Process Monitoring
ViWPD
Vision system for online
width measurement
CGL 1 Ethernet TCP, OPC
Process Automation /
Process Monitoring
Thickness Gauge
Online coil thickness
measurement system
CPL,TCM,
CGL 1, CGL 2
and SPM
Ethernet
TCP
(IP and UDP Messages)
Process Automation /
Process Monitoring
Coating Gauge
Online coil coating
measurement system
CGL 1 and
CGL 2
Ethernet
TCP
(IP and UDP Messages)
Process Automation /
Process Monitoring
ASIS
Vision system for
online defect detection
CGL 1 Ethernet
TCP
(IP and UDP Messages)
Process Automation /
Process Monitoring
Dross Robot
Stationary robot for
zinc pot cleaning
CGL 1 and
CGL 2
Ethernet
TCP
(IP and UDP Messages),
OPC
Motion Control Machine Tool
Coil Marker
Coil marker - alphanumeric
texts and barcode
CGL 1 and
CGL 2
Ethernet
TCP
(IP and UDP Messages)
Motion Control Printing Machine
Mobile Cranes
Overhead cranes for
coil handling
PIMS 802.11
OPC,
TCP
(IP and UDP Messages),
Profibus
Mobile Control Panel
with Safety Functions
Mobile Cranes
order of 50ms; and (iii) High number of devices per
km
2
. Figure 3 shows the distribution of the categories
we observed within the analyzed industrial park.
86,8% 4,3% 4,3% 4,3%
Process Automation / Process Monitoring Motion Control / Machine - Tool
Mobile Control Panels with Safety Functions - Mobile Cranes
Motion Control / Printing Machine
Figure 3: Observed Distribution.
The data stratification presented in Table 4 in it
is a complete version and is also presented in Fig-
ure 3, describing how automation/process monitoring
stands out when compared to the others areas. In addi-
tion, the four areas of Table 1 are represented. Based
on the analyzed data, some existing systems are ad-
herent to be connected in wireless networks on the
shop floor (IEEE 802.11x), a characteristic observed
in IIoT approaches. A highlight during the data anal-
ysis was that even in a company of this size, there
are non-automated processes; and, thus, are not con-
tained in the tabulated data. Based on the analyzed
items, coil yards (in their various types) are among
the items with no monitoring systems. When analyz-
ing Figure 4, it can also be observed that the yards
have large areas and with movement or occupation of
coils. Figure 4 shows a coil dispatch yard (aka fin-
ished product), which can be found in steel mills, ser-
vice centers (e.g., coil processing), and even in cus-
tomers who purchase such reels.
One of the characteristics of the highlighted pro-
cesses that do not have any level of automation is that
they are slow processes and occupy large areas. In this
way, the LPWAN technology can contribute to this
automation, as it can cover a large area when choosing
to use LoRaWAN type networks. A process, as pre-
sented in Figure 4, has low systemic integration and
high monitoring potential, including communication
with existing PLC and with the Manufacturing Ex-
ecution System (MES) and Warehouse Management
System (WMS) system, which are systems of Level
3 systems, according to the ISA-95 model. To carry
out our Proof of Concept (PoC), the smallest infras-
IoTBDS 2023 - 8th International Conference on Internet of Things, Big Data and Security
248

Figure 4: ArcelorMittal Vega Coils Warehouse.
tructure for the point-to-point connection in a wireless
network may be the most suitable. In addition, there
are System on a Chip (SoC) type microcontrollers,
which already have the LoRa network built in, along
with the antenna and place for installing a recharge-
able battery. In terms of infrastructure for automating
this process in a traditional model, there is a need for
passing cables, assembling metallic structures and/or
mechanical structures (e.g., trays), a need to remove
interference (e.g., when it is necessary to build some-
thing of civil engineering, but cables or pipes are pass-
ing through the same place), among others. Figure 5
shows our process proposal for the PoC.
Process Diagram
Microcontroler /
Microprocessor
IIoT
Field Device
Read
(Sensors)
Field Device
Write
(Actuators)
Use Use
«Transmitter»
e.g. Lora
«Receiver»
e.g. Lora
PLC
Field Device
Read
(Sensors)
Field Device
Write
(Actuators)
Use Use
Data Exchange
OPC Server
Data Exchange Data Exchange
OPC Client
(SCADA - Runtime)
Data Exchange
Operator
(Production)
Historian
(e.g., BD,
PIMS, etc)
Data Exchange
User
(Office)
Figure 5: PoC - Process procedures - Static Vision.
Figure 5, shows a PoC using a microcontroller to
receive/send data and integration with an automation
system. The architecture includes important systems
and communication protocols such as OLE for Pro-
cess Control (OPC) Server, OPC Client, Historians,
Database, Fieldbus, etc. The use of OPC communi-
cation as middleware also opens up the possibility for
data to be sent to any part of the internal or exter-
nal network (e.g., cloud computing), as well as com-
munication to any other automation system, such as
Plant Information Management System (PIMS), Su-
pervisory, SCADA, etc. OPC communication is one
of the most used forms of communication in indus-
trial automation, but this is not the only one. For the
same proposed scenario for PoC, a socket commu-
nication (TCP or UDP), IPC, HTTP, REST, XML ,
among others, could also be used without the need for
changes to the architecture. The process proposed in
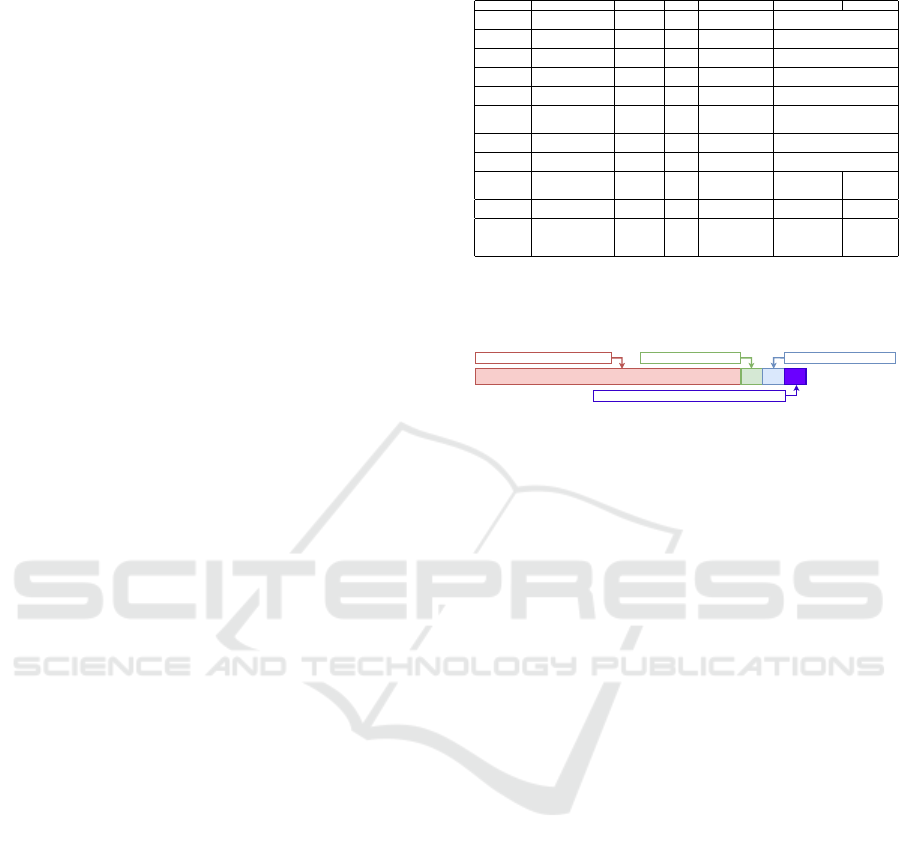
Figure 5 is the representation of the area of interest to
be developed in PoC, and which is highlighted in Fig-
ure 6. This area of interest (Section 5), in which the
focus is on communication and processing at Level
1, Level 2, and communication with Level 3 systems
according to the ISA-95 model (Table 3).
Batch
Control
Discrete
Control
Drive
Control
Process
Control
Basic
Control
Safety
Control
Supervisory
Client
Area
Supervisory
Control
Supervisory
Application
Server
PIMS
System
Engineering
Workstation
Remote
Access
Server
Site
Operations
and Control
Level 0
Level 1
Level 2
Level 3
Cell / Area
Zone
Industrial
Security
Zone
Supervisory
Client
Operator
Interface
Operator
Interface
Engineering
Workstation
Figure 6: PoC - Process architecture.
Figure 7 graphically exemplifies the sequence of
events in a process like this and the behavior of a func-
tionality, considering the interaction between all soft-
ware components and procedures related to their use.
For better visualization, each process macro is repre-
sented by the color that each ”System Level” received
in Figure 2.
It can be seen that both figures (Figure 5 and Fig-
ure 7) are adherent to the current automation pro-
cesses and that it is part of the work of (Koziolek,
2018), notations like Unified Modeling Language
(UML) are used in process automation. These repre-
sentations help to bring software developers closer to
professionals in the business areas, with the objective
of a clear understanding of the behavior that the soft-
ware and the process to which it is automated must
have.
Process Automation and Monitoring Systems Based on IIoT Using Private LoRaWAN Networks: A Case Study of ArcelorMittal Vega
Facilities
249

Loop
Shop Floor
Data is Acquired using
PLC, Fieldbus, Remote
Sensors, Traditional
Sensors and Actuators,
etc.
Level 1
Level 2
Level 3
:Device
Transmitter
(e.g. Lora)
:Device
Communication
Channel
:Device
Receiver
(e.g. Lora)
:Device
Management
:Device
OPC Server or
TCP Server
:Device
OPC Client /
SCADA
Fieldbus
Communication
is Required for
Sensors and
Actuators
scan()
:addresses
getDeviceId()
:deviceId
retrieveIIoTData()
:IIoTData
Loop
scan()
:addresses
getDeviceId()
:deviceId
retrieveIIoTData()
:IIoTData
OPC Server
or TCP Server Can Be Used as
a "Middleware" to Integrate
Upper Levels.
(e.g. Data Lake, Big Data, PIMS,
etc)
retrievePlcData()
:PlcData
Loop
scan()
:addresses
getDeviceId()
:deviceId
Loop
retrieveOPCData()
:OPCData
Figure 7: PoC - Process arquitecture - Dinamic Vision.
7 IMPLEMENTATION, RESULTS
AND ANALYSIS
7.1 Proof of Concept
To perform the PoC, the LPWAN environment was
set up using two approaches. The first concerns the
use of commercial gateways and sensors developed
by companies that integrate solutions and specialize
in IoT; and the second concerns the use of microcon-
trollers of the type SoC ESP32 models with built-in
radio LoRa that the authors of this work developed.
This gateway has access to the LoRaWAN network
of the KORE Wireless company using the platform
called KORA and access to the Microsoft Azure cor-
porate environment. To carry out this PoC Arcelor-
Mittal Vega provided the necessary equipment and re-
sources (e.g., LoRa gateway, network installation ser-
vices, etc.). The gateway was installed above the line
Continuos Galvanizing Line 1 (CGL1) at the height of
65m. The gateway received a final installation since
ArcelorMittal Vega is interested in using this tech-
nology once in another unit belonging to the same
group; this one had excellent results. This model is
connected in an automation network using Ethernet
(RJ45) cable and integration with internal antennas
GPS, LTE/4G, and LoRa Radio. If necessary, the
communication LTE/4G is used as redundancy. The
gateway is involved in a case with Ingress Protec-
tion (IP67) protection. Concerning the technical spec-
ification for LoRaWAN communication, this gateway
has 8ch RX (125kHz, multi Spreading Factor) + 1ch
RX (250KHz or 500kHz, mono Spreading Factor) +
1ch RX (FSK) to get 10ch RX + 1ch TX.
7.2 Site Survey
To determine the coverage area of ArcelorMittal
Vega, a coverage site survey procedure was carried
out with measuring devices that indicate the qual-
ity of data transmission from a device to the gate-
way. Three ESP32 micro-controllers with LoRa an-
tenna were used, one of which also had a Global Posi-
tioning System (GPS) receiver. All micro-controllers
transmitted a counter, and the one with GPS also sent
the location. The data was received by the gate-
IoTBDS 2023 - 8th International Conference on Internet of Things, Big Data and Security
250

way and transmitted to Databricks in the Microsoft
Azure environment. Once the data is stored, Mi-
crosoft PowerBI allows the creation of a map with
the entire scope and coverage capacity of the antenna
and gateway installed. To carry out this site survey,
all factories and offices were visited, including build-
ings and the underground of some factories. There
were locations where the GPS signal was lost de-
pending on the location (e.g., underground), but there
was LoRa transmission. The measurement was con-
sidered valid in these cases, and the nearest GPS lo-
cation was considered. The amount of four ESP32
micro-controllers from three different manufacturers
was used (e.g., Heltec, TTGO, and Robocore), but all
of them had a LoRa radio/shield. In addition to pre-
senting the identification of each device, information
related to Received Signal Strength Indicator (RSSI)
is also presented, which represents the quality of the
received signal (Industries, 2022), which also indi-
cates the level of power received after any possible
loss of antenna and cable, and is represented by Deci-
bel Milliwatts (dBm). The higher the RSSI value
indicates the signal strength. Information about the
Signal-to-Noise Ratio (SNR) is also presented (Indus-
tries, 2022), which is an existing relationship between
the received signal and the noise that accompanies
this signal and which is represented by values in Deci-
bels Relative to Isotropic (dBi). The lower the SNR,
the worse the communication. An important indicator
that should also be considered is the Spreading Factor
(SF). This information determines the amount of data
that can be transmitted, the period that information
will be ”over the air”, the distance reached, and others
(Pham et al., 2020). The specification of LoRaWAN
protocol includes the Adaptive Data Rate (ADR) tech-
nology. The main objective is to adjust the SF and
Transmission Power (TP) variables to balance each
device’s consumption and efficiency and include the
control of used radio channels. Table 5 shows some
characteristics of LoRaWAN technology.
Table 5: Relationship: SF, SNR, RSSI, and Payload.
SF
Required SNR
(dB)
RSSI
(min)
RSSI
(max)
Data Rate
(kbps)
Transmission
Duration
(sec)
User Payload
(Bytes)
7 -7 0 -110 5.47 0.036 230
8 -10 -110 -113 3.13 0.064 230
9 -12.5 -113 -116 1.76 0.113 123
10 -15 -116 -119 0.98 0.204 59
11 -17.5 -119 -120 0.54 0.365 59
12 -20 -120 -123 0.29 0.682 59
7.3 Scenario
The area chosen to carry out the PoC was the pro-
duction line shed called Recoiling Line (RCL)#1,
which shares the space with the finished product stor-
age yards, coil packaging, and shipping. We defined
six possible scenarios, in which several aspects were
taken into account, such as applicability, cost, finan-
cial return, security, scope, replicability, and transfor-
mation into a product after PoC, among others. The
scenario chosen can contribute to ArcelorMittal Vega
as they fully meet the company’s needs. This scenario
concerns the control of the environmental monitoring
of the coil yard because it has low automation and
because the monitored variables directly contribute to
the product’s final quality.
7.4 Scenario - Environmental
Monitoring
This scenario is for implementing the environmental
monitoring project (temperature, humidity, status of
gates, and vibration) of the coil yard shed, also called
finished product, packaging, and dispatch of coils.
The shed environment directly influences the possi-
bility of oxidation in steel coils. Thus, monitoring
and calculating the so-called ”dew point” is essential
for the product’s final quality. The coil and packaging
yard shed has four dehumidifiers to control the am-
bient humidity. However, these are turned on manu-
ally and are not monitored (only lights on the control
panel). Depending on the ambient temperature and
climatic conditions of the industrial plant, operators
decide whether to turn the dehumidifiers on/off. As
there is no online monitoring for these conditions, the
equipment can be turned on late or remain turned on
even when they need to be in operation. The mon-
itoring of temperature and humidity is done through
manual devices. Even if they go through a certifica-
tion and validation process of the Measurement Sys-
tem Analysis (MSA) type, which is a method that has
the objective of evaluating the validity of a measure-
ment system and minimizing external factors to the
equipment that can interfere with the quality of a mea-
surement and even the human factors; yet it is a man-
ual process and therefore depends on the measure-
ments being carried out at the appropriate frequen-
cies. Another aspect is that no documentary record
indicates whether the measurements were carried out
and which values were obtained. The shed gates are
another variable that can influence the environment,
and in this way, this monitoring is also essential; be-
cause with this opening, there is the entrance of tem-
perature and humidity which takes the atmospheric
balance of the internal environment. The opening and
closing of the gates occur automatically when a ve-
hicle is 1 meter away, both in the entry and exit di-
rections. Eventually, a gate may remain open due to
some problem or other need, influencing the balance.
Process Automation and Monitoring Systems Based on IIoT Using Private LoRaWAN Networks: A Case Study of ArcelorMittal Vega
Facilities
251

Crane
Transfer Coil
Transfer Coil
Transfer Coil
Goneville
Datacenter
Babitonga
Datacenter
Automation / Electrical Room
PLC
Dev
HMI.
Dev.
PLC 1 PLC 2 PLC 3
Firewall
10Gbps 10Gbps
Coil Package Zone
Uncoiler
Recoiler
Entry Shear
Exit Shear
Weld Machine
Side Trimmer
Oiler
Quality Inspection
SW. L2
PLC Weld
Machine
Gate
Gate
Office
Field Devices
(Motors, Sensors, Actuators, etc)
Field Devices
(Motors, Sensors, Actuators, etc)
Corporative
Station
Corporative
Stations
Coil
Label
Printer
Sample
Label
Printer
Weight
Scale
APP
Server
Gate
Gate
SW. L2
Legacy
Fieldbus
SCADA /
Level 2
Corporative
Station
SW. L2
PLC
Remote
PLC
Remote
Exit
Section
(External)
Entry
Section
(External)
Process
Section
(Pulpit)
Crane
PLC
Remote
PLC
Remote
SCADA /
Level 2
SCADA /
Level 2
PIMS
Server
AV
Server
DB
Server
PIMS
Server
AV
Server
DB
Server
Weld
Macheine
SW. L2
SW. L2
SW. L3
Scrap
Bucket
Scrap
Bucket
Scrap
Bucket
Scrap
Bucket
Legend
LoRaWan Gateway
LoRa End Point
Status
Status
Status
Temperature
Humity
Temperature
Humity
Temperature
Humity
Temperature
Humity
Status
Temperature
Humity
Status
Temperature
Humity
Status
Production Flow
CT07-W3-TMP1
CT07-W3-HUM1
CT07-W3-STS4
CT05-W2-TMP1
CT05-W2-HUM1
CT05-W2-STS1
CT03-W1-TMP1
CT03-W1-HUM1
CT03-W1-STS1
CT02-W1-TMP1
CT02-W1-HUM1
CT04-W2-TMP1
CT04-W2-HUM1
CT01-W1-TMP1
CT04-W1-HUM1
CT01-W1-STS1
CT01-W2-STS1
CT06-W3-STS1
GEN-GTW1
Dehumidifier 3 Dehumidifier 4Dehumidifier 1 Dehumidifier 2
Temperature
Vibration
Status
CT10-W1-TMP1
CT10-W1-VIBR1
CT10-W1-STS1
Temperature
Vibration
Status
CT09-W1-TMP1
CT09-W1-VIBR1
CT09-W1-STS1
Temperature
Vibration
Status
CT08-W1-TMP1
CT08-W1-VIBR1
CT08-W1-STS1
Temperature
Vibration
Status
CT11-W1-TMP1
CT11-W1-VIBR1
CT11-W1-STS1
Warehouse 1 - W1
Warehouse 2 - W2
Warehouse 3 - W3
Figure 8: Coil Warehouse, Package Zone, and RCL#1 - ArcelorMittal Vega.
The dew point is the temperature at which the wa-
ter vapor in the ambient air changes to a liquid state
in the form of small drops by condensation, which is
called dew (Lawrence, 2005). Integrating all the data
mentioned will contribute to better control of this yard
and reduce the possibility of generating defect arising
from oxidation that brings financial damage and the
company’s image with customers and the market. In
Figure 8, it’s possible to observe the distribution of
the gateway LoRa of the controllers and of the vari-
ous sensors that were spread out according to the ini-
tial and final distance of the yards where the stock and
packing. Figure 8 lists all the necessary hardware for
the full automation of this environment using devices
like the ones tested in PoC.
The sensors used are for measuring temperature,
humidity, the state of the gates, as well as the state
of the dehumidifiers. Each device receives an iden-
tification (tag), the same as existing in the systems
that will use this information. ArcelorMittal Vega also
acquired market sensors for monitoring dehumidifier
motors. The model chosen is from Advantech, and the
sensors are from the WISE-2410 family operating on
the LoRaWAN network. The data can be visualized
in a supervisory system (AVEVA InTouch) generat-
ing animation alarms and alerts to RCL#1 operators
through the PIMS tool as well as in a corporate net-
work through tools such as Databricks and PowerBI.
Table 6 relates all devices involved in this PoC are
shown and its tagnames.
Table 6: Scenario - Monitoring of Ambiental Enviroment.
Tagname Type Location Controler Family
GEN-GTW1 General Gateway Out of Warehouses Gateway Kerlink
CT01-W1-TMP1 Temperature Warehouse 1 CT1 ESP32
CT01-W1-HUM1 Humidity Warehouse 1 CT1 ESP32
CT01-W1-STS1 Status Warehouse 1 CT1 ESP32
CT01-W2-STS1 Status Warehouse 2 CT1 ESP32
CT02-W1-TMP1 Temperature Warehouse 1 CT2 ESP32
CT02-W1-HUM1 Humidity Warehouse 1 CT2 ESP32
CT03-W1-TMP1 Temperature Warehouse 1 CT3 ESP32
CT03-W1-HUM1 Humidity Warehouse 1 CT3 ESP32
CT03-W1-STS1 Status Warehouse 1 CT3 ESP32
CT04-W1-TMP1 Temperature Warehouse 1 CT4 ESP32
CT04-W1-HUM1 Humidity Warehouse 1 CT4 ESP32
CT05-W2-TMP1 Temperature Warehouse 2 CT5 ESP32
CT05-W2-HUM1 Humidity Warehouse 2 CT5 ESP32
CT05-W2-STS1 Status Warehouse 2 CT5 ESP32
CT06-W3-STS1 Status Warehouse 3 CT6 ESP32
CT07-W3-TMP1 Temperature Warehouse 3 CT7 ESP32
CT07-W3-HUM1 Humidity Warehouse 3 CT7 ESP32
CT07-W3-STS4 Status Warehouse 3 CT7 ESP32
CT08-W1-TMP1 Temperature Warehouse 1 CT8 Advantech
CT08-W1-HUM1 Vibration Warehouse 1 CT8 Advantech
CT08-W1-STS1 Status Warehouse 1 CT8 Advantech
CT09-W1-TMP1 Temperature Warehouse 1 CT9 Advantech
CT09-W1-VIBR1 Vibration Warehouse 1 CT9 Advantech
CT09-W1-STS1 Status Warehouse 1 CT9 Advantech
CT10-W1-TMP1 Temperature Warehouse 1 CT10 Advantech
CT10-W1-VIBR1 Vibration Warehouse 1 CT10 Advantech
CT10-W1-STS1 Status Warehouse 1 CT10 Advantech
CT11-W1-TMP1 Temperature Warehouse 1 CT11 Advantech
CT11-W1-VIBR1 Vibration Warehouse 1 CT11 Advantech
CT11-W1-STS1 Status Warehouse 1 CT11 Advantech
IoTBDS 2023 - 8th International Conference on Internet of Things, Big Data and Security
252
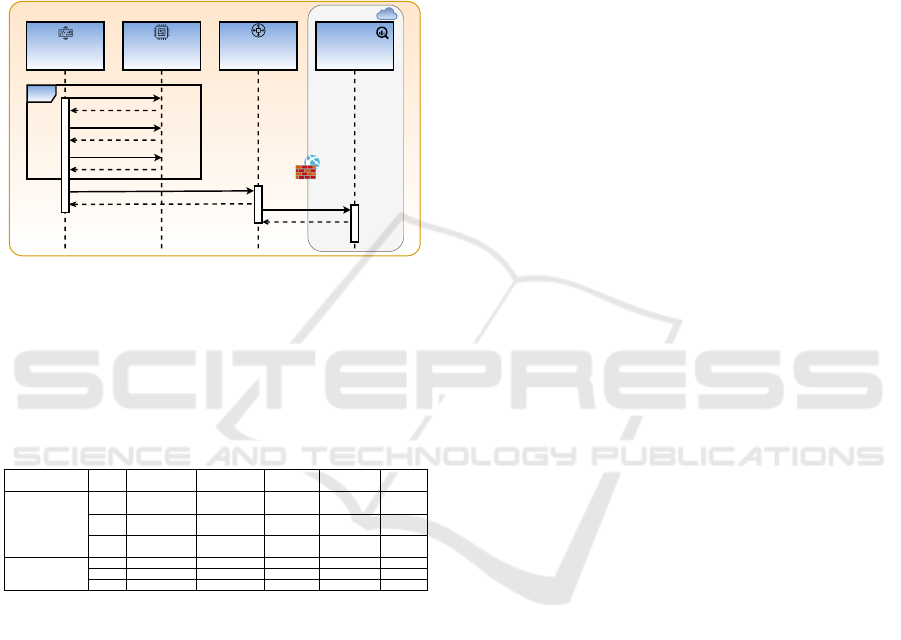
Table 6 is vital for the areas that maintain the
system and the electrical maintenance of the indus-
trial condominium, which will be responsible for re-
placing components in case of defects, predictive in-
spection, etc. After the PoC phase, a drawing of the
electrical interconnections must be generated and in-
cluded in this company’s archive department. Fig-
ure 9 shows the sequence diagram of this scenario
and how it relates to all actors, such as sensors, con-
trollers, cloud systems, etc.
:Gateway
GEN-GTW1
:Sensors :Controlers
Loop
:Azure
(Databriks,
BigData, etc)
:sendRawData()
receiveResult
scan(Status)
:resultStatus
scan(Temperature)
:resultTemperature
receiveResult
:sendTelegram()
CT01 to CT07
scan(Humity)
:resultHumity
Figure 9: Sequence Diagram - Scenario.
Figure 9 allows us to observe the integration from
the shop floor, the interconnection to the general gate-
way (GEN-GTW1), the interconnection to the corpo-
rate firewall, and the connection to Azure Data Bricks,
which is hosted in Microsoft’s computing cloud.
Table 7: Results per Family Devices.
Device Case
Sensor to Gateway
(ms)
Gateway to Cloud
(ms)
Total Latency
(ms)
Required Cycle
(ms)
Total Bytes
Advantech WISE-2410 Average 8000 3000 11000 3600000
68 + 20
2 msg
Best 5000 2000 7000 3600000
68 + 20
2 msg
Worse 22000 13000 24000 3600000
68 + 20
2 msg
ESP32 Devices Average 2000 2000 4000 600000 20
Best 1000 2000 3000 600000 20
Worse 4000 3000 7000 600000 20
Table 7 shows the values obtained in the exper-
iment in which the times were classified as mean,
best case, and worst case. For Advantech sensors,
two messages are sent, one complementing the other.
Thus, the message can only be decoded after receiv-
ing the second message. The differences in times
between Advantech and ESP32 devices can be ex-
plained precisely by the size and need of the comple-
ment message. The monitored processes are consid-
ered slow; therefore, the total latency is perfectly ac-
cepted since the sending frequencies are in the order
of 10 minutes (temperature and humidity) and 01 hour
(vibration). The status of the gates occurs by even-
tual opening, and there is no real-time requirement
but storage. It can be concluded that all times ob-
tained were satisfactory for the experiment and con-
firms the data of Table 1 for the category ”Process
Monitoring” (Brown et al., 2018).
8 CONSIDERATIONS & FUTURE
WORK
One of the challenges for implementing systems
based on IoT and IIoT on the shop floor is to identify
the ideal technology for each organization’s require-
ments. Thus, this implies elaborating a detailed analy-
sis of the cost-benefit ratio compared to the objectives
to be achieved. Therefore, a clear specification ad-
dresses the life cycle of the data from the generation
on the shop floor (e.g., sensors, actuators, etc.) to the
level of relevance of the information generated, with
the desired degree of reliability. The use of LPWAN
technologies, such as LoRaWAN, create new possi-
bilities for an organization to modernize its processes
and allowing to ingress under the Industry 4.0 level.
Moreover, it can mean lowering the cost of automat-
ing processes in companies without a minimally mod-
ern or technological park, especially in cases where
speed is not a strong technical requirement. Geo-
graphically distant areas are also strong candidates for
adopting an LPWAN technology. It may also mean
greater adoption of Software as a Service (SaaS) tech-
nologies, as small IoT and IIoT devices can integrate
from the shop floor to a system hosted in some cloud,
e.g., Amazon AWS, Microsoft Azure, Google, etc.
Future works, complains a project for the adop-
tion/conversion of the PoC to industrialization us-
ing more robust hardware and system entry into pro-
duction. Despite this, the potential we observed is
promising, and a PoC in a real environment such as
the one proposed can contribute to a greater adhesion
of IoT technologies on the shop floor for the category
of ”Automation / Monitoring of Processes”. Another
future work comprises three more scenarios using the
same infrastructure, intended to evaluate the opera-
tional limits and performances related to the number
of sensors, transmission rates, and density per gate-
way and antenna.
ACKNOWLEDGEMENTS
This work was supported by FAPESC,
LabP2D/UDESC, and ArcelorMittal Vega.
This work received financial support from the Co-
ordination for the Improvement of Higher Education
Personnel - CAPES - Brazil (PROAP-AUXPE/PDPG
CONSOLIDACAO 3-4).
Process Automation and Monitoring Systems Based on IIoT Using Private LoRaWAN Networks: A Case Study of ArcelorMittal Vega
Facilities
253

REFERENCES
Artemenko, A. (2021). Keynote: Advances and challenges
of industrial iot. In 2021 IEEE International Con-
ference on Pervasive Computing and Communications
Workshops and other Affiliated Events (PerCom Work-
shops), page 526–526.
Autor, D. H. (2015). Why are there still so many jobs? the
history and future of workplace automation. Journal
of Economic Perspectives, 29(3):3–30.
Brown, G. et al. (2018). Ultra-reliable low-latency 5G
for industrial automation. Technol. Rep. Qualcomm,
2:52065394.
Cheng, J., Chen, W., Tao, F., and Lin, C.-L. (2018). In-
dustrial iot in 5g environment towards smart manufac-
turing. Journal of Industrial Information Integration,
10:10–19.
Choi, H., Song, J., and Yi, K. (2018). Brightics-iot: To-
wards effective industrial iot platforms for connected
smart factories. In 2018 IEEE International Confer-
ence on Industrial Internet (ICII), page 146–152.
Choubey, S., Benton, R., and Johnsten, T. (2019). Pre-
scriptive equipment maintenance: A framework. In
2019 IEEE International Conference on Big Data (Big
Data), page 4366–4374.
Colombo, A. W., Karnouskos, S., Yu, X., Kaynak, O.,
Luo, R. C., Shi, Y., Leitao, P., Ribeiro, L., and
Haase, J. (2021). A 70-year industrial electronics
society evolution through industrial revolutions: The
rise and flourishing of information and communica-
tion technologies. IEEE Industrial Electronics Maga-
zine, 15(1):115–126.
Da Xu, L., He, W., and Li, S. (2014). Internet of things in
industries: A survey. IEEE Transactions on industrial
informatics, 10(4):2233–2243.
Flores, P., Moscoso-Martinez, M., Minchala, L. I.,
Vazquez-Rodas, A., and Astudillo-Salinas, D. (2018).
A simple reliable wireless bus design for home au-
tomation systems. In 2018 IEEE XXV International
Conference on Electronics, Electrical Engineering
and Computing (INTERCON), page 1–4.
Giorgetti, G., Gambi, E., Spinsante, S., Baldi, M.,
Morichetti, S., and Magnifico, I. (2008). An integrated
solution for home automation. In 2008 IEEE Inter-
national Symposium on Consumer Electronics, page
1–4.
Hassan, Q. F. (2018). Environment, People, and Time as
Factors in the Internet of Things Technical Revolution,
page 51–76. IEEE.
Hood, G. W. (2015). Industry standard models for de-
sign/discussion of manufacturing systems. In 2015 5th
Australian Control Conference (AUCC), page 12–15.
Industries, T. T. (2022). Rssi and snr.
Iyer, A. (2018). Moving from industry 2.0 to industry 4.0:
A case study from india on leapfrogging in smart man-
ufacturing. Procedia Manufacturing, 21:663–670.
Jayalaxmi, P., Saha, R., Kumar, G., Kumar, N., and Kim,
T.-H. (2021). A taxonomy of security issues in in-
dustrial internet-of-things: Scoping review for exist-
ing solutions, future implications, and research chal-
lenges. IEEE Access, 9:25344–25359.
Koziolek, H. (2018). Software architecture in process au-
tomation: Uml & the “smart factory”.
Lawrence, M. G. (2005). The relationship between relative
humidity and the dewpoint temperature in moist air:
A simple conversion and applications. Bulletin of the
American Meteorological Society, 86(2):225–234.
Li, C., Mantravadi, S., and Møller, C. (2020). Aau open
source mes architecture for smart factories – exploit-
ing isa 95. In 2020 IEEE 18th International Con-
ference on Industrial Informatics (INDIN), volume 1,
page 369–373.
Lin, J., Shen, Z., and Miao, C. (2017). Using blockchain
technology to build trust in sharing LoRaWAN IoT.
In Proceedings of the 2nd International Conference
on Crowd Science and Engineering, pages 38–43.
MATTIOLI, J., PERICO, P., and ROBIC, P.-O. (2020). Im-
prove total production maintenance with artificial in-
telligence. In 2020 Third International Conference
on Artificial Intelligence for Industries (AI4I), page
56–59.
Mekki, K., Bajic, E., Chaxel, F., and Meyer, F. (2019). A
comparative study of LPWAN technologies for large-
scale iot deployment. ICT express, 5(1):1–7.
Mohamed, M. (2018). Challenges and benefits of industry
4.0: An overview. International Journal of Supply and
Operations Management, 5(3):256–265.
NetSuite (2020). Iiot & manufacturing.
Pham, C., Bounceur, A., Clavier, L., Noreen, U., and Ehsan,
M. (2020). Radio channel access challenges in lora
low-power wide-area networks. In LPWAN Technolo-
gies for IoT and M2M Applications, pages 65–102.
Elsevier.
Pilsan, H. O., Amann, R., and Gerstenberg, M. (2019). Re-
alization of a small iiot node: A greenfield approach.
In 2019 20th International Conference on Research
and Education in Mechatronics (REM), page 1–5.
Powell, D., Riezebos, J., and Strandhagen, J. O. (2013).
Lean production and erp systems in small- and
medium-sized enterprises: Erp support for pull pro-
duction. International Journal of Production Re-
search, 51(2):395–409.
Reinsel, D., Gantz, J., and Rydning, J. (2018). The digiti-
zation of the world from edge to core.
Sauter, T., Soucek, S., Kastner, W., and Dietrich, D.
(2011a). The evolution of factory and building au-
tomation. IEEE Industrial Electronics Magazine,
5(3):35–48.
Sauter, T., Soucek, S., Kastner, W., and Dietrich, D.
(2011b). The evolution of factory and building au-
tomation. IEEE Industrial Electronics Magazine,
5(3):35–48.
Technologies, M. (2019). 6 challenges for industrial iot.
Wollschlaeger, M., Sauter, T., and Jasperneite, J. (2017).
The future of industrial communication: Automation
networks in the era of the internet of things and in-
dustry 4.0. IEEE industrial electronics magazine,
11(1):17–27.
IoTBDS 2023 - 8th International Conference on Internet of Things, Big Data and Security
254
