
Performance of a K-Means Algorithm Driven by Careful Seeding
Libero Nigro
a
and Franco Cicirelli
b
1
Engineering Department of Informatics Modelling Electronics and Systems Science, University of Calabria, Rende, Italy
2
CNR-National Research Council of Italy–Inst. for High Performance Computing and Networking (ICAR), Rende, Italy
Keywords: K-Means Clustering, Seeding Procedure, Greedy K-Means++, Clustering Accuracy Indexes, Java Parallel
Streams, Benchmark and Real-World Datasets, Execution Performance.
Abstract: This paper proposes a variation of the K-Means clustering algorithm, named Population-Based K-Means (PB-
K-M
EANS
), which founds its behaviour on careful seeding. The new K-Means algorithm rests on a greedy
version of the K-Means++ seeding procedure (g_kmeans++), which proves effective in the search for an
accurate clustering solution. PB-K-M
EANS
first builds a population of candidate solutions by independent
runs of K-Means with g_kmeans++. Then the reservoir is used for recombining the stored solutions by
Repeated K-Means toward the attainment of a final solution which minimizes the distortion index. PB-K-
M
EANS
is currently implemented in Java through parallel streams and lambda expressions. The paper first
recalls basic concepts of clustering and of K-Means together with the role of the seeding procedure, then it
goes on by describing basic design and implementation issues of PB-K-M
EANS
. After that, simulation
experiments carried out both on synthetic and real-world datasets are reported, confirming good execution
performance and careful clustering.
1 INTRODUCTION
K-Means (Lloyd, 1982) (MacQueen, 1967) (Jain,
2010) is a classical clustering algorithm very often
used, for its simplicity and efficiency, in such data
analysis and pattern recognition application domains
as image segmentation, text analysis, medicine,
bioinformatics, machine learning and so forth.
The goal of K-Means is to optimize partitioning
data points
, e.g.
, in
groups (clusters) in such a way that points in a same
cluster are similar to one another, and points in
different clusters are dissimilar. The similarity is
often expressed by the Euclidean distance. Each
cluster has a representative point which is its centre
or centroid. K-Means aims to minimize the Sum-of-
Squared Errors () cost (see later for details), also
said the distortion index (a sort of internal variance in
clusters).
In the last years, K-Means properties were
thoroughly studied (Fränti & Sieranoja, 2018,
2019)(Vouros et al., 2021). A critical issue is the
initialization of centroids (seeding procedure), which
a
https://orcid.org/0000-0001-6577-4777
b
https://orcid.org/0000-0002-6138-5739
can significantly affect the quality of the clustering
solution. However, fundamental is its local strategy
of management of centroids which implies K-Means
often gets stuck in a local sub-optimal solution. More
sophisticated clustering algorithms like Random
Swap (Fränti, 2018)(Nigro et al., 2023)
and genetic/evolutionary approaches (Fränti,
2000)(Baldassi, 2020, 2022a), try to remedy this
situation by adopting a global strategy of centroids
evolution, which can favour the achievement of a
solution close to the optimal one, although with a
greater computational cost.
This paper proposes Population-Based K-means
(PB-K-M
EANS
) which borrows ideas from Random
Swap and the evolutionary algorithm underlying
Recombinator-K-Means (Baldassi, 2020, 2022a).
Similarly to Recombinator-K-Means, an initial
population of representative centroid solutions is
built, by running classical K-Means together with the
Greedy K-Means++ (g_kmeans++) (Celebi et al.,
2013)(Baldassi, 2020, 2022a) seeding, which has
been proved to be effective in generating careful
(from the point of view of the cost)
configurations of centroids which are locally refined
Nigro, L. and Cicirelli, F.
Performance of a K-Means Algorithm Driven by Careful Seeding.
DOI: 10.5220/0012045000003546
In Proceedings of the 13th International Conference on Simulation and Modeling Methodologies, Technologies and Applications (SIMULTECH 2023), pages 27-36
ISBN: 978-989-758-668-2; ISSN: 2184-2841
Copyright
c
2023 by SCITEPRESS – Science and Technology Publications, Lda. Under CC license (CC BY-NC-ND 4.0)
27

by K-Means. Then, in the same logic of Random
Swap (Fränti, 2018)(Nigro et al., 2023), K-Means
with g_kmeans++ is repeatedly executed upon the
population of solutions, thus combining centroids
belonging to different solutions, until a satisfying
solution minimizing the cost is achieved. As in
Random Swap, the more is the number of repetitions,
greater is the chance of picking a combined solution
close to the optimal one.
To cope with the potential inefficiency when
dealing with large datasets, PB-K-M
EANS makes a
systematic use of parallelism. The tool is currently
implemented in Java using parallel streams and
lambda expressions (Nigro, 2022)(Urma et al., 2018),
thus is capable of exploiting the computing potentials
of today’s multi/many-core machines.
The paper reports the experimental results of
applying PB-K-M
EANS to synthetic and non-
synthetic datasets. The simulation results confirm that
PB-K-M
EANS can ensure reliable clustering and good
execution performance.
The paper is organized as follows. Section 2 gives
a review of the background work concerning K-
Means and the role of the seeding methods. The
section also covers basic concepts of Random Swap
and Recombinator K-Means, as well as some external
indexes often used to evaluate the quality of a
clustering. Section 3 describes the PB-K-Means
algorithm together with some implementation issues
in Java. Section 4 proposes an experimental setup for
PB-K-Means, composed of challenging synthetic and
real-world datasets, and the results gained by
practical applications of the tool. The time efficiency
of the new algorithm is demonstrated too. Finally,
conclusions are presented with an indication of on-
going and future work.
2 BACKGROUND
The following gives a summary of basic concepts of
clustering by K-Means (Lloyd, 1982) (MacQueen,
1967) (Jain, 2010) (Vouros et al., 2021), Random
Swap (Fränti, 2018) (Nigro et al., 2023) and
Recombinator-K-Means (Baldassi, 2020, 2022a)
which have influenced the design of the algorithm
proposed in this paper.
2.1 K-Means
The classical version of K-Means is the so-called
Lloyd’s algorithm illustrated in Alg. 1. In step 1, the
initial centroids are defined by a seeding procedure
(e.g., random).
Step 2 creates partitions of points according to
current centroids. Each point
is assigned to the
cluster
identified by nearest centroid
:
where
denotes the Euclidean distance
between
and
. In step 3, centroids are updated as
the mean point of each cluster:
Steps 2 and 3 are iterated until a termination criterion
is met. For example, when the new centroids
almost “coincide” with previous ones
, within
a certain numeric tolerance, convergence is reached
and K-Means can terminate. Otherwise, termination
follows after a maximum number of iterations have
been executed.
Algorithm 1: The Lloyd’s K-Means.
Input: the dataset and the number of clusters .
Output: final centroids and associated points partition.
1. Initialize centroids by some method (e.g., random).
2. Assign points of to clusters according to the nearest
centroid.
3. Update centroids as the mean point of each cluster.
4. Chec
k
termination. If not termination, re
p
eat from 2.
An execution of K-Means aims at minimizing the
cost:
Practically, the normalized mean of , that is
, can be used:
It is worthy of note the difficulty, in general, of
optimizing the , due to its highly
non-convex character. Clustering solutions are then,
necessarily, approximations of the optimal solution.
2.2 Seeding Methods
Centroids should be initialized (Fränti & Sieranoja,
2018, 2019) (Vouros et al, 2021) so as to not coincide
with outliers or noise points. Moreover, centroids
should be far away from each other in order to avoid
splitting, wrongly, a big cluster into multiple smaller
clusters. Different ways exist to initialize centroids,
as reported in the following.
SIMULTECH 2023 - 13th International Conference on Simulation and Modeling Methodologies, Technologies and Applications
28

Random. Random seeding is the usual default choice.
In this case, centroids are initialized by uniform,
randomly selecting K points of the dataset X:
Of course, a random selection does not ensure any
property of centroids and cost minimization. Only in
the case centroids are chosen near to the ideal
position, the solution gets close to the optimal one.
Therefore, using K-Means with random seeding
normally requires the algorithm to be repeated a
certain number of times (Repeated K-Means) so as to
select, in the end, the solution which minimizes the
cost.
K-Means++. It defines centroids incrementally
(Arthur & Vassilvitskii, 2007), as indicated in the
Alg. 2. Let
be the minimal distance of point
from the currently defined centroids, .
Algorithm 2: The K-Means++ seeding.
1. Define the first centroid in a random way:
2. Associate to each point
the probability of being
chosen as the next centroid as:
Next centroid is a point
, not previously chosen,
selected probabilistically by a random switch based
on the values of
3. If , repeat from step 2.
K-Means++ tends to distribute more evenly the
centroids in the data space, and guarantees centroids
are selected far away from each other.
Greedy K-Means++ (g_kmeans++). It is an
improvement (Celebi et al., 2013) (Baldassi, 2020,
2022a) of K-Means++, shown in Alg. 3.
At each step of a centroid selection, attempts are
made so as to ensure the next candidate centroid is not
only distinct and far away from previously chosen
points, but it will contribute to minimal cost
increment (the greedy step) in the centroid
configuration.
In this work, as in (Baldassi, 2020), the adopted
value of the parameter is
, which is a
trade-off between the improved seeding and the extra
computational cost.
Algorithm 3: The Greedy_K-Means++ seeding.
It should be noted that, despite its careful seeding,
g_kmeans++ has a greater computational cost than K-
Means++ and, as always, it cannot guarantee that
selected centroids hit the optimal ones. A side benefit,
though, experimentally observed, is that specific
centroids, here called “exemplars”, in different
configurations/runs, can thicken around the optimal
centroid positions (ground truth). This property can
purposely be exploited to improve clustering.
2.3 Random Swap
The K_Means behaviour is constrained by its initial
seeding. Centroids are then refined by a local
strategy. A typical example occurs when, e.g.,
multiple centroids are wrongly associated with a same
big cluster which is well-separated from smaller
clusters. The former centroids are unable to move to
a smaller cluster which is without a centroid. More in
general, centroids cannot move between clusters far
away (Fränti & Sieranoja, 2019). What should be
required is a global strategy to drive centroids
management.
Random Swap (Fränti, 2018) initializes centroids
by random seeding. Then it makes a given number of
swap iterations. At each swap, a centroid is randomly
chosen which gets replaced by a randomly selected
point in the dataset:
If the new centroid configuration, locally refined
by a few K-Means iterations, implies a lesser
cost than the previous configuration, it becomes
current, and the algorithm continues with the next
swap iteration. Otherwise, the previous configuration
Performance of a K-Means Algorithm Driven by Careful Seeding
29

and partitioning are restored and a new swap is
started.
For its modus operandi, Random Swap can
naturally explore all the data space and then is
capable, with a suitable number of iterations, of
finding a solution close to the optimal one in practical
cases (Nigro et al., 2023).
2.4 Recombinator K-Means
It is based on an evolutionary algorithm (Baldassi,
2022a) which maintains a population of individuals
(configurations), initialized to the whole dataset. New
generations are then created by a recombination
mechanism followed by a local optimization through
K-Means as in Random Swap, until a convergence
criterion is met.
More in particular, at each generation, first
centroid configurations (solutions) are created by
executing times K-Means with g_kmeans++
seeding (in reality, an adapted version of
g_kmeans++ with a weighting mechanism is actually
used). Each individual centroids configuration,
refined by a few iterations of Lloyd’s K-Means, is
kept along with its cost. Finally, the population
is updated by keeping just the best solutions,
according to their cost, which emerge among
previous and newly generated solutions.
Weights, initialized by a uniform vector, mirror
priorities tied to configurations costs, which are
updated after each generation, to drive the selection
process of the next centroid in g_kmeans++.
The net effect of processing a generation is to
(re)combine centroid points of different solutions, so
as to compose new solutions with a lower cost.
The approach ensures that the average cost of
the population monotonically decreases with the
advancement of generations, with the population
which eventually coalesces to a single solution thus
providing a natural stopping criterion.
Recombinator K-Means is implemented in Julia
and has been successfully applied to both synthetic
and non-synthetic datasets.
2.5 Accuracy Clustering Indexes
Besides the internal cost, often the quality of a
clustering solution can also be checked by some
external measure. An important measure is the
Cluster Index () proposed in (Fränti et al., 2014). It
captures the dissimilarity between two centroid
solutions. The use of is effective when, e.g., a
synthetic dataset provided of ground truth
information (centroids and/or partitions) is
considered.
The expresses the degree by which an achieved
solution is close to the . Formally, each centroid
in is mapped onto the centroid point of which
has minimal distance from . Dissimilarity is then
computed by the number of points in (“orphans”)
upon which no point of is mapped on.
In a similar way, is mapped onto and the
number of orphans in is then counted. The
value is the maximum number of orphans
in the two ways of mapping. Of course, a is a
precondition for a “correct” clustering solution, that
is one which is structurally near to .
When partitions (labels) are provided as ground
truth (Fränti & Rezaei, 2016), the Jaccard distance
(Nigro et al., 2023) between two partitions can be
used for mapping and counting the orphans.
Obviously, non-synthetic datasets are normally
without ground truth. Anyway, it can happen that a
“golden” solution obtained by using some
sophisticated clustering algorithm can exist, thus
allowing checking the accuracy, through the , of a
particular solution achieved by using a specific
algorithm.
3 PB-K-MEANS
The design of Population-Based K-Means (PB-K-
Means) proposed in this paper (see Alg. 4), was
inspired by Recombinator K-Means (Baldassi, 2020,
2022a). However, the following are key differences
between the two algorithms. PB-K-Means rests on the
basic g_kmeans++ seeding (see Alg. 3). In addition,
the evolutionary iterations are simply realized by
Repeated K-Means executions always fed by
g_kmeans++.
The Alg. 4 gives a sketch of the two steps of PB-
K-Means which depend on two parameters: which
is the number of required candidate solutions to
initialize the population from the dataset , and
which is the number of repetitions of K-Means with
g_kmeans++ toward the identification of a final
solution. The notation run(K-Means, g_kmeans++,
X)
indicates that K-Means, with g_kmeans++ seeding, is
applied to the points of the entire dataset . In the step 2,
K-Means with g_kmeans++ is applied to the solution
points in the population . The cost is instead
computed on the dataset points just partitioned
according to cand (candidate solution or centroids
configuration) by K-Means.
SIMULTECH 2023 - 13th International Conference on Simulation and Modeling Methodologies, Technologies and Applications
30

Algorithm 4: The PB-K-Means Operation.
1. .
++
2.
++,
}
}
From the g_kmeans++ seeding, each solution
found in the step 1 has, in general, few chances to hit
the optimal solution but, as anticipated in section
2.1.1, it can contain “exemplars”, that is centroids
close to the optimal ones. Exemplars in different
solutions tend to accumulate in dense regions around
ground truth centroids. In the step 2, an exemplar in a
peak has a probability of being selected by
g_kmeans++ which depends on the numerosity of the
dense area. On the other hand, when one such an
exemplar is chosen, the probability of selecting as
next centroid a point in the same peak area or in its
nearness is very low because g_kmeans++ ensures
centroid candidates are far away from each other. As
a consequence, the repetitions in step 2 have good
chances of finding a solution close to the optimal one
in many practical cases (see later in this paper).
The values of and depend on the handled
dataset. Roughly speaking, in many cases does not
need a high value since the careful seeding ensured
by g_kmeans++. On the other hand, the more are the
repetitions, the greater is the probability of hitting
a solution close to the optimal one.
When applying PB-K-Means to some challenging
datasets, the clustering accuracy can possibly be
improved by generating the population of solutions
each one extracted as the best one in a batch of few
repetitions.
3.1 Implementation Issues
Current Java implementation of PB-K-Means aims at
fulfilling the challenging goal of enabling parallel
execution of as many as possible recurrent operations,
including the partitioning and the centroids update
steps of K-Means (see Alg. 1), the calculation of the
cost, the underlying operations of
g_kmeans++ and so forth. Toward this, parallel
streams and lambda expressions (Urma et al., 2018)
(Nigro, 2022) (Nigro et al., 2023) are used.
A parallel stream is managed by the fork/join
mechanism which enables an array/collection like the
dataset, the population, the centroids vector and so
forth, to be split into multiple segments, to spawn
separate threads for the independent processing of the
various segments and, finally, to combine the results
provided by the threads. Lambdas expressions are the
functional units which specify, in a compact and
effective way, the operations to accomplish on a data
stream.
The use of such popular parallelism can be easy to
use in the practical case, but it requires the designer
to absolutely avoid the use of shared data in lambda
expressions which could introduce subtle data
inconsistency problems thus making useless results.
PB-K-Means supporting classes include a
fundamental class which exposes such global data
as (numerosity of the dataset), (number of
dimensions of data points), (number of
clusters/centroids), (accuracy degree of
g_kmeans++), (population size), (number of runs
of Repeated K-Means), as well as the available
seeding methods, and the external names and
corresponding methods for the dataset, ground truth,
population and so forth to load. The helper
class supports common operations like
the Euclidean distance, provides some reference
methods (equivalent to lambda expressions) used by
point stream operations and so forth.
To give an idea of the actual Java programming
style, the Alg. 5 portrays an excerpt of the
kmeans++/g_kmeans++ methods, which concerns the
calculation of the common denominator (see Alg. 2)
of the probabilities of points in the dataset to be
selected as the next centroid. Similar calculations
occur when processing the population.
First a stream (a view, not a copy) is
extracted from the dataset. The value of the
parameter allows to distinguish if
has be operated in parallel or not. For
demonstration purposes, the following assumes
.
Performance of a K-Means Algorithm Driven by Careful Seeding
31

Algorithm 5: An excerpt of kmeans++/g_kmeans++.
…
final int l=L;
Stream<DataPoint> pStream=
(PARALLEL) ? Arrays.stream(dataset).parallel() :
Arrays.stream(dataset);
DataPoint ssd=pStream //sum of squared distances
.map( p->{
p.setDist(Double.MAX_VALUE);
for( int k=0; k<l; ++k ) { //existing centroids
double d=p.distance(centroids[k]);
if( d<p.getDist() ) p.setDist(d);
}
return p; } )
.reduce( new DataPoint(), DataPoint::add2Dist,
DataPoint::add2DistCombiner );
double denP=ssd.getDist();
//common denominator of points probability
…
//random switch
…
The intermediate operation on
processes in parallel the points of the dataset, by
storing into each point its minimal distance to
existing centroids (from ). This is realized as part
of the lambda expression of the
operation.
The fact that each point only modifies itself is
worthy of note, because it avoids modifications of any
shared data.
The operation returns a new stream which is
operated by the terminal operation. It is
that concretely starts the parallel processing
which includes the executions. The
operation asks the underlying threads to add, squared,
the point distances as part of the reference method
add2Dist of the class. The partial results
of the threads are finally combined, by the reference
method of , by adding
them and returning a new , whose
distance field holds the final calculation.
The calculations in Alg. 5 are then followed by a
random switch based on the point probabilities, which
actually selects the (not already chosen) next
centroid.
4 EXPERIMENTAL SETUP
It has been noted in (Fränti & Sieranoja, 2018, 2019)
that K-Means is well-suited to clustering regular
datasets with spherical clusters, and that the quality of
the clustering improves as the overlapping degree
increases. Cluster overlapping, indeed, facilitates
centroids movement during the iterations.
This paper argues that K-Means, and also PB-K-
Means, are more effective when dealing with datasets
where good clustering corresponds to the
minimization of the cost. Therefore, a more
approximate solution is to be expected when the
clustering quality does not follow the cost
minimization.
In the following PB-K-Means is applied to two
classes of datasets: synthetic (benchmark) and non-
synthetic or real-world datasets. Benchmark datasets
(Repository, 2023) are shown in Table 1. They all
come with ground truth centroids, except for the
worms cases which have instead ground truth
partitions (labels). Differently from (Baldassi, 2020,
2022a), data are processed in the original unscaled
format. A description of the used datasets follows.
contains 2-d points distributed around
50 spherical clusters. contains 5000 2-d points
distributed in 15 Gaussian clusters with moderate
overlap.
Table 1: Synthetic datasets selected for the experiments
(Repository, 2023).
is a high-dimensional dataset with
1024 points and 16 well-separated Gaussian clusters.
admits 6500 2-d points distributed in 8
Gaussian clusters organized in two well-separated
groups respectively of 2000 and 100 points per
cluster.
Figure 1: The dataset (Repository, 2023).
datasets contain 10
5
2-d points which are
distributed into 100 clusters organized on a 10x10
grid (), or according to a sine curve ()
or in an irregular way in (see Fig. 1).
SIMULTECH 2023 - 13th International Conference on Simulation and Modeling Methodologies, Technologies and Applications
32
and have spherical clusters of the same size.
is very challenging because clusters have a
random size and occupy random locations.
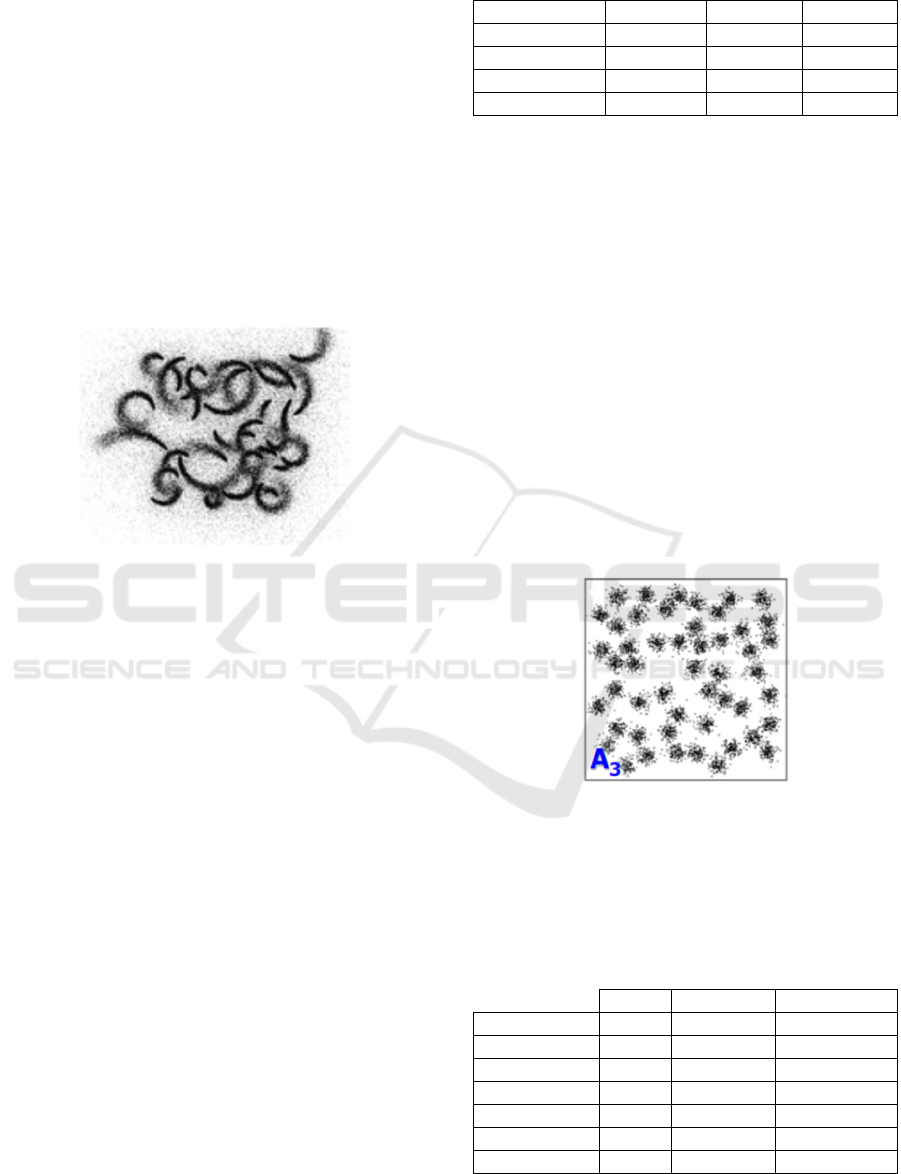
Also challenging are the chosen two worm-
shaped datasets. (see Fig. 2) contains 35
individual clusters in 2-dimensional space.
contains 25 clusters in 64-dimensional
space.
The worm shapes start at a random position and
move in a random direction. At each step, points are
drawn from a Gaussian distribution whose variance
increases gradually with each step. The direction of
movement is continually altered to an orthogonal
direction. In the case, the orthogonal direction is
randomly selected at each step.
Figure 2: The dataset (Repository, 2023).
The group of real-world datasets used for checking
the PB-K-Means behaviour, is listed in Table 2. All
of them refer to image data processing. They
characterize by their high dimensionality and/or the
high number of required clusters.
The dataset (non-binarized version), the
dataset (8 bits per color version), and the
dataset (frame 1 vs 2 version) were
downloaded from the (Repository, 2023) web site.
These datasets come without ground truth
information.
The dataset, from AT&T Laboratories
Cambridge, represents a facial recognition case. It
consists of human subjects of which different
poses are available. Each image is coded as
pixels. The tested version is provided
with ground truth information (both centroids and
partition labels).
All the execution experiments were carried out on
a Win11 Pro, Dell XPS 8940, Intel i7-10700 (8
physical cores + 8 virtual ones), CPU@2.90 GHz,
32GB Ram, Java 17.
Table 2: Real-world datasets selected for the experiments.
4.1 A First Example
As a first case, the dataset (see Table 1) was
chosen to compare the performance of PB-K-Means
to that achievable using classical Repeated K-Means
under different seeding.
was first investigated by Repeated K-Means
separately using Random
K-
Means++
and Greedy K-Means++
seeding.
K-Means was repeated 10
4
times and the minimal
value of the cost
and the
corresponding value (
), the minimal
value of the (
) and the corresponding value
of the cost (
), the average ()
value and the , that is the number of runs
in which a was sensed divided by 10
4
, were
observed.
Figure 3: The synthetic dataset (Repository, 2023).
For completeness, the Parallel Execution Time ()
in msec, required by Repeated K-Means to terminate
its runs was also measured. Results are collected in
Table 3.
Table 3: Experimental results about the dataset.
Performance of a K-Means Algorithm Driven by Careful Seeding
33

Table 5: PB-K-Means results on the synthetic datasets in Table 1.
1.69E9 0 0 1.69E9 0 100%
0.26 0 0 0.26 0 100%
1.65E7 0 0 1.65E7 0 100%
4.64E8 0 0 4.64E8 0 100%
2.26E6 0 0 2.28E6 0 100%
1.86E8 12 11 1.87E8 13.29 0%
1.75E4 8 6 1.77E4 7.7 0%
2.14E6 0 0 2.14E6 0.95 6%
As one can see from Table 3, the use of g_kmeans++
seeding makes it possible for to outperform the
cases where kmeans++ or the random seeding are
adopted. Revealing are the estimates of the average
and of the It is confirmed, in all the
three cases, that for the , the minimum value of the
always occurs at the minimum of the cost.
The results in the column of
coincide
with the results documented, e.g., in (Baldassi, 2020)
(Nigro et al., 2023).
Table 4 reports the results observed when using
PB-K-Means, e.g., with and for the
first step (see Alg. 4), and for the second step.
For the first step, which builds the population of
solutions, only the was annotated. The results of
the second step indicate that PB-K-Means fully solves
the dataset because there is a success-rate of
100% and the value of is always 0.
The minimal
value of is the same as in the
case.
Table 4: PB-K-Means results on the dataset.
, (
Table 4 also shows the time efficiency of PB-K-
Means with respect to the brute-force approach of
Repeated K-Means (see Table 3).
4.2 Synthetic Datasets Results
Table 5 collects the experimental results observed
when applying PB-K-Means to the synthetic datasets
introduced in Section 4 (see Table 1). All these
datasets have a of when clustered
with classical K-Means, as also documented in
(Fränti & Sieranoja, 2018).
The , and datasets were
studied with PB-K-Means by using and
for the first step (single executions of K-Means with
g_kmeans++ seeding), and for the second
step (see Alg. 4). The remaining, more challenging,
datasets were analyzed by using with
for the first step (each one of the solutions emerges
as the best one in a batch of executions), and
for the second step.
Except for the and , all the
other synthetic datasets have the lowest value of
(which is synonymous of “correct” clustering) at the
minimal cost. and are
examples of datasets where good clustering does not
follow from the optimization of . This property
is explored in more detail with Random Swap in
(N23).
All the obtained results for and
datasets agree with similar results
reported in (Nigro et al., 2023) and (Sieranoja &
Fränti, 2019). For example, in (Sieranoja & Fränti,
2019), using a powerful and efficient clustering
algorithm based on density peaks (Rodriguez & Laio,
2014) (Nigro & Cicirelli, 2022), an average value of
was predicted for the value on .
In (Nigro et al., 2023) it is discussed as
, although the higher dimensionality,
can be correctly clustered by Random Swap. The
same result was achieved by PB-K-Means as shown
in Table 5.
4.3 Real-World Datasets Results
For each real-word dataset in Table 2, the minimal
cost was measured by applying PB-K-Means
with and for the first step, and
for the second step.
The results are reported in Table 6, and are in good
agreement with similar results available in (Baldassi,
SIMULTECH 2023 - 13th International Conference on Simulation and Modeling Methodologies, Technologies and Applications
34

2020), where the cost was
adopted.
Table 6: PB-K-Means results for the real-world datasets in
Table 2 - ( ) for the first step, and for
the second step.
For the dataset, which is equipped of ground
truth information, a of , a at
the minimum value of , a minimum
value which occurs at the of about , and
an average value of about , were measured.
4.4 Time Efficiency
The computational efficiency of PB-K-Means
was checked, in a case, on the non-synthetic
dataset (see Table 2) using a
population of solutions, and by runs of
the second step of the algorithm (see Alg. 4),
separately in parallel (parameter
and in sequential
mode.
It is important to note that the two versions of the
program execute exactly the same operations.
The total elapsed time (in msec) for the
parallel case (
) and the serial case (
), needed
by the PB-K-Means recombination step to complete,
were measured as reported in Table 7.
Table 7: Parallel and sequential elapsed times of PB-K-
Means on (8 physical cores+8 virtual
cores).
PB-K-Means, 2nd step, ,
(msec)
(msec)
The speedup was then estimated as follows:
.
5 CONCLUSIONS
This paper proposes Population-Based K-Means (PB-
K-Means), a new variant of the K-Means algorithm
(Lloyd, 1982) (MacQueen, 1967) (Jain, 2010) which
owes to careful seeding provided by Greedy K-
Means++ (g_kmeans++) method (Celebi et al., 2013)
(Baldassi, 2020). PB-K-Means significantly
improves the clustering accuracy while ensuring an
efficient execution. It was inspired by Recombinator
K-Means (Baldassi, 2020, 2022a), a recent
evolutionary K-Means algorithm also based on
g_kmeans++. A key difference from Recombinator
K-Means is PB-K-Means simplicity.
PB-K-means is articulated in two steps: in the first
one a population of solutions (centroid
configurations) is built using Lloyd’s K-Means with
g_kmeans++. In the second step, a certain number of
Repeated K-Means executions with g_kmeans++ are
used which recombine the population centroids
toward a careful solution.
The paper demonstrates the reliable and efficient
clustering capabilities of PB-K-Means by applying it
to challenging synthetic and real-world datasets.
The prosecution of the research aims to address
the following points.
First, to port the PB-K-Means implementation
currently based on Java parallel streams (Nigro,
2022) (Nigro et al., 2023) (Urma et al., 2018), on top
of the Theatre actor system (Nigro, 2021) which
permits a better exploitation of the parallel resources
offered by modern multi/many-core machines
(Cicirelli & Nigro, 2022).
Second, to experiment the population and
recombination steps of PB-K-Means in the Parallel
Random Swap tool (Nigro et al., 2023), which is
expected to require fewer swap iterations while
providing careful clustering.
Third, to possibly improve PB-K-Means by
exploiting concepts from the “refine” seeding
algorithm proposed in (Bradley and Fayyad, 1998)
and the pairwise-nearest-neighbor smoothing
approach described in (Baldassi, 2022b).
ACKNOWLEDGEMENTS
The authors are grateful to the colleague Carlo
Baldassi for having provided the dataset
together with ground truth information.
REFERENCES
Lloyd, S.P. (1982). Least squares quantization in PCM.
IEEE Trans. on Information Theory, 28(2):129–137.
MacQueen, J. (1967). Some methods for classification and
analysis of multivariate observations. Proc. of the 5
th
Berkeley Symposium on Mathematical Statistics and
Probability. Berkeley, University of California Press,
281-297.
Performance of a K-Means Algorithm Driven by Careful Seeding
35

Jain, A.K. (2010). Data clustering: 50 years beyond k-
means. Pattern Recognition Letters, 31(8), 651–666.
Fränti, P., Sieranoja, S. (2018). K-means properties on six
clustering benchmark datasets. Applied Intelligence,
48(12):4743-4759.
Fränti, P., Sieranoja, S. (2019). How much can k-means be
improved by using better initialization and repeats?
Pattern Recognition, 93, 95-112.
Vouros, A., Langdell, S., Croucher, M., Vasilaki, E. (2021).
An empirical comparison between stochastic and
deterministic centroid initialization for K-means
variations. Machine Learning, 110:1975–2003.
Fränti, P. (2018). Efficiency of random swap algorithm. J.
Big Data, 5(1):1-29.
Nigro, L., Cicirelli, F., Fränti, P. (2023). Parallel random
swap: An efficient and reliable clustering algorithm in
Java. Simulation Modelling Practice and Theory, 124,
102712.
Fränti, P. (2000). Genetic algorithm with deterministic
crossover for vector quantization. Pattern Recognition
Letters, 21(1), 61-68.
Baldassi, C. (2020). Recombinator K-Means: A population
based algorithm that exploits k-means++ for
recombination. arXiv:1905.00531v3, Artificial
Intelligence Lab, Institute for Data Science and
Analytics, Bocconi University, via Sarfatti 25, 20135
Milan, Italy.
Baldassi, C. (2022a). Recombinator K-Means: An
evolutionary algorithm that exploits k-means++ for
recombination. IEEE Transactions on Evolutionary
Computation, 26(5), 991-1003.
Celebi, M.E., Kingravi, H.A., Vela, P.A. (2013). A
comparative study of efficient initialization methods for
the k-means clustering algorithm. Expert systems with
applications, 40(1):200–210.
Nigro, L. (2022). Performance of parallel K-means
algorithms in Java. Algorithms, 15(4), 117.
Urma, R.G., Fusco, M., & Mycroft, A. (2018). Modern
Java in Action. Manning, Shelter Island.
Arthur, D., Vassilvitskii, S. (2007). k-means++: The
advantages of careful seeding. In Proc. of the
Eighteenth Annual ACM-SIAM Symp. on Discrete
algorithms, pages 1027–1035. Society for Industrial
and Applied Mathematics.
Fränti, P., Rezaei, M., Zhao, Q. (2014). Centroid index:
cluster level similarity measure. Pattern Recognition,
47(9):3034-3045.
Fränti, P., Rezaei, M. (2016). Generalized centroid index to
different clustering models. Joint Int. Workshop on
Structural, Syntactic, and Statistical Pattern
Recognition (S+SSPR 2016), Merida, Mexico, LNCS
10029, 285-296.
Repository of datasets (2023). http://cs.uef.fi/sipu/datasets/,
last accessed on January 2023.
Sieranoja, S., Fränti, P. (2019). Fast and general density
peaks clustering. Pattern Recognition Letters, 128:551-
558.
Rodriguez, R., Laio, A. (2014). Clustering by fast search
and find of density peaks. Science, 344(6191), 14.92–
14.96.
Nigro, L., Cicirelli, F. (2022). Parallel clustering method
based on density peaks. Sixth World Conference on
Smart Trends in Systems, Security and Sustainability
(WorldS4 2022), London, 26-27 August, Springer
LNNS, ISSN:2367-3370.
Nigro, L. (2021). Parallel Theatre: A Java actor-framework
for high-performance computing. Simulation
Modelling Practice and Theory. 106, 102189.
Cicirelli, F., Nigro, L. (2022). Analyzing Stochastic
Reward Nets by model checking and parallel
simulation. Simulation Modelling Practice and Theory,
116, 102467.
Bradley, P.S., Fayyad, U.M. (1998). Refining initial points
for k-means clustering. In ICML, volume 98, 91–99.
Baldassi, C. (2022b). Systematically and efficiently
improving existing k-means initialization algorithms by
pairwise-nearest-neighbor smoothing, arXiv:2202.
03949v2, Artificial Intelligence Lab, Institute for Data
Science and Analytics, Bocconi University, via Sarfatti
25, 20135 Milan, Italy.
SIMULTECH 2023 - 13th International Conference on Simulation and Modeling Methodologies, Technologies and Applications
36
