
Uncovering Behavioural Patterns of One: And Binary-Class SVM-Based
Software Defect Predictors
George Ciubotariu
a
, Gabriela Czibula
b
, Istvan Gergely Czibula
c
and Ioana-Gabriela Chelaru
d
Department of Computer Science, Babes
,
-Bolyai University, Cluj-Napoca, Romania
Keywords:
Machine Learning, One-Class Classification, Software Defect Prediction, Support Vector Machines.
Abstract:
Software defect prediction is a relevant task, that increasingly gains more interest as the programming industry
expands. However, one of its difficulties consists in overcoming class imbalance issues, because most open-
source software projects that are annotated using bug tracking systems do not have lots of defects. Therefore,
the rarity of bugs may often cause machine learning models to dramatically underperform, even when di-
verse data augmentation or selection methods are applied. As a result, our focus shifts towards one-class
classification, which is a family of outlier detection algorithms, designed to be trained on data instances of a
single label. Considering this approach, we are adapting the traditional Support Vector Machine model to per-
form outlier detection. Experiments are performed on 16 versions of an open-source medium-sized software
system, the Apache Calcite software. We are performing an extensive assessment of the ability of one-class
classifiers trained on software defects to effectively discriminate between defective and non-defective software
entities. The main findings of our study consist in uncovering several trends in the behaviour of the one- and
binary-class support vector machine-based models when solving SDP problems.
1 INTRODUCTION
Software defect prediction (SDP) is a task of ma-
jor practical relevance and importance in the search-
based software engineering field, that increasingly
gains more interest as the programming industry ex-
pands. Detecting software defects is important for
software maintenance and evolution, being helpful in
process management, predicting software reliability,
and guiding development activities. SDP is vital for
safety-critical systems to detect software faults that
may endanger humans.
However, SDP is mostly affected by class imbal-
ance issues, as most bug-tracking annotated open-
source software projects have much fewer defects
than non-defects. Most software project releases have
very few bugs, therefore the defects class is consid-
erably underrepresented. That may result in dummy
classifiers, that always select the non-defective class,
having +99% accuracy. Thus, the supervised SDP
models are set to underperform due to severely im-
a
https://orcid.org/0000-0003-4164-1392
b
https://orcid.org/0000-0001-7852-681X
c
https://orcid.org/0000-0003-0076-584X
d
https://orcid.org/0000-0002-9274-6349
balanced training data, even when the best data aug-
mentation or selection methods are applied. There is a
wide range of binary classifiers proposed in the SDP
literature, from conventional ML predictors (Linear
Regression, Decision Trees, Artificial Neural Net-
works, Support Vector Machines (Malhotra, 2014),
fuzzy models (Marian et al., 2016) to DL models (Ba-
tool and Khan, 2022). Even though having the upper
hand in feature extraction, DL models may still strug-
gle to classify imbalanced data.
An option to mitigate the class imbalance problem
may be one-class classification (OCC). It is a family
of outlier detection algorithms, meant to be trained
on data considered of the same (positive) class. Given
only one class, these models learn to detect similar
positive instances. Afterwards, an unseen instance is
an outlier and falls outside the boundaries created by
the OCC technique if its features differ significantly
from those of the training data (Moussa et al., 2022).
One-class predictive models have been applied to ad-
dress various imbalanced classification tasks, how-
ever, the literature concerning the use of OCC models
for SDP is still scarce (Chen et al., 2016). Recent
works (Zhang et al., 2022) argue that anomaly detec-
tion approaches should be applied to SDP to deal with
the class imbalance problem.
Ciubotariu, G., Czibula, G., Czibula, I. and Chelaru, I.
Uncovering Behavioural Patterns of One: And Binary-Class SVM-Based Software Defect Predictors.
DOI: 10.5220/0012052700003538
In Proceedings of the 18th International Conference on Software Technologies (ICSOFT 2023), pages 249-257
ISBN: 978-989-758-665-1; ISSN: 2184-2833
Copyright
c
2023 by SCITEPRESS – Science and Technology Publications, Lda. Under CC license (CC BY-NC-ND 4.0)
249
Our target is to study the performance of OCC ver-
sus binary classifiers that are widely applied for SDP.
Regarding the OCC approach, we adapted the support
vector classifier (SVC) to perform outlier detection,
and we named the resulting model OCSVM. Experi-
ments are conducted on Apache Calcite (Begoli et al.,
2018), an open-source framework for data manage-
ment. Considering all 16 Calcite releases, we are per-
forming an extensive assessment of whether the one-
class classifiers trained on software defects can effec-
tively classify defective and non-defective software
entities. The main findings of our study consist in un-
covering several trends in the support vector machine
(SVM) based models’ behaviour when solving SDP
problems. Our end goal is to verify whether OCC-
based models, namely OCSVM in our case, can be
effective in cross-version SDP. Additionally, since the
majority class (i.e., non-defects) is used in the litera-
ture when performing OCC-SDP, as most instances
are not bugs (Moussa et al., 2022), we shall investi-
gate if OCC-SVM trained on defective data performs
better than trained on non-defective instances. To the
best of our knowledge, a similar study has not been
conducted yet in the SDP literature.
To conclude our research goals, the study aims
to find answers to the following research questions:
RQ1: How does the performance of OCSVM trained
only on defective data compare to that of the same
model solely trained on non-defective entities?; RQ2:
Does the OCSVM models bring an improvement in
SDP compared to the classical binary SVM and other
baseline methods?; and RQ3: Could we uncover
some patterns and trends in the SVM-based models’
behaviour when solving cross-version SDP?.
The rest of the paper is structured as follows. Sec-
tion 2 provides insight into the Apache Calcite soft-
ware used as a case study for SDP. Then, Section 3
presents our methodology and explains our system
design and experiments pipeline. Afterwards, Section
4 presents our experimental results and discusses the
findings, while the threats to validity are discussed in
Section 5. Section 6 concludes the paper and outlines
directions for future work and improvements.
2 APACHE CALCITE SOFTWARE
As a case study in our work we are using Apache Cal-
cite, an open-source framework for data management
(Begoli et al., 2018). The data sets used in the paper
were taken from the work of (Herbold et al., 2022)
and it was chosen because it is a relatively new case
study and has not been vastly explored yet. There
are 16 releases of the Calcite software: the first one
is 1.0.0, and the final release is 1.15.0. The data
set for each Calcite version contains the classes from
that system characterised by the values of 4189 fea-
tures (software metrics), and a binary label indicating
whether the class was identified as being defective or
not. The set of software metrics used for characteris-
ing the classes includes: static code metrics, metrics
based on the warnings produced by the PMD analysis
tool (GitHub, 2023), metrics extracted from the Ab-
stract Syntax Tree (AST) representation of the source
code, code churn metrics (Moser et al., 2008) (Has-
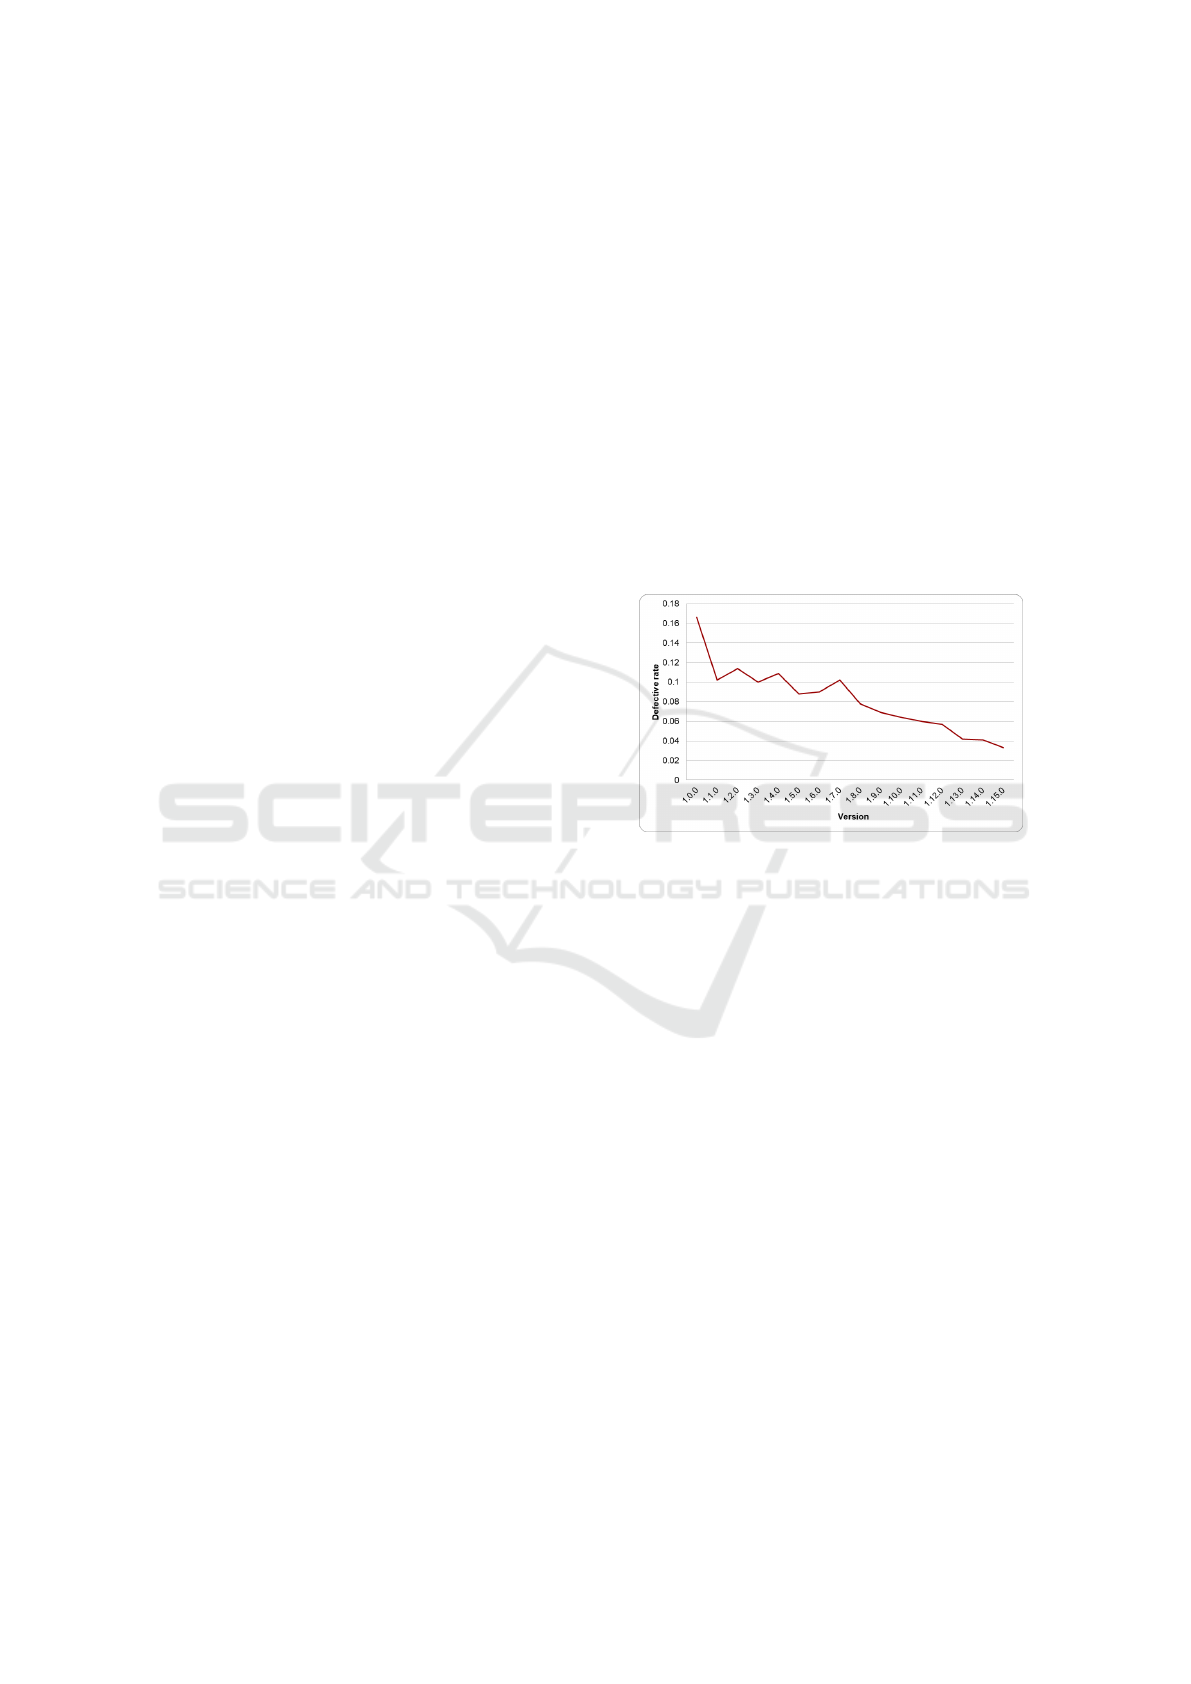
san, 2009) (D’Ambros et al., 2012). Figure 1 depicts
the defective rates for each Calcite version. One may
observe very high imbalance rates for all software re-
leases that decrease as the software evolves. This
leads to increasing difficulty for the binary supervised
predictors to correctly detect software bugs.
Figure 1: Defective rates for all 16 Calcite versions.
We analysed the source code of all the existing re-
leases of the Calcite project. We compared the actual
changes made in the source code by the project con-
tributors to the “+” / “-” labels from (Herbold et al.,
2022). Hence, we identified which application classes
have exactly the same source code, but their assigned
label differs across versions. Such instances further
increase the difficulty of building accurate predictors.
Our analysis revealed the following: (1) there are
56 application classes labelled as non-defective (“-”),
that in a future release have a defective (“+”) label (the
classes became defective without any direct change
in their source code; (2) there is only one application
class labelled as defective that was labelled as non-
defective in a future release without any source code
changes. Both (1) and (2) cases are natural in soft-
ware evolution, being expected that some bugs may
not be found in a software entity when they were in-
troduced, but they may be discovered and solved in
an upcoming release. This holds true for software de-
veloped following agile methodologies that promote
short-release cycles. Mislabelling is also possible,
or the transition is due to some other entity that is
changed in the system, and the problematic entity has
ICSOFT 2023 - 18th International Conference on Software Technologies
250

an actual or hidden dependency on the changed class.
Other situations may appear besides (1) and (2),
such as code being fixed in a certain release and its
label appropriately changing to non-defective or not
changing, but these are not that important from a ML
perspective as they do not introduce noise into the
model. Despite that the previously mentioned cases
introduce noise in our experiments and may cause
poorer performance, we decided to use the data set
without any preprocessing, in order to avoid introduc-
ing biases in the evaluation and have a more realistic
experiment considering the software evolution.
The data sets used in our study are being made
publicly available at (Ciubotariu, 2022).
3 METHODOLOGY
This section introduces the methodology of our study,
starting with the problem statement, continuing with
the data representation, the used ML models, and the
conducted experiments. The section ends with the
testing methodology and performance metrics used
for assessing the performance of the defect predictors.
Problem Statement and Data Representation. As
previously shown, the general SDP task can be for-
malised as a binary classification task. There are two
possible target classes: the class of software faults
(denoted by “+” and referred to as the positive class)
and the class of non-defective software entities (de-
noted by “-” and referred as the negative class). Gen-
erally, in a SDP task, a data set of instances (software
entities) labelled with their corresponding class (i.e.,
“+” or “-”) is given and will be further used for train-
ing and building the ML model. In the SDP task for-
malised as a binary classification problem, the target
function to be learned is a function f : S → {“+”, “-”}
that assigns a class label (“+” or “-”) to each software
entity from a software system S .
In our case study, as described in Section 2, we
are starting with a data set D
k
for each version k ∈
{0, 1, . . . , 15} of the Calcite system. Each data set
consists of instances (software classes) represented as
4189-dimensional real-valued vectors, where an ele-
ment from the vector represents the value of a certain
software metric (feature) computed for that software
class. Each data set entry has a ground truth binary
label specifying if the instance is faulty or not. In re-
gards to the data representation (feature set) used in
our work, we are using the entire feature set of 4189
features (see Section 2), without being particularly fo-
cused on the features’ importance and relevance. The
main goal of the current study is to comparatively
analyse the behaviour of OCSVM models in different
usage scenarios when using the same set of features
for representing the software classes.
Conducted Experiments and Used ML Models.
We have designed a framework for running all the ex-
periments in a streamlined pipeline manner, and all
the implementation aspects have been abstracted for
generalisation reasons. We consider that one of the
most important features of the framework is that it al-
lows us to use any classifier from the scikit-learn
library (Pedregosa et al., 2011) and finetune it using
our own grid search implementation, which is also
able to handle OCC models.
The models we are working with are the SVC
and OCSVM models from scikit-learn. As men-
tioned in the introduction, our goal is to test the per-
formance of OCC trained on both positive (defective),
and negative (non-defective) instances. Therefore, we
implement a relabelling step that is dynamically per-
formed, according to the input configuration. Thus,
we are using two OCSVM models: (1) OCSVM
+
that is trained only on positive data instances; and
(2) OCSVM
−
which performs training on negative in-
stances solely.
Let us denote by n, in the following, the final re-
lease number of the Calcite software versions (i.e.,
n = 15). The experiment employed to test the ML
models (OCSVM
+
, OCSVM
−
and SVC) follows the
historical system evolution track, for assessing the
real-life defect prediction capabilities: the models
are trained on the instances from versions 0..k (i.e.,
k
[
i=0
D
i
) and then tested on version k + 1 (i.e., data set
D
k+1
), ∀k, 0 ≤ k ≤ n − 1.
Performance Metrics. The performance metrics
used for evaluating the performance of the employed
ML models (SVC, OCSVM
+
and OCSVM
−
) are rec-
ommended in the literature for performance assess-
ment in forecasting, specifically in the case of diffi-
cult classification problems, as SDP is. For the per-
formed experiment, the confusion matrix is first com-
puted over the testing data set: TP - number of true
positives; FP - number of false positives; TN - num-
ber of true negatives; FN - number of false negatives.
Based on these values, the following evaluation met-
rics are used: Probability of detection (POD), False
alarm ratio (FAR), Critical success index (CSI), Area
under the ROC curve (AUC) and F-score for the posi-
tive class (F1).
All measures range in [0,1]. For the FAR evalu-
ation metric, smaller values are expected, while the
Uncovering Behavioural Patterns of One: And Binary-Class SVM-Based Software Defect Predictors
251

other measures should be maximised in order to ob-
tain better predictors. POD, CSI, and FAR are usually
used for problems where the focus lies on predicting
important and rare events, and thus they are appro-
priate for SDP. The other two metrics (AUC and F1)
are recommended in the supervised learning literature
as evaluation metrics in case of imbalanced data sets,
while AUC is considered among the best metrics for
performance evaluation in SDP (Fawcett, 2006).
From a software engineering perspective, in SDP
we are searching for a balance between POD and
FAR. We are particularly interested in defect pre-
dictors which are able to correctly uncover the real
software defects (i.e., maximise the recall) but in the
meantime, we would like to minimise the additional
implied workload that the software engineers must in-
put into filtering out the false defect predictions (i.e.,
minimising FAR).
4 EXPERIMENTAL RESULTS
With the goal of finding answers to the research ques-
tions stated in Section 1, we are further presenting
our experimental results and discussing the research
findings. The framework implemented for the experi-
ments is publicly available at (Ciubotariu, 2022).
In what concerns the experimental setup, we note
that for all reported results, the grid-search-selected
optimal model configurations were selected according
to the geometric mean (G-mean) performance met-
ric. G-mean is computed as the squared root of the
POD and TNRate product, and it expresses a balance
between the classification performances on both the
defective and non-defective classes. The best kernel
employed for all SVM-based models (in terms of the
G − Mean performance) proved to be the polynomial
one, having a degree between 2, and 5. Overall, a grid
search space of 3360 unique model configurations has
been chosen for each individual OCSVM experiment
and a space of 42 configurations for the SVM.
We are further presenting the results of the
OCSVM models, to answer research question RQ1.
As described in Section 3, we investigate the Calcite
system evolution, and we predict the defects of the
next releases. This experiment consists in training the
models on all Calcite versions from 0 to the k-th and
then evaluating their performance on the (k + 1)-th.
Table 1 presents the experimental results. For each
performance metric, the best value is highlighted.
The results depicted in Table 1 show that over-
all, considering all testing scenarios, OCSVM
+
be-
haves slightly better. In most cases, it has better per-
formance in terms of POD. We observe that when
trained on a high number of defects, OCSVM
+
de-
tects better the software faults. This bad behaviour
is observed for both OCSVM models in terms of the
FAR metric, which may reveal a possible limitation
of OCSVM. Apart from these observations, we see
an interesting stagnation in the OCSVM
−
recall. We
remark that the FAR performances might have also
been influenced by the situation described in Section
2. There are application classes which changed labels
without being modified across several Calcite releases
and thus, there is a certain noise introduced during the
training and testing of the OCSVM models.
Answer to RQ1. To easily compare the perfor-
mances of the models OCSVM
+
and OCSVM
−
, we
are introducing the following notations. Given a
Calcite version v ∈ {1.0.0, 1.1.0, . . . , 1.14.0}, we are
computing three values (denoted by Win(v), Lose(v),
Tie(v)). They represent the number of performance
metrics used for evaluation for which OCSVM
+
out-
performed/was outperformed/has the same perfor-
mance as OCSVM
−
.
Based on the results from Table 1, aggregated
values are computed by summing the values for
each Calcite version: W IN =
∑
v
Win(v), LOSE =
∑
v
Lose(v), T IE =
∑
v
Tie(v). The following values
were obtained: W IN = 41, LOSE = 30 and T IE=4.
Thus, in about 55% of the cases (41 out of 75) the per-
formance of OCSVM
+
is better or at least equal to the
performance of OCSVM
−
. Still, even in cases when
OCSVM
−
was better, it only slightly outperformed
OCSVM
+
. Despite these general results, we note that
in terms of POD, which is one of the most relevant
metrics for SDP, OCSVM
+
is generally better than
OCSVM
−
in 53% of the cases. We have also to re-
mark that the number of defects on which OCSVM
+
was trained is small compared to the number of non-
defects used for training OCSVM
−
. The number of
defects in the Calcite releases ranges from 45 (for
release 1.15.0) to 178 (for release 1.0.0). Clearly,
the small number of defects the OCSVM
+
model has
been trained on may have impacted its performance.
Figure 2 depicts the imbalance between the sam-
ples used for training the OCC models for the pro-
posed experiment. We note that on the Oy axis, a
logarithmic scale was used. Certainly, when consid-
ering the problem of class imbalance in the case of the
OCC models, not only do ratios but also the numbers
themselves (of defects, non-defects) matter. We note
that the performance assessment of the OCSVM
+
and
OCSVM
−
models has also been influenced by the im-
balance of the testing data.
For verifying the statistical significance of the
ICSOFT 2023 - 18th International Conference on Software Technologies
252
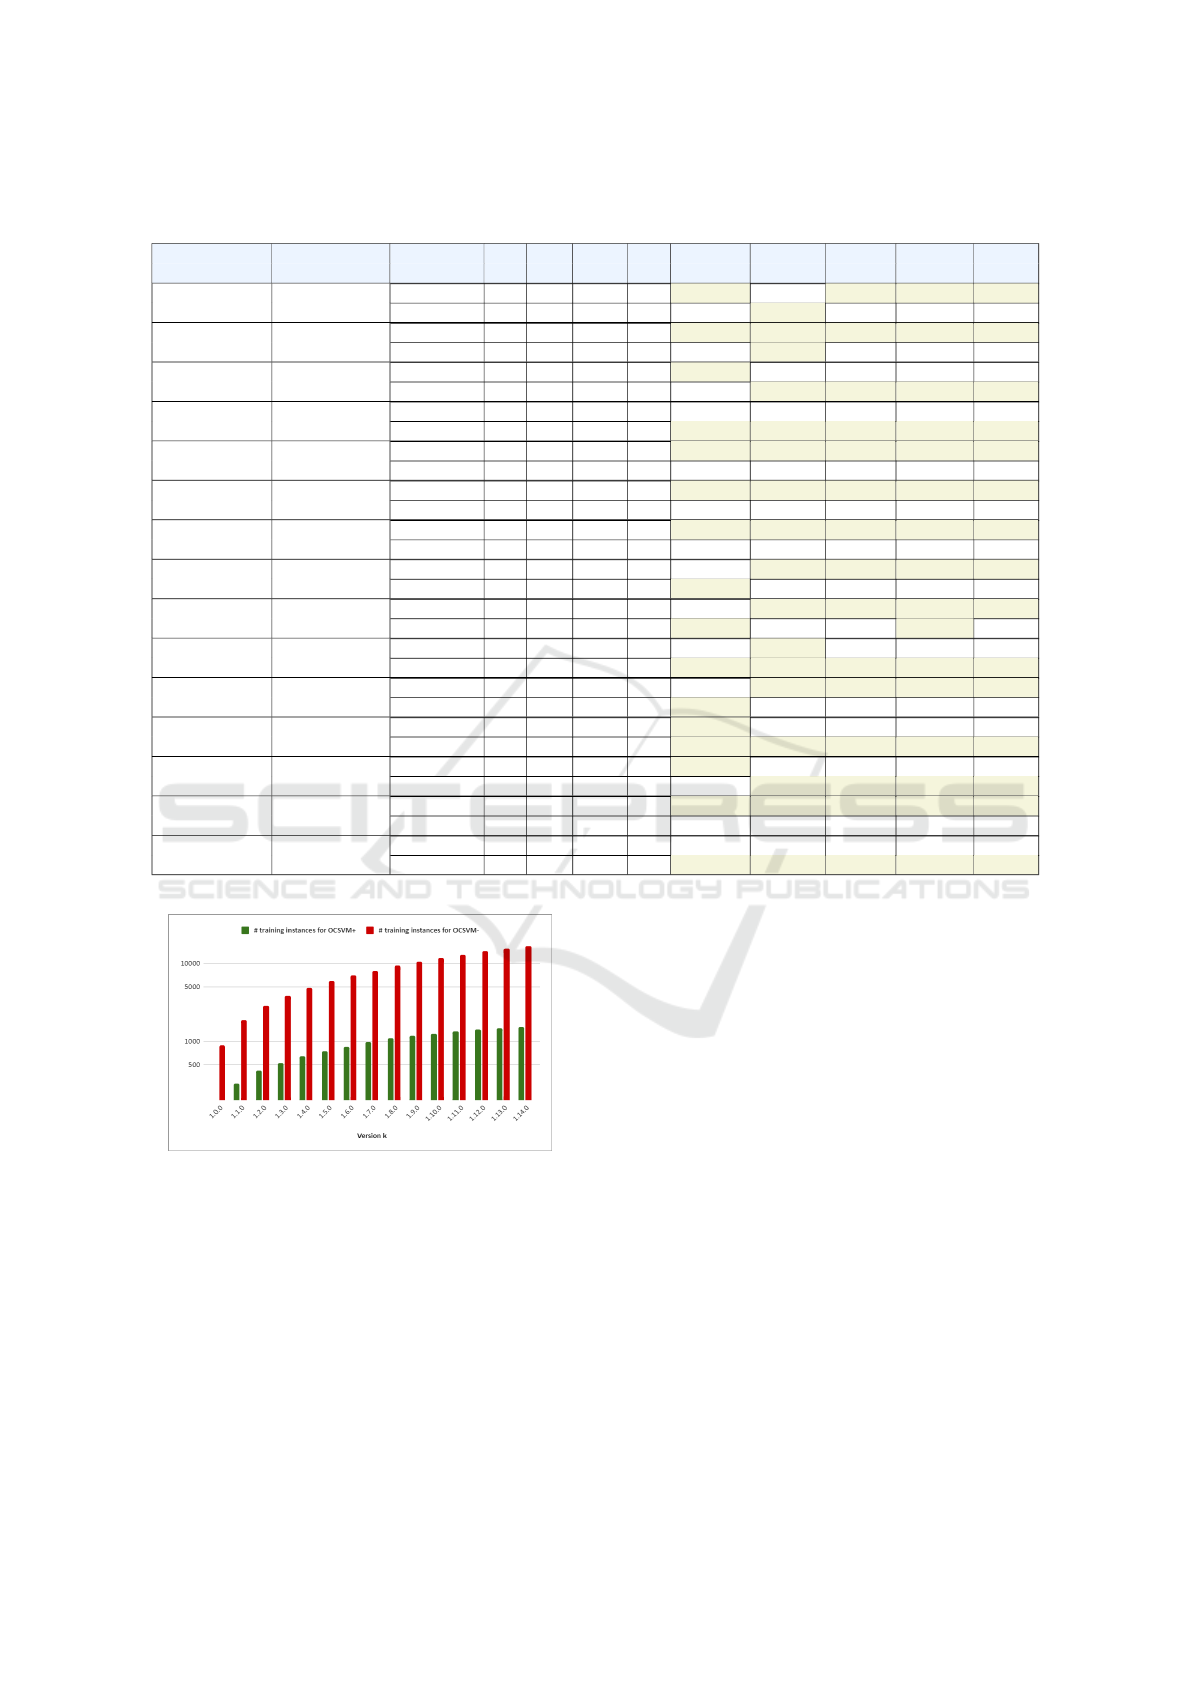
Table 1: For each testing case (trained model on versions from 0 to k and tested on version k + 1) and OCSVM models, the
confusion matrix is provided together with the performance metrics values.
Versions for Version for Model TP FP TN FN POD (↑) FAR (↓) CSI (↑) AUC (↑) F1 (↑)
training (0..k) testing (k + 1)
1.0.0..1.0.0 1.1.0 OCSVM
+
70 441 549 43 0.619 0.863 0.126 0.587 0.224
OCSVM
−
58 362 628 55 0.513 0.862 0.122 0.574 0.218
1.0.0..1.1.0 1.2.0 OCSVM
+
77 455 527 49 0.611 0.855 0.133 0.574 0.234
OCSVM
−
60 354 628 66 0.476 0.855 0.125 0.558 0.222
1.0.0..1.2.0 1.3.0 OCSVM
+
67 479 524 45 0.598 0.877 0.113 0.560 0.204
OCSVM
−
64 417 586 48 0.571 0.867 0.121 0.578 0.216
1.0.0..1.3.0 1.4.0 OCSVM
+
73 473 531 50 0.593 0.866 0.122 0.561 0.218
OCSVM
−
75 425 579 48 0.610 0.850 0.137 0.593 0.241
1.0.0..1.4.0 1.5.0 OCSVM
+
73 519 554 30 0.709 0.877 0.117 0.613 0.210
OCSVM
−
64 499 574 39 0.621 0.886 0.106 0.578 0.192
1.0.0..1.5.0 1.6.0 OCSVM
+
81 577 509 26 0.757 0.877 0.118 0.613 0.212
OCSVM
−
67 517 569 40 0.626 0.885 0.107 0.575 0.194
1.0.0..1.6.0 1.7.0 OCSVM
+
85 558 566 43 0.664 0.868 0.124 0.584 0.220
OCSVM
−
78 519 605 50 0.609 0.869 0.121 0.574 0.215
1.0.0..1.7.0 1.8.0 OCSVM
+
50 382 818 51 0.495 0.884 0.104 0.588 0.188
OCSVM
−
63 635 656 38 0.624 0.910 0.086 0.547 0.158
1.0.0..1.8.0 1.9.0 OCSVM
+
42 406 814 48 0.467 0.906 0.085 0.567 0.156
OCSVM
−
53 546 656 37 0.589 0.912 0.083 0.567 0.154
1.0.0..1.9.0 1.10.0 OCSVM
+
39 426 800 45 0.464 0.916 0.076 0.558 0.142
OCSVM
−
52 566 660 32 0.619 0.916 0.080 0.579 0.148
1.0.0..1.10.0 1.11.0 OCSVM
+
37 376 875 43 0.463 0.910 0.081 0.581 0.150
OCSVM
−
53 610 641 34 0.609 0.920 0.076 0.561 0.141
1.0.0..1.11.0 1.12.0 OCSVM
+
37 438 896 44 0.457 0.922 0.071 0.564 0.133
OCSVM
−
37 310 1024 44 0.457 0.893 0.095 0.612 0.173
1.0.0..1.12.0 1.13.0 OCSVM
+
43 734 488 10 0.811 0.945 0.055 0.605 0.104
OCSVM
−
39 603 619 14 0.736 0.939 0.059 0.621 0.112
1.0.0..1.13.0 1.14.0 OCSVM
+
36 612 643 17 0.679 0.944 0.054 0.596 0.103
OCSVM
−
32 546 709 21 0.604 0.945 0.053 0.584 0.101
1.0.0..1.14.0 1.15.0 OCSVM
+
29 623 684 16 0.644 0.956 0.043 0.584 0.083
OCSVM
−
32 611 696 13 0.711 0.950 0.049 0.622 0.093
Figure 2: Imbalanced data used for training the models.
differences observed between the performances of
OCSVM
+
and OCSVM
−
classifiers, a two-tailed
paired Wilcoxon signed-rank test has been applied.
The sample containing the values of all performance
metrics obtained by the OCSVM
+
model in all test-
ing scenarios in the considered experiment was tested
against the respective sample of values obtained by
the OCSVM
−
model. A p-value higher than 0.01
was obtained, highlighting that the difference ob-
served between the performances of OCSVM
+
and
OCSVM
−
is not statistically significant, at a signif-
icance level of α = 0.01. Even though the perfor-
mance achieved by the OCC model trained on de-
fective software entities is not statistically significant,
OCSVM
+
has an advantage over OCSVM
−
, that of
being trained considerably faster on fewer data.
Despite this result, we ponder that positive in-
stances (software faults) may be the appropriate ones
to use in SDP as training data for OCC models since
there can be underlying bugs in the code that have
not been discovered until later versions of the soft-
ware. This implies that the OCSVM
−
model may
have trained on positive data incorrectly labelled as
negatives. As shown in Section 2, a few versions later,
the same data could be regarded as faulty, and when
concatenated into the same training set, it would gen-
erate noise in the learning, ultimately leading to less
robust models. Thus, to have effective means of find-
ing bugs in source code, we may need either to ensure
the labels are appropriate, and the bug descriptions
are more informative, or we could focus more on de-
fective instances during training. We believe the lat-
ter option may be the general solution, since defects
Uncovering Behavioural Patterns of One: And Binary-Class SVM-Based Software Defect Predictors
253

Figure 3: Improvement in POD and FAR achieved by the
binary SVC model compared to the OCSVM
+
model.
are more concise, and don’t change their character-
istics during the development stages of the software,
while non-defects are more volatile, subjective, and
interpretable, leading us to certain conflicts for later
software releases.
Answer to RQ2. For answering research ques-
tion RQ2, we conducted a comparative analysis be-
tween the performances of OCSVM
+
and the bi-
nary SVC model. Overall, SVC clearly outperforms
OCSVM
+
. Still, in five testing scenarios the tradi-
tional SVC underperforms in terms of recall, com-
pared to OCSVM
+
. Figure 3 depicts the improvement
in POD and FAR achieved by the binary SVC model
compared to the OCSVM
+
one.
The negative values from Figure 3 represent an
improvement achieved by OCSVM
+
over SVC, while
the positive values suggest that OCSVM
+
underper-
forms compared to SVC. A high improvement in
POD (about 19%) is observed for k = 1.12.0 (training
on versions from 1.0.0 to 1.12.0 and then testing on
1.13.0) which may suggest the potential of OCSVM
+
in accurately detecting the software defects, also hav-
ing the advantage of being trained faster than SVC.
OCSVM
+
is clearly outperformed by SVC in terms
of FAR, as illustrated in Figure 3. Although SVC out-
performs OCSVM
+
in terms of FAR, the false alarm
rate is worryingly high, particularly for higher Calcite
releases (about 68% for the version k = 1.12.0). We
also observed for SVC only small variations of the re-
call and an increasing FAR for higher versions of the
software. This suggests that the traditional SVC suf-
fers because of the class imbalance. When compar-
ing the SVC classifiers for the higher Calcite releases,
there are no significant differences in terms of recall,
but the model tends to be a better fit in terms of false
positive rate.
As expected, the improvement observed in the
performance of SVC compared to the OCSVM
−
model is statistically significant, at a significance level
of α = 0.01. A p-value lower than 0.01 was obtained
using a two-tailed paired Wilcoxon signed-rank test,
after testing the sample of values representing the per-
formance of the SVC model in all testing scenarios of
E2 against the respective sample of values obtained
by the OCSVM
+
model.
As a conclusion, considering the results of the cur-
rent study, it is not certain whether we may be able to
improve the performance of OCSVM
+
, but there is a
potential to hybridise the SVC with the OCC models
in order to benefit of the strengths of both models.
In terms of OCSVM
+
performance compared to
baseline methods, we considered the ZeroR classifier
that simply predicts the non-defective/majority class.
For each performance metric p, the average improve-
ment achieved by OCSVM
+
over ZeroR was com-
puted as the mean of the improvements achieved by
OCSVM
+
for over ZeroR for p and all Calcite ver-
sions. These improvements are: 60% for POD, 56%
for Spec, 10% for FAR, 9% for CSI, 58% for AUC
and 17% for F1. Significant improvements are noted,
particularly in the case of POD.
Answer to RQ3. With the goal of uncovering cer-
tain trends in the SVM-based models’ behaviour, we
summarise below our conclusions regarding the per-
formances of the OCSVM
+
, OCSVM
−
, and SVC
models employed in our SDP experiments.
Even if the results highlighted that the OCSVM
+
model slightly outperforms OCSVM
−
, the two SVM-
based OCC models have roughly similar perfor-
mances. This may lead us to the conclusion that
the non-defective and defective classes have similar
structures, in terms of the employed software fea-
tures/metrics. An idea to alleviate this problem may
be to focus on particular types of defects, and to de-
termine feature sets that are the most relevant for the
particular types of defects.
The testing scenarios performed for the proposed
experiment empirically showed (see Table 1) a pat-
tern in the way the OCC model behaves: if trained
on a representative sample from a certain class c (“+”
or “-”), the OCSVM
c
model succeeds to maximise
the recall of class c (POD for the positive class and
specificity for the negative class). Compared to the
binary SVC model, the OCC models underperform in
terms of specificity. The traditional SVC is by far the
better in this context, even though it may have some
difficulties detecting all the software defects.
The traditional SVC has good enough perfor-
mance in terms of POD, being outperformed in sev-
eral cases by OCSVM
+
, which has the advantage of
being trained faster on fewer data. Although the recall
is promising, the FAR of both the OCC models and
SVC is worryingly high. For the OCC-based mod-
ICSOFT 2023 - 18th International Conference on Software Technologies
254

els, the FAR is even higher than for SVC. This may
reveal a limitation of the OCC models: since there
are trained only on one class, they easily misclas-
sify instances from outside the class (in the case of
OCSVM
+
a large number of non-defects are classi-
fied as being defects). This may possibly be due to
the similar structure of the two classes.
It can also be observed that SVC suffers because
of the class imbalance: for high releases of Calcite
we note an increase of the FAR and small variations
in the SVC recall. When comparing the performances
of SVC models, they tend to be a better fit in terms of
false alarm rate as the version k increases. This may
suggest us to further investigate using both OCSVM
and SVC at the same time, and checking where the
models contradict, so that eventually we may bene-
fit from both OCSVM’s better true positive rate, and
SVC’s better false alarm rate. Despite the results
from Figure 3 which highlighted that OCSVM
+
out-
performs in several cases SVC in terms of the true
positive rate, there is no clear evidence that the OCC-
based classifiers are better at detecting defects.
We finally have to note that the conclusions of the
study conducted in this paper are to a certain extent
correlated with those of (Moussa et al., 2022), who
applied an One-Class SVM (OCSVM) classifier for
SDP. The OCSVM model was trained on the non-
defective class, and the experiments were performed
on the NASA data sets. (Moussa et al., 2022) con-
cluded that: (1) OCSVM is not appropriate for within-
project SDP, due to its poor performance; and (2)
for cross-project SDP, OCSVM outperforms the tradi-
tional (binary) SVM. Unlike the related approach, we
have also introduced the OCSVM model trained on
the software defects, the experiments were performed
on the releases of the Apache Calcite software and we
also attempted to identify some patterns in the way the
SVM-based models behave.
5 THREATS TO VALIDITY
This section tackles the threats to the validity of our
study following the principles introduced by (Rune-
son and H
¨
ost, 2009). With regard to construct va-
lidity (Runeson and H
¨
ost, 2009), the evaluation met-
rics used for performance assessment were selected
based on their relevance to the problem at hand, as
revealed by the literature. In order to minimise the
threats to construct validity, we conformed to the best
practices in SVM-based model building, testing and
evaluation, by model validation during training, using
our own grid search implementation for hyperparame-
ters finetuning, and statistical analysis of the obtained
results. Furthermore, we have chosen an experimen-
tal methodology relevant from the software engineer-
ing perspective and particular to software evolution.
Through the proposed experiments we investigated
the evolution of the system, and we tried to predict
what defects the next software releases may have us-
ing the SVM-based models trained on the data from
the available software releases.
Another possible threat refers to internal validity,
specifically the parameters setting and experimental
setup which may have influenced the obtained results.
The SVM-based models have several internal hyper-
parameters whose optimisation is required for attain-
ing a good performance: the regularisation parame-
ter, the kernel, the parameters of the kernel, etc. For
reducing threats to internal validity, numerous experi-
ments were performed. After trying various architec-
tures and noticing different patterns in the grid search,
we have adjusted our parameter space according to
our findings. We consider that one of the most im-
portant features of our framework is that it allows us
to use any scikit-learn classifier and finetune it us-
ing our own grid search implementation, which is also
able to handle OCC models. Furthermore, the same
grid search procedure is used both for the OCC mod-
els and the binary SVC.
In what concerns the threats to external validity,
our study employs ML models and data sets which
are relevant and previously used in the SDP litera-
ture. An extensive study is conducted on 16 releases
of an open-source software project (Apache Calcite)
recently proposed as a case study in the SDP litera-
ture (Miholca et al., 2022) (Herbold et al., 2022). To
better generalize our findings for cross-version SDP,
the study can be extended for cross-project SDP, by
employing other open-source Apache frameworks.
In terms of reliability, the proposed methodology
has been detailed in Section 3 in order to allow the
reproducibility of the performed experiments and ob-
tained results. For increasing reliability, a statistical
analysis has been applied to the obtained results to
test their statistical significance. Moreover, the soft-
ware framework used for conducting the experiments
and the employed data are made publicly available.
6 CONCLUSIONS
In this paper, we have performed a study investigat-
ing the performance of OCC models for SDP, with a
particular focus on SVM-based models. Our main re-
search hypothesis was that the one-class software de-
fect predictors should be trained on the software en-
tities that are faulty. Our two additional goals were
Uncovering Behavioural Patterns of One: And Binary-Class SVM-Based Software Defect Predictors
255

to compare the performance of OCC models to the
one of binary classification models and to analyse if
some patterns and trends may be uncovered in the
SVM-based models’ behaviour when solving SDP.
Extensive experiments performed on Apache Calcite
software yielded several interesting research findings.
The main conclusion of our study is that in order to
have effective means of finding bugs in source code,
we may need to either ensure that the labels are ap-
propriate and the bug descriptions are more informa-
tive, or we could focus more on defective instances
during training. We believe the latter option may be
the general solution, since defects are more concise,
and don’t change their characteristics during the de-
velopment stages of the software, while non-defects
are more volatile, subjective, and interpretable, lead-
ing us to certain conflicts for later software releases.
We further aim to verify the findings of the cur-
rent study in a cross-version SDP scenario on another
Apache software systems (Ant, Archive, Commons,
etc) by training the OCC model on the software de-
fects from all versions of a software system and, sub-
sequently, testing the model on the releases of other
software systems. The AUC-based evaluation of the
results may also be extended by considering a recent
work (Carrington et al., 2023) that describes a deep
ROC analysis to measure performance in groups of
true-positive rate or false-positive rate. The use of
data augmentation to increase the number of faulty
classes may also provide better results, as for these
experiments we didn’t address the issue.
As another direction for future work we will focus
on ML models trained on specific types of defects.
There may be a multitude of software bug types which
we could not properly classify since the data set anno-
tations do not include the nature of the problem, just
its presence. We believe it may be useful to include
such annotations since clustering defects by their cat-
egory could be better understood this way. Code
smells may be a possible starting point for trying to
automatically classify defects into categories, as there
is a clear link between code smells and the quality of
the code. The experimental results obtained also sug-
gested us to further investigate using both OCSVM
and SVM at the same time and check where the mod-
els contradict, so that eventually we may benefit from
the strengths of both OCSVM and SVM models.
ACKNOWLEDGEMENTS
This work was supported by a grant of the Min-
istry of Research, Innovation and Digitization,
CNCS/CCCDI – UEFISCDI, project number PN-III-
P4-ID-PCE-2020-0800, within PNCDI III.
REFERENCES
Batool, I. and Khan, T. A. (2022). Software fault prediction
using data mining, machine learning and deep learn-
ing techniques: A systematic literature review. Com-
puters and Electrical Engineering, 100:107886.
Begoli, E., Camacho-Rodr
´
ıguez, J., Hyde, J., Mior, M. J.,
and Lemire, D. (2018). Apache calcite: A founda-
tional framework for optimized query processing over
heterogeneous data sources. In Proceedings of SIG-
MOD ’18, page 221–230, New York, NY, USA. ACM.
Carrington, A. M., Manuel, D. G., and et al. (2023).
Deep ROC Analysis and AUC as Balanced Average
Accuracy, for Improved Classifier Selection, Audit
and Explanation. IEEE Trans. Pattern Anal. Mach.,
45(1):329–341.
Chen, L., Fang, B., and Shang, Z. (2016). Software fault
prediction based on one-class SVM. In ICMLC 2016,
volume 2, pages 1003–1008.
Ciubotariu, G. (2022). OCC-SDP GitHub repository. https:
//github.com/george200150/CalciteData/.
D’Ambros, M., Lanza, M., and Robbes, R. (2012). Eval-
uating defect prediction approaches: A benchmark
and an extensive comparison. Empirical Softw. Engg.,
17(4–5):531–577.
Fawcett, T. (2006). An introduction to ROC analysis. Pat-
tern Recognition Letters, 27(8):861–874.
GitHub (2023). PMD - An extensible cross-language static
code analyzer. https://pmd.github.io/.
Hassan, A. E. (2009). Predicting faults using the complex-
ity of code changes. In 2009 IEEE 31st International
Conference on Software Engineering, pages 78–88.
Herbold, S., Trautsch, A., Trautsch, F., and Ledel, B.
(2022). Problems with SZZ and features: An empir-
ical study of the state of practice of defect prediction
data collection. Empir. Softw. Eng., 27(2).
Malhotra, R. (2014). Comparative analysis of statistical and
machine learning methods for predicting faulty mod-
ules. Applied Soft Computing, 21:286–297.
Marian, Z., Mircea, I., Czibula, I., and Czibula, G. (2016).
A novel approach for software defect prediction using
fuzzy decision trees. In SYNASC’18, pages 240–247.
Miholca, D.-L., Tomescu, V.-I., and Czibula, G. (2022). An
in-Depth Analysis of the Software Features’ Impact
on the Performance of Deep Learning-Based Software
Defect Predictors. IEEE Access, 10:64801–64818.
Moser, R., Pedrycz, W., and Succi, G. (2008). A compar-
ative analysis of the efficiency of change metrics and
static code attributes for defect prediction. In ICSE
’08, page 181–190, New York, NY, USA. ACM.
Moussa, R., Azar, D., and Sarro, F. (2022). Investigating the
Use of One-Class Support Vector Machine for Soft-
ware Defect Prediction. CoRR, abs/2202.12074.
Pedregosa, F., Varoquaux, G., and et al. (2011). Scikit-
learn: Machine learning in Python. JMLR journal,
12:2825–2830.
ICSOFT 2023 - 18th International Conference on Software Technologies
256

Runeson, P. and H
¨
ost, M. (2009). Guidelines for conduct-
ing and reporting case study research in software en-
gineering. Empirical Softw. Engg., 14(2):131–164.
Zhang, S., Jiang, S., and Yan, Y. (2022). A Software De-
fect Prediction Approach Based on BiGAN Anomaly
Detection. Scientific Programming, 2022:Article ID
5024399.
Uncovering Behavioural Patterns of One: And Binary-Class SVM-Based Software Defect Predictors
257
