
Hemodynamic Characterization of Localized Aortic Valve
Calcifications
Reza Daryani
1a
, Emre Cenk Ersan
2b
and M. Serdar Çelebi
2c
1
Faculty of Mechanical Engineering, Istanbul Technical University, Istanbul, Turkey
2
Informatics Institute, Department of Computational Science & Eng., Istanbul Technical University, Istanbul, Turkey
Keywords: Calcification, Aortic Valve, FSI Simulation, Hemodynamic Characterization, Blood Flow.
Abstract: Different hemodynamic characteristics of the blood flow can be studied by numerical simulations of the blood
flow around the heart valves, which are significantly useful in various fields such as recognition and prediction
of cardiovascular diseases, valve surgery, replacement, and advanced design of patient-specific prosthetic
valves. One of these common valvular diseases is aortic valve stenosis, which mainly occurs due to the
decreased orifice area between the valves’ leaflets and leads to insufficient blood pumping. In the aortic valve,
calcification is the main reason for stenosis in which calcium deposits on the leaflets increase their rigidity
and consequently prevent them from fully opening and closing. Severe cases of this disease lead to morbidity
and mortality. In this work, different localized calcifications of the aortic valve are studied for several grades
of this disease and compared with the healthy case. For this purpose, single-phase FSI simulations of blood
flow are performed for various degrees of localized calcification patterns and pertinent hemodynamic
parameters are obtained. Critical flow parameters, transvalvular indexes and Wall Shear Stress (WSS) based
indexes are discussed in detail.
1 INTRODUCTION
One of the most frequent Valvular Heart Diseases
(VHD) among the elderly population is Aortic
Stenosis (AS) which accounts for 43% of VHD
(Pandya, 2012). According to Nudel (2015), 25% of
adults over the age of 65 are affected by this disease.
The occurrence of this pathological condition is
mainly due to the calcium deposition on the aortic
valve leaflets and it is characterized by narrowed
orifice area of the leaflets. The initiation phase
originates in the form of a nodulus which grows over
time (Halevi et al., 2016). This stage is associated
with endothelial damage of the leaflets as a result of
higher flow shear and mechanical stresses (Freeman
et al., 2005; Otto, 2008). AS is classified into mild,
moderate, and severe levels, which are based on the
measured Aortic Valve Area (AVA) using
Transthoracic Doppler Echocardiography (TDE)
analysis (Kappetein et al., 2013). Severe AS cases are
followed by morbidity and mortality complications
a
https://orcid.org/0000-0002-5504-3070
b
https://orcid.org/0000-0003-0761-6193
c
https://orcid.org/0000-0003-4566-0216
and its treatment requires aortic valve replacement
(Luraghi et al., 2020; Halevi et al., 2018).
Luraghi et al. (2020) worked on the potential
complication associated with calcification patterns in
Transcatheter Aortic Valve Replacement (TAVR)
utilizing FSI models. Sarbandi et al. (2021) developed
2D and 3D FSI models to investigate the role of the
bio-transport process in calcification and thrombosis
for aortic valves. Their results revealed that there is a
close relationship among wall shear stress, flow
vortices, and concentration patterns near and far from
the leaflets. However, there is a lack of information
about the process of 3D calcification formation,
flutter dynamics of leaflets and other pertinent
hemodynamic factors. So far, numerous studies
regarding FSI modelling of the aortic valve
calcification have attempted to incorporate the effect
of calcification as an increase in the thickness of the
valve with the assumption of uniform distribution or
the stiffness of the leaflets (Gilmanov et al., 2019;
Oks et al., 2022). Gilmanov et al. (2019) conducted a
Daryani, R., Ersan, C. and Ã
˘
Gelebi, M.
Hemodynamic Characterization of Localized Aortic Valve Calcifications.
DOI: 10.5220/0012054100003546
In Proceedings of the 13th International Conference on Simulation and Modeling Methodologies, Technologies and Applications (SIMULTECH 2023), pages 37-48
ISBN: 978-989-758-668-2; ISSN: 2184-2841
Copyright
c
2023 by SCITEPRESS – Science and Technology Publications, Lda. Under CC license (CC BY-NC-ND 4.0)
37

patient-specific FSI simulation to study the effect of
varying leaflet stiffness in transvalvular
hemodynamics.
It is reported that the calcification pattern and its
growth over time are not random. In an examination
of a group of patients with calcified aortic leaflets, it
was found that the spatial distribution of calcium
deposits has two identified patterns (Thubrikar et al.,
1986). The first one is located along the coaptation
line of the leaflets and is named the coaptation
pattern. The other one is the radial pattern which is
seen along the attachment line of the leaflets. Halevi
et al. (2015) implemented a new reconstructing
technique of 3D-geometry of calcification initiation
and growth which confirms the work of Thubrikar et
al. (1986). They found that calcification patterns
strongly affect the mechanical flexibility of the
leaflets and also their orifice area. Halevi et al. (2016)
analyzed the hemodynamic effect of 3D patient-
specific calcification patterns of the aortic valve by
using Fluid-Structure Interaction (FSI) simulations.
Their results revealed that the presence of calcific
deposits dramatically influences the flow shear
stresses. Although it has paved the way to study the
hemodynamic effect of calcification patterns, there is
little focus on other hemodynamic parameters, such
as wall shear stress-based analysis.
In this study, we developed computational 3D
models of the calcified aortic valve using the FSI
approach within an Immersed Boundary (IB)
framework combined with Finite Element (IBFE)
(Griffith and Luo, 2017). Simulations were
established based on 3D geometries for different
grades of deposition accumulation, which can be
classified as Grades 1-6. The results are obtained and
analyzed for a single aortic flow condition where
aortic pressure fluctuates around 120-80 mmHg for
the healthy case. For graded cases, while outflow
pressure is identical to the healthy case, inflow
pressure increases with the severity of the
calcification grade. Quantification of the critical
parameters in blood flow is performed by using
numerous transvalvular hemodynamic and WSS-
based indexes. Additionally, the effect of deposition
patterns on the vortical structures of the flow field is
investigated. The influence of calcification severity
on aortic valves is studied by using transvalvular
hemodynamic indexes such as energy loss, aortic jet
velocity, kinetic energy and the average magnitude of
the velocity. To the authors’ best knowledge, this is
the first attempt to discuss the comprehensive
hemodynamic characterization of localized aortic
valve calcification using a range of calcification
grades.
2 MATERIAL AND METHODS
The mathematical model of our hemodynamic FSI
coupling algorithm will be discussed first, then model
geometry and further details in the numerical scheme
and boundary conditions will be presented.
2.1 Mathematical Modeling
The FSI approach we used is based on the IBFE
formulation proposed by Griffith and Luo (2017).
Deformation, elasticity and stresses of the immersed
structure are described by a Lagrangian form, while
the Eulerian form is used to describe the
incompressible Navier-Stokes equations. Let 𝛺∈ℝ
and 𝐱𝑥,𝑦,𝑧 ∈𝛺 denote the physical domain for
the coupled fluid-structure system and the
corresponding Cartesian coordinates, respectively.
Let 𝑈∈ℝ
denote the initial coordinate system for
the structure, represented by the curvilinear
Lagrangian coordinates
𝑞,𝑟,𝑠
∈𝑈. At time 𝑡,
𝛘𝐗,𝑡
describes the position of the material point 𝐗;
then, the structure and the fluid occupy the regions
𝛘𝑈,𝑡
𝛺
and 𝛺
𝑡
𝛺\𝛺
at time 𝑡,
respectively.
The equations of motion for the coupled fluid-
structure system in IB form are:
𝜌
𝜕𝐮
𝜕𝑡
𝐱,𝑡
𝐮
𝐱,𝑡
∙∇𝐮
𝐱,𝑡
∇𝑝
𝐱,𝑡
𝜇∇
𝐮
𝐱,𝑡
𝐟
𝐱,𝑡
(1)
∇∙𝐮
𝐱,𝑡
0 (2)
𝐟
𝐱,𝑡
𝐅
𝐗,𝑡
𝛿𝐱
𝛘
𝐗, 𝑡
𝑑𝐗
(3)
𝜕
𝛘
𝜕𝑡
𝐗,𝑡
𝐮
𝛘
𝐗,𝑡
,𝑡
𝐮
𝐱,𝑡
𝛿𝐱
𝛘
𝐗, 𝑡
𝑑𝐱
(4)
Eqs. 1 and 2 are the incompressible momentum
and continuity equations, where 𝜌 and 𝜇 are the
density and the dynamic viscosity, 𝐮
𝐱,𝑡
and 𝑝
𝐱,𝑡
are the Eulerian velocity and pressure fields, and
𝐟
𝐱,𝑡
is a body force term representing the Eulerian
elastic force density which is applied to the fluid by
the structure. Eqs. 3 and 4 describe the interaction
between the Lagrangian and Eulerian domains by
integral transformation with a Dirac delta
function 𝛿
𝐱
𝛿
x
𝛿
y
𝛿
z
in three dimensions.
Eq. 3 defines the conversion of Eulerian elastic force
SIMULTECH 2023 - 13th International Conference on Simulation and Modeling Methodologies, Technologies and Applications
38

density 𝐟
𝐱,𝑡
into the Lagrangian elastic force
density 𝐅
𝐗,𝑡
, while Eq. 4 specifies the no-slip
condition of the viscous fluid on the fluid-structure
interface.
2.2 Model Geometry
The geometry of the healthy aortic valve is illustrated
in Figure 1. The primary CAD model is obtained from
work of Wang (2015) and the ascending aorta section
is added as a straight tube for the sake of simplicity.
The housing height in Figure 1 is 0.116 m with an
inlet diameter of 0.025 m and a wall thickness of
0.001 m. The height of the aortic valve is 0.015 m and
its uniform thickness is 0.0005 m.
As stated in the work of Thubrikar et al. (1986),
the locations of deposits are not random and they
gradually develop along the coaptation line or near to
the aortic root. Based on the work of Bahler et al.
(1999), the severity of the calcification can be
classified into several grades, which are described as:
Grade 1 represents no calcification,
Grade 2 represents the localized area of
increased reflectivity but no areas of dense
calcification,
Grade 3 represents markedly increased
reflectivity (calcification) in one leaflet but
equal to or less than Grade 2 changes in
other leaflets,
Figure 1: Reference geometry of the aortic valve for all
calcification models.
Grade 4 represents markedly increased
reflectivity in two leaflets but equal to or less
than Grade 2 changes in the third leaflet,
Grade 5 represents moderately increased
reflectivity in all leaflets,
Grade 6 represents severely increased
reflectivity in all leaflets.
Grade 3 Grade 4 Grade 5 Grade 6
Top view
Bottom view
Isometric view
Figure 2: Geometries of the calcification grades merged with the reference aortic valve geometry.
Hemodynamic Characterization of Localized Aortic Valve Calcifications
39
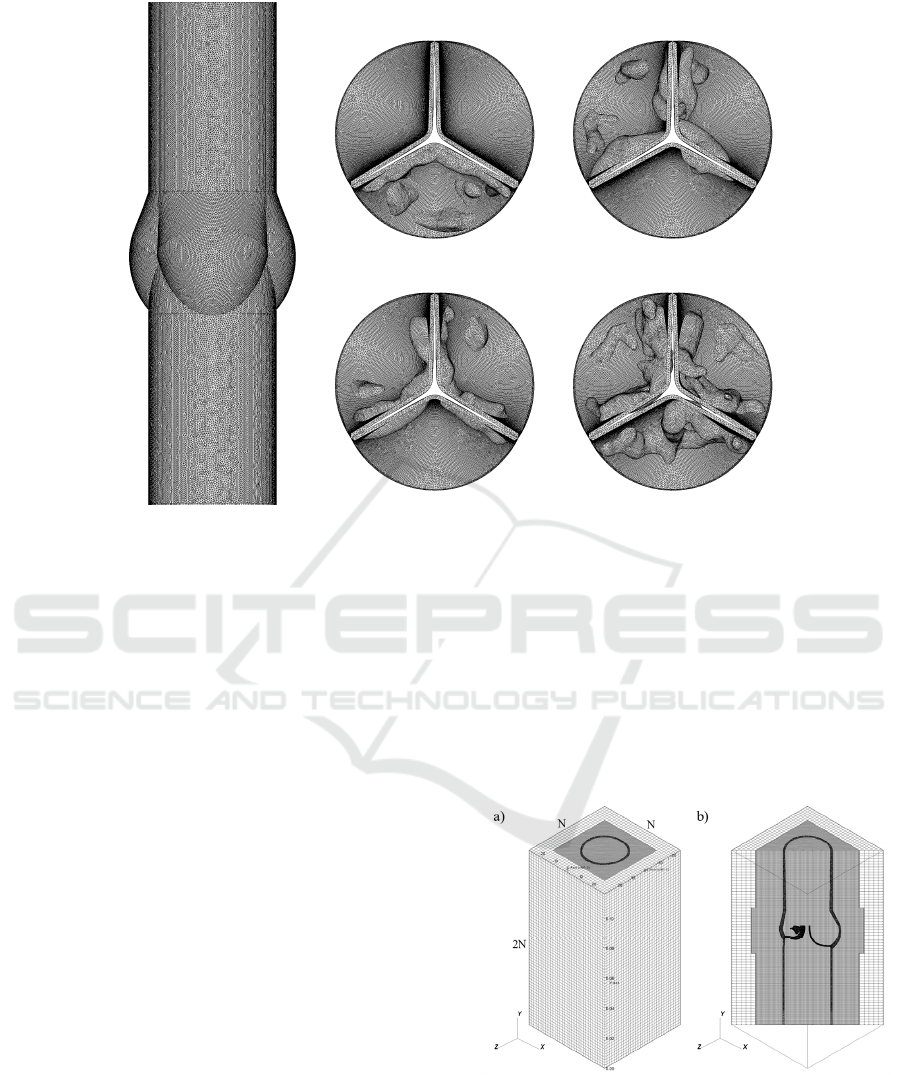
Figure 3: Illustration of the unstructured mesh of a) housing, b-e) each valve of Grades 3-6, respectively.
Due to the lower impact of Grade 2 calcification, we
ignored this grade in our simulations and the
geometries were created for Grades 3-6. Calcification
geometries are adopted from the 3D geometries in the
work of Lavon et al. (2019) and they were merged
with our reference geometry of the aortic valve
model. Model geometries are generated based on the
patterns using medical classifications presented in the
work of Bahler et al. (1999) for several grades, which
are illustrated in Figure 2. It should be noted that the
geometry of Grade 6 is the only case where the
calcific deposition is visible from the bottom view
(see in Grade 6 in Fig. 2).
2.3 Numerical Schemes and Boundary
Conditions
The fluid mesh treatment of our IB method uses a
staggered, block-structured fixed Cartesian grid to
discretize the Eulerian variables, velocity, pressure
and force density (Griffith, 2017). The divergence,
gradient, and Laplace operators are approximated
using standard second-order accurate finite difference
methods (Griffith, 2009). A version of the piecewise
parabolic method (PPM) is used to discretize the
convective term in momentum equation (Colella et
al., 2017). The Lagrangian variables associated with
the immersed structure are discretized using an
unstructured finite element mesh.
2.3.1 Structure Mesh
Figure 3a represents the reference housing and in
Figures 3b-e, the structure meshes of each grade are
illustrated. For whole structure mesh, unstructured
first-order tetrahedral elements are used. The total
number of structure mesh elements are 1.89, 1.88,
1.93 and 2.12 million for Grades 3-6, respectively.
For healthy case, the number of mesh elements is 1.86
million.
Figure 4: Computational mesh for the calcified aortic valve
model, a) Isometric view, b) Cross-diagonal section view.
a
)
b)
c
)
d
)
e
)
SIMULTECH 2023 - 13th International Conference on Simulation and Modeling Methodologies, Technologies and Applications
40
2.3.2 Fluid Mesh
The fluid domain is considered as a Cartesian box and
discretized by N × 2N × N mesh elements in x, y, and
z directions, respectively. A static mesh refinement
level with a refinement ratio of 2 is used near the
immersed interface, as shown in Figure 4. In the
simulations, N is taken as 64, which leads to a total
fluid mesh of about 2.15 million mesh elements with
the dimensions of 0.058 m × 0.116 m × 0.058 m.
2.3.3 Constraints and Boundary Conditions
The housing structure is anchored to the top and
bottom surfaces of the physical domain. This is done
by assigning integer numbers to each surface in
ICEM CFD® software during the meshing process,
then imposing zero displacement constraints on the
top and bottom surfaces of Figure 4. Wall boundary
conditions are applied on the bottom and top
boundaries. For the side boundaries of the physical
domain, zero tangential velocity and zero normal
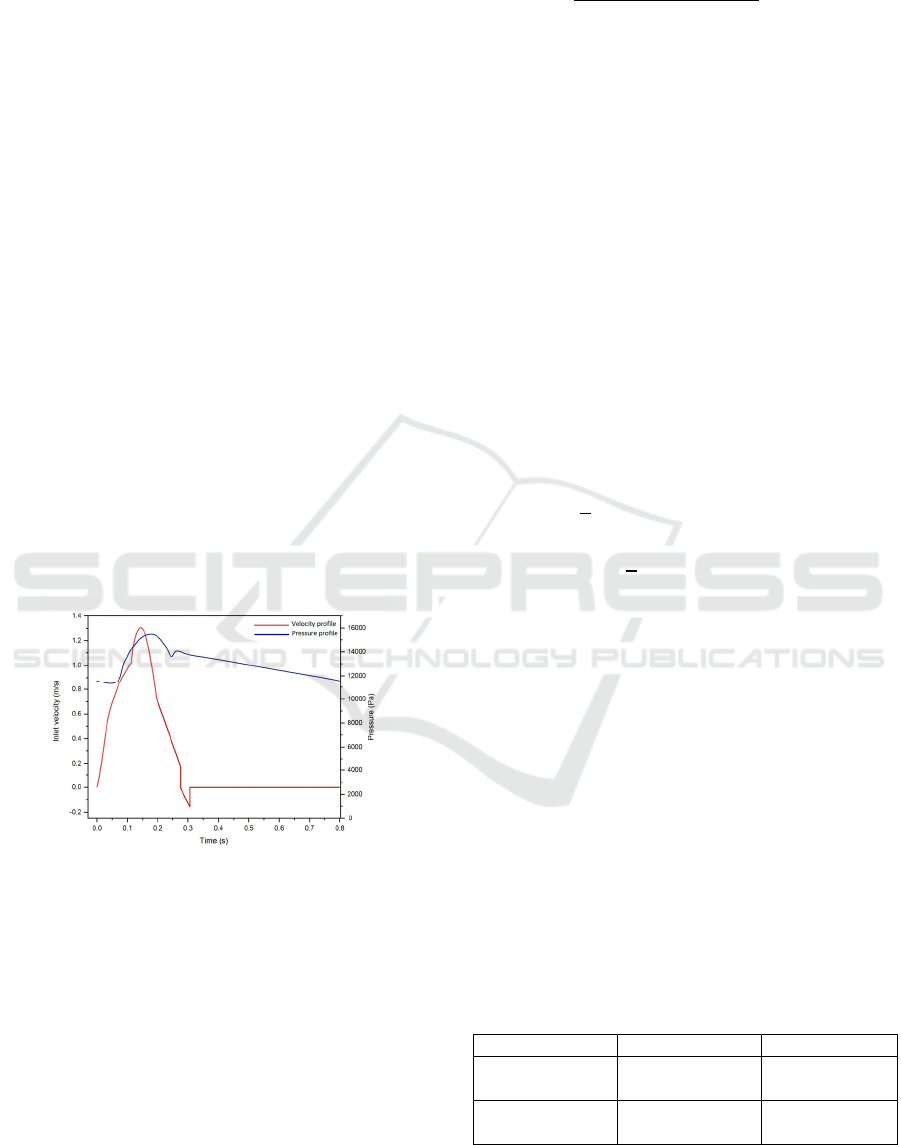
velocity gradient conditions are employed. In Figure
5, the velocity profile is used as the inflow and the
pressure profile is implemented as the outflow
boundary condition on the circular domains located at
the bottom and top walls of the computational box,
respectively.
Figure 5: The inflow and outflow boundary conditions for
the calcified aortic valve model, a) Inlet velocity profile
(Spühler et al., 2018), b) Outlet pressure profile
(Rubenstein et al., 2015).
2.3.4 Numerical Implementation
An explicit version of Crank Nicolson–Adams
Bashforth scheme is employed for time stepping with
a step size of ∆𝑡 1.0 10
-5
s. Blood is modeled as
a single-phase Newtonian fluid with a dynamic
viscosity and density of 0.0035 Pa∙s and 1056 kg/m
3
,
respectively. The flow is transient and the simulations
are performed initially for one cardiac cycle (0.8 s).
We used the open source IBAMR software
framework (https://ibamr.github.io/) for our models.
Simulations run on The National Center of High-
Performance Computing of Turkey (UHeM). We
used InfiniBand®-based (FDR, 56 Gbps) computing
cluster with two compute nodes, each consisting of an
Intel® 2.4 GHz Xeon® E5-2680 v4 processor with 28
cores and 128 GB of memory. We observed a parallel
speedup factor of nearly 1.5 by doubling the number
of processors in up to two nodes (56 cores). However,
by employing three nodes, the parallel performance
reduces due to network communication and high
frequency parallel I/O. So we decided to employ two
compute nodes due to the performance/cost ratio.
Each simulation took approximately 200 hours of
wall clock time. The typical total CPU hours for each
simulation was around 11500.
2.3.5 Material Model
As the material model of the aortic valve, a Neo-
Hookean hyper-elastic model is used and its strain
energy distribution function is given as
𝐖
𝜇
2
𝐼
3
𝜇ln
det
𝐹
𝜆
2
ln det
𝐹
(5)
where λ, 𝜇 are the Lame constants of linear
elasticity and 𝐹 is the deformation gradient. In our
model, the aortic valve and the housing are
considered to be incompressible
det
𝐹
1
.
1
st
Piola–Kirchhoff stress tensor can be written as
ℙ𝜇𝐹
𝜆ln
det
𝐹
𝜇
𝐹
(6)
The housing is modeled as a semi-rigid tube.
Calcified deposits are modeled as a linear elastic
material with Young's modulus of 2 MPa and
Poisson's ratio of 0.45. 1
st
Piola–Kirchhoff stress
tensor for a linear elastic model is
ℙ𝜇𝐹𝐹
2𝐼𝜆tr
𝐹𝐼
𝐼
(7)
The list of material parameters is given in Table 1.
Table 1: Material properties for the calcified aortic valve
models.
Part Material model Parameters
Aortic valve Neo-Hookean
𝜇140 kPa
𝜆17 MPa
Calcifications Linear elastic
𝐸2 MPa
𝜈0.45
Hemodynamic Characterization of Localized Aortic Valve Calcifications
41

3 NUMERICAL RESULTS AND
HEMODYNAMIC
CHARACTERIZATION OF
CALCIFIED AORTIC VALVE
The calcification of leaflets can result in their
deterioration and remodeling, which in turn leads to a
shorter life span of the Bioprosthetic Heart Valve
(BHV) and, in general, reduces the functionality of a
valve. Subsequent changes in transverse pressure
gradients and shear forces may lead to further
complications, which make localized calcifications
necessary to be investigated. Thus, hemodynamic
alteration in the aortic valve region due to
calcification plays a key role in problems associated
with VHD. In the following sections, the flow
patterns for various calcification grades and
underlying hemodynamic parameters divided into
Transvalvular hemodynamic and Wall Shear Stress
(WSS) based indexes will be discussed.
3.1 Analysis of Flow Pattern
For a better understanding of the calcification effects
on valve leaflets, at first, velocity vectors of flow
around healthy aortic valve will be compared with the
calcified cases shown in Figure 6. Initially, the
leaflets remain closed until the pressures are
equalized on the ventricular and aortic sides. When
the pressure increases on the ventricular side, the
valve starts to open around 𝑡0.02 s. The valve
opens in a form with a fully circular orifice area
before the velocity reaches its peak at the systole
phase. The blood moves through the valve into the
ascending aorta without any significant flow
deformation until this time instant. After the peak
systole, when the jet velocity decreases, several
vortices are generated due to the flow separation from
leaflet tips. When the jet velocity approaches zero
during the late systole, the leaflet closure occurs due
to the backflow into the Valsalva sinus region filling
the valve packets as a result of the hemostatic effect.
Arantius nodules and coaptation lines are observed to
be well aligned spatially and temporally. As expected,
no flow is observed behind the leaflets during the
opening phase. However, vortical flow patterns can
be seen within the packets when the valve closes. In
the final figure at 𝑡 0.30 s, some regurgitation is
observed in the middle area close to the Arantius
nodules of all three leaflets.
As stated in Section 2.2 before, Grade 3
represents the case that only one leaflet is involved
with calcification. Due to relatively increased valve
stiffness as a result of calcification, leaflets undergo a
sudden opening with a delay. However, in healthy
case valves open earlier and the slope of the velocity
increment is smoother. Therefore, at the beginning of
the systole blood velocity is higher in healthy case.
Blood flow passes the valve orifice in a spatially
asymmetric manner due to unstable displacement of
one leaflet. This asymmetry shifts the flow towards
the ascending aorta wall and diverges from symmetric
flow which the healthy case has. As a result of this
deflection, flow circulates toward the calcified leaflet
which can be seen in the plots of 𝑡0.15, 0.185 s.
This flow circulation contributes to an earlier closure
of the calcified leaflet that is shown in plots of 𝑡
0.27, 0.30 s. In the healthy aortic valve, the jet flow
passing the orifice retains its uniform shape; however,
the constrained leaflet disturbs the flow and thus the
jet flow becomes chaotic. While healthy aortic valve
closes by the end of 𝑡 0.30 s, Grade 3 calcified
valve closes with a slight delay.
In Grade 4 calcified aortic valve, two leaflets have
notable calcium deposits on their upper surface facing
to ascending aorta. More intense calcification leads to
more valve resistance which results in a lower orifice
area and increased jet velocity. Furthermore, the jet
becomes narrower and centric whereas it is more
uniformly distributed for the healthy case. In contrast
to Grade 3, in the Grade 4, the flow is more centric in
the systole phase, but due to the earlier closure of the
strongly calcified two leaflets, the flow deviates. This
shifts the blood flow toward the third leaflet which
can be observed in figures of 𝑡0.27, 0.35 s. This
flow deviation creates a strong vortex in the
ascending aorta region, and this leads to a higher
energy dissipation.
By comparing the results of the velocity vectors
for the blood flow of Grade 5 with previous cases, it
is seen that increasing calcification severity leads to a
stronger jet flow and unstable closure of leaflets.
Also, due to the reduced orifice area, the jet flow
width becomes smaller. In Grade 5 case, deposit
distribution is almost symmetric and we observe an
almost symmetric blood flow comparing to Grade 4.
The leaflet with no deposit, takes a concave form in
early systole phase and during the valve closure in the
late systole phase, it deviates the flow toward the
ascending aorta wall. The resulting collision creates
vortices in the ascending aorta after valve closure.
Grade 6 calcification case is the most severe one and
as expected the strongest jet flow is observed. In
comparison with the Grade 3 case, there is an increase
of about 25% in the jet velocity magnitude. The
length and duration of the aortic jet are measured
maximum due to the smallest Geometric Orifice Area
SIMULTECH 2023 - 13th International Conference on Simulation and Modeling Methodologies, Technologies and Applications
42

Healthy
Grade 3
Grade 4
Grade 5
Grade 6
Figure 6: Illustration of flow vectors [m/s] at different times over a cardiac cycle for various calcification cases.
𝑡0.02 s
𝑡0.065 s
𝑡0.15 s
𝑡0.27 s
𝑡0.30 s
Hemodynamic Characterization of Localized Aortic Valve Calcifications
43

(GOA) where jet width is minimum. The relatively
symmetric distribution of the deposits on all three
leaflets, their opening and closure is almost
symmetrical. However, the latest valve opening is
observed with the smallest GOA generating the
strongest vortex structures. Because of the narrower
jet flow, the strongest backflow circulations toward
the leaflets are observed in the ascending aorta.
3.2 Transvalvular Hemodynamic Index
Analysis
Disturbed hemodynamics of unsteady aortic flow in
the presence of localized calcifications can be
characterized by some hemodynamic parameters that
are utilized in the early detection of valvular heart
diseases. Calcification affects the aortic valve
kinematics and reduces its functionality by
decreasing the amount of blood passed through the
leaflets.
Variation of the GOA in healthy and calcified
aortic valves for a time range of half a cardiac cycle
is given in Figure 7. Based on the published clinical
data by Thubrikar (1990), the Aortic Valve Area of a
healthy aortic valve is within the range of 3.9 ± 1.2
cm
2
and our results for the healthy case agree and
align with this range.
Figure 7: Geometric orifice area (GOA) variation for the
healthy and calcified aortic valve in a half-cardiac cycle.
It can be observed that calcification greatly affects
leaflet openings and the resulting orifice area
reduction is remarkable. Results show that, with the
increased calcification, openings of the valve leaflets
are delayed. In the healthy aortic valve, leaflets
opening occurs around 0.02 s; however, for the
diseased cases opening time is about 0.05 s. The main
reason for this is the increased resistance of calcified
leaflets. In the healthy aortic valve case, the GOA
profile follows the trend of the inlet profile where the
orifice area increases until the peak systole and
decreases until valve closure. In contrast, the trend of
the calcified cases is completely different and there is
a sudden reduction at nearly 0.13 s. Additionally, by
comparing the GOA curves of the calcified cases, it
can be observed that by increasing the calcification
intensity, leaflets closure occurs more gradually.
Similar to the delay in the opening phase, the delay in
the closure of the leaflets is observable for the
calcified cases. Furthermore, in these cases, there are
increments in the GOA after the valve closure
referring to a severe delay in the closing of coaptation
lines. In this situation, severe regurgitation occurs due
to the closing delay of the valve leaflets, resulting in
insufficient blood flow to the ascending aorta. In the
diseased cases, the increased stiffness of the leaflets
leads to increasing ventricle pressure resulting in
small inflation at the bottom section of the model
wall. As stated, by looking at the GOA curves of the
calcified cases, there is an increment after about 0.36
s. One of the reasons for this bump might be the
depletion of the stored fluid volume in the inflated
section of the model wall even after the early diastole.
Another transvalvular hemodynamic parameter is
the maximum velocity, 𝑉
, of the jet passing
through the aortic orifice area. By using this
parameter, pressure drop across the valve can be
calculated using the simplified Bernoulli equation. In
Figure 8, the maximum velocity of flow passing
through the orifice area for healthy and calcified cases
is given. Results show that increasing the
calcification severity directly raises the jet velocities
due to the decreased orifice area to maintain the flow
rate.
One important observation is the early drop of jet
velocity near t = 0.2 s at Grade 4 where two leaflets
are constrained by deposit and the third one is free to
move. This result reveals that calcification severity is
not the only reason for the velocity increment and
divergence but also pattern asymmetry plays an
important role.
Figure 8: The variation of the maximum jet velocity 𝑉
for healthy and calcified valves in a half cardiac cycle.
The third transvalvular hemodynamic parameter
is the rate of energy dissipation. This parameter
determines the instantaneous power loss of blood
flow. It is measured in Watts and can be calculated by
𝐸
𝑡
𝛷𝑑𝑉. In this equation, 𝛷
SIMULTECH 2023 - 13th International Conference on Simulation and Modeling Methodologies, Technologies and Applications
44
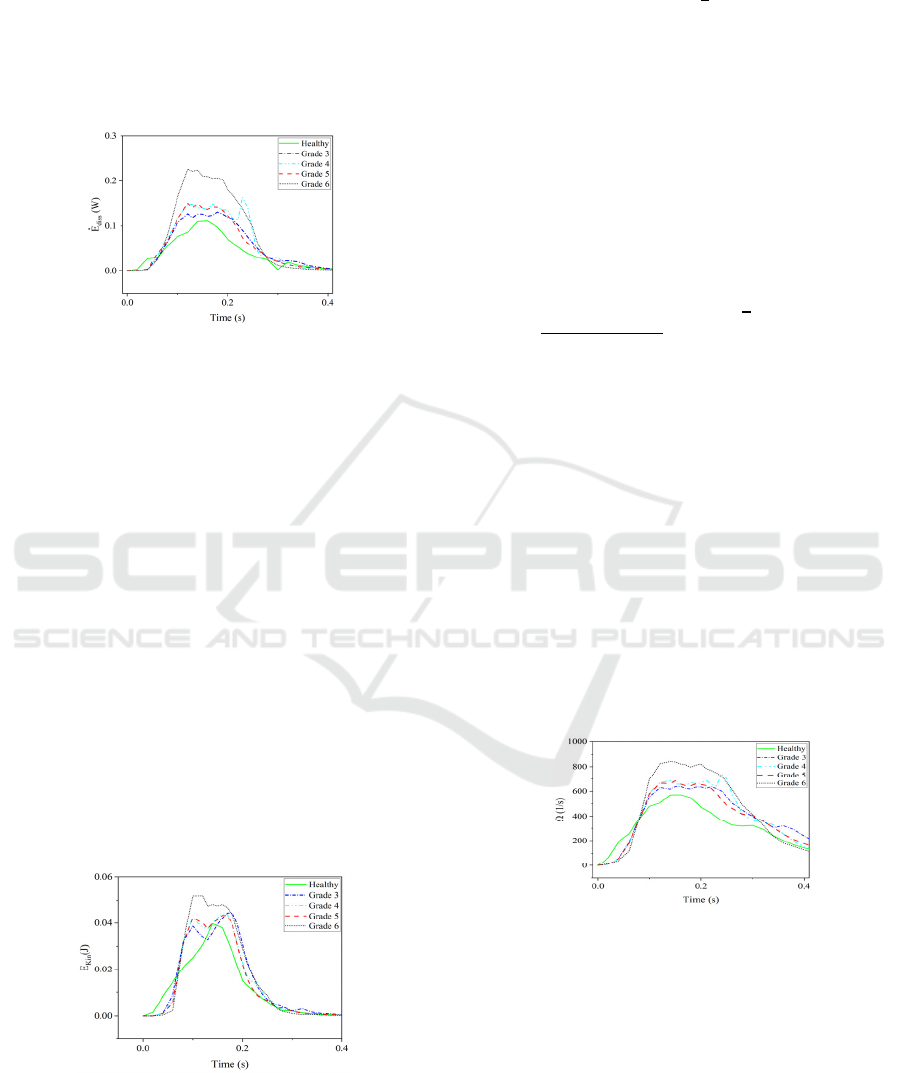
𝜏⨂𝛻𝜈 represents a dissipation function where 𝜏 is the
viscous shear stress tensor, and 𝐸
𝑡 is the power
loss in the Valsalva sinus region and the following
ascending aorta. This parameter explains the shear-
related energy dissipation due to the viscous blood
flow and the presence of aortic stenosis. The variation
of this parameter over a half-cardiac cycle is
presented in Figure 9.
Figure 9: The variation of rate of energy loss for healthy
and calcified valve models in a half cardiac cycle.
These results prove that the increasing severity of
the stenosis as a result of aortic valve calcification
leads to a higher energy dissipation of the blood flow.
The value of energy dissipation for the healthy case,
in general, is minimum among all cases due to the
least resistance to blood flow. For Grade 3 at peak
systole, an increase of 10% in energy dissipation is
seen in comparison with the healthy case. For Grades
4 and 5 the results are close to each other which
implies that the rate of energy loss for higher
calcification on two leaflets is similar to the rate of
moderate calcification on the three leaflets. The
sudden increase in the late systole for Grade 4 might
be due to the higher flutter of the leaflets during their
closure phase and consequently the creation of the
strong vortices that lead to a higher energy
dissipation. The highest energy dissipation belongs to
the Grade 6 case which is the severe stenosis disease
and energy dissipation is doubled in comparison with
the healthy aortic valve.
Figure 10: The variation of the kinetic energy (𝐸
) of the
blood flow in a half cardiac cycle for a healthy and calcified
aortic valve.
The kinetic energy of the blood flow is the other
important hemodynamic parameter and can be
determined by 𝐸
𝑡
𝜌
𝜐
𝑑𝑉 which is
directly integrated over the aorta’s volume. 𝐸
describes the mechanical energy of the blood flow,
which is exchanged with pressure and the viscous
dissipation terms. In Figure 10, this parameter is
illustrated for healthy and calcified cases. Similar to
the previous hemodynamic parameters, increasing the
severity of the calcification tends to increase the
amount of kinetic energy which leads to an increased
energy dissipation and decreased pressure drop.
The last transvalvular hemodynamic index is the
average magnitude of the vorticity which is measured
in the volume of aorta. The magnitude of vorticity can
be quantified using 𝛺
𝑡
|
𝛺
|
𝑑𝑉,
where
|
𝛺
|
𝑤
𝑤
𝑤
, 𝛺
𝛻v
. Figure 11
shows that the vorticity structure of the blood flow is
amplified by increasing the severity of the
calcification. Similar to the other parameters Grade 6
has the highest values except opening and closing
phases of the valve leaflets. In other words, high
amount of calcification results in the generation of the
strong vortices which leads to a larger energy
dissipation rate at time interval t = 0.05 - 0.30 s. In
comparison with healthy case in which the vorticity
magnitude increases until peak systole and decreases
after it, the value of this parameter changes within a
narrow range after valve opening until the beginning
of late systole phase at about 𝑡0.30 s. One main
reason for this is that the valve leaflets start to flutter
at this time range and generate strong vortices at their
tip region.
Figure 11: History of vorticity (𝛺
) calculated for healthy
and different calcified valves over a half cardiac cycle.
3.3 WSS Based Hemodynamic Index
Analysis
In general, hemodynamic parameters and/or indexes
can be used for quantifying some cardiovascular
diseases. An important group of these parameters can
be classified as the Wall Shear Stress (WSS) based
hemodynamic indexes. The viscous stresses exerted on
the wall surface by the fluid is explained by WSS,
Hemodynamic Characterization of Localized Aortic Valve Calcifications
45

|
WSS
|
𝑛
.𝜏
where 𝑛
is surface normal vector and
𝜏
is viscous stress tensor. In this work, we will be
discussing the results of Time Averaged Wall Shear
Stress (TAWSS), Oscillatory Shear Index (OSI),
Relative Residence Time (RRT), and Transverse Wall
Shear Stress (transWSS) indexes for different cases of
the healthy and calcified aortic valves.
Comparing the results of healthy and calcified
aortic valve cases in Figure 12, it is observed that the
growth of the calcification deposits increases the value
of TAWSS both at the edges of the leaflets and the
radial region. Furthermore, the intensity of the
calcification also leads to an increase in TAWSS. By
investigation of the results in Grade 3, it can be
observed that TAWSS reaches to higher values at the
tip of the non-calcified leaflets. This is caused by the
shear loads as a result of the extra transverse pressure
gradient fluctuations and by the fluttering movement as
a result of the limited opening of the calcified leaflets.
In other grade cases, TAWSS values are slightly
increased with the larger volume of deposits and
spatially span more area. One of the reasons for this is
that the shear stress rises at the tips of the leaflets as a
result of the higher jet velocity and sharper pressure
fluctuations which occur due to the narrowing of the
orifice area.
OSI index has a scalar ranging between 0 and 0.5,
and it is used to determine whether a flow is laminar
(unidirectional) or oscillating (turbulent). The critical
point to know is that it does not give any information
about the actual magnitude of the oscillation. Figure
12 shows that there is a significant WSS oscillation
on the surfaces of the valve leaflets. Additionally,
relatively lower OSI values can be observed on
surfaces with large calcification deposits. On the
other hand, OSI values are relatively lower in the root
regions of healthy case.
Relative RRT represents the relative duration that
blood resides close to a wall in one cardiac cycle.
Comparing the RRT results, it is seen that maximum
values appear at the roots of the leaflets and minimum
values are at the edges of the leaflets due to the short
residence time of blood in this region. Additionally,
increasing the calcification level leads to an increase in
the RRT values and the maximum values are observed
in the Grade 6 case. For each case, RRT values appear
to be particularly higher in the root regions of the
calcified leaflets. This means that the blood stays for a
relatively long time behind the calcification deposits.
The final WSS based hemodynamic index studied
is the transWSS, which is defined as the average of
WSS components perpendicular to the temporal mean
WSS vector over a cardiac cycle. By observing the top
views given in the last column of Figure 12, the
presence of calcification slightly increases the
transWSS values. For example, in Grade 3, transWSS
values on calcified leaflets are slightly higher
compared to the healthy leaflets. As it is known,
transWSS basically looks at the variation of stresses in
lateral directions perpendicular to the main flow
direction. Therefore, increase in transWSS occurs due
to the greater lateral load components as a result of
temporally and spatially unstable fluctuations in cases
with increasing generally asymmetric patterned
calcifications.
4 DISCUSSION
In this study, we developed an FSI model for the
aortic valve and investigated the effect of several
grades of localized calcifications. For the first time in
the literature, a comprehensive hemodynamic
characterization is conducted for an aortic flow in the
presence of medically graded localized calcifications.
We conducted three stage analysis: analysis of flow
pattern, study of transvalvular hemodynamic indexes
and WSS based index analysis.
Our initial results showed that increasing
calcification severity leads to a stronger jet flow and
unstable closure of leaflets. However, we also
observed that asymmetric pattern of the localized
calcifications may lead to a spatially and temporally
unstable behavior of the valve leaflets even if
calcification volume is not larger. Due to the reduced
orifice area, the jet flow width becomes smaller and
blood flow passes the valve orifice as spatially
asymmetric flow due to unstable displacement of
leaflets. This asymmetry shifts the flow towards the
ascending aorta wall and exposes the wall to a higher
wall shear stress for a limited period of time. But this
periodical WSS impact may lead to erode of
endothelial surface of ascending aorta with time. With
the increasing calcification grades opening of the
valves are delayed, flow velocities significantly
increased due to the limited GOA and severe chaotic
flow in ascending aorta are observed at the late systole
phase. This flow regime generates a significant back
flow and recirculation to a Valsalva sinus and root
region of the valve. Another potential effect of this
flow is the redirection of the feeding flow at the right
and left coroner artery entries. It is clear that there is a
need for further analysis of this back flow effect locally
on the right and left coroner entry zones whether the
rate of blood flow is reduced or not. Another important
finding in this study is to observe a higher energy
dissipation of blood flow due to the increasing severity
of aortic valve calcification.
SIMULTECH 2023 - 13th International Conference on Simulation and Modeling Methodologies, Technologies and Applications
46
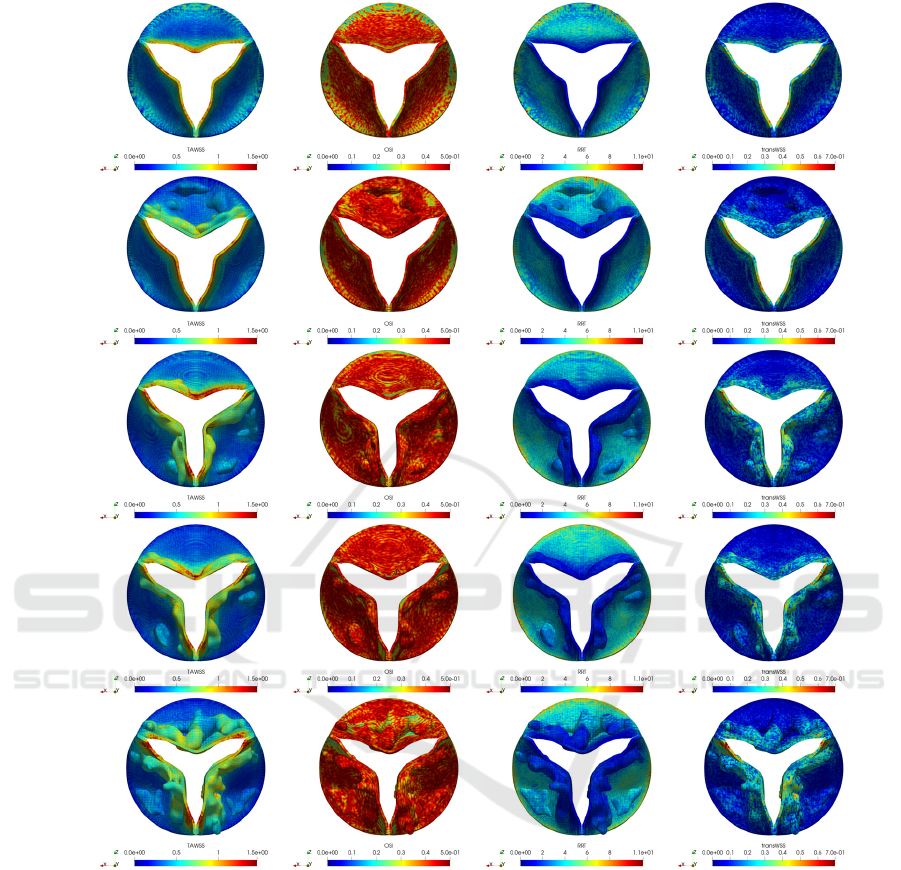
TAWSS [Pa] OSI
RRT [Pa
-1
]
transWSS [Pa]
Healthy
Grade 3
Grade 4
Grade 5
Grade 6
Figure 12: WSS based hemodynamic indexes for healthy and different grade calcification cases.
The variation of the maximum jet velocity 𝑉
is
also align with the energy dissipation behaviour of
blood flow which is exposed to a higher resistance.
Similarly, increasing severity of the calcification
tends to increase both the amount of kinetic energy
and the vorticity structure of the blood flow which
lead to an increased energy dissipation and decreased
pressure drop. TAWSS and OSI indexes show that
growth in localized calcification leads to an increase
of these two indexes. WSS values are mostly
increased at the edges of the leaflets and flow
oscillations occur everywhere in the Valsalva sinus
compared to healthy case. Moreover, residence time
of the blood slightly increased at the root region but
significantly reduced at the edges of the leaflets.
When we combine low TAWSS and transWSS with
high RRT, we can conclude that the root region may
be a good candidate for further formation of the stasis
which is the initial stage of thrombosis according to
the low shear stress theory. Similarly, combination of
high TAWSS, OSI and transWSS may lead to a
thrombosis formation at the edges of the valves based
on the high shear stress theory.
For a future work, two and more phase FSI blood
flow models are needed to observe RBC and platelet
Hemodynamic Characterization of Localized Aortic Valve Calcifications
47

aggregations around both back region of the aortic
valve and edges of the leaflets.
ACKNOWLEDGEMENTS
This work is funded by the Scientific and
Technological Research Council of Turkey
(TUBITAK) as ARDEB 1001 project under the grand
number 120M671. Computing resources used in this
work were provided by the National Center for High-
Performance Computing of Turkey (UHeM) under
grant number 5010662021.
REFERENCES
Bahler, R. C., Desser, D. R., Finkelhor, R. S., Brener, S. J.,
& Youssefi, M. (1999). Factors leading to progression
of valvular aortic stenosis. The American journal of
cardiology, 84(9), 1044-1048.
Colella, P., & Woodward, P. R. (1984). The piecewise
parabolic method (PPM) for gas-dynamical
simulations. Journal of computational physics, 54(1),
174-201.
Freeman, R. V., & Otto, C. M. (2005). Spectrum of calcific
aortic valve disease: pathogenesis, disease progression,
and treatment strategies. Circulation, 111(24), 3316-
3326.
Gilmanov, A., Barker, A., Stolarski, H., & Sotiropoulos, F.
(2019). Image-guided fluid-structure interaction
simulation of transvalvular hemodynamics:
Quantifying the effects of varying aortic valve leaflet
thickness. Fluids, 4(3), 119.
Griffith, B. E. (2009). An accurate and efficient method for
the incompressible Navier–Stokes equations using the
projection method as a preconditioner. Journal of
Computational Physics, 228(20), 7565-7595.
Griffith, B. E., & Luo, X. (2017). Hybrid finite
difference/finite element immersed boundary
method. International journal for numerical methods in
biomedical engineering, 33(12), e2888.
Halevi, R., Hamdan, A., Marom, G., Mega, M., Raanani,
E., & Haj-Ali, R. (2015). Progressive aortic valve
calcification: three-dimensional visualization and
biomechanical analysis. Journal of
biomechanics, 48(3), 489-497.
Halevi, R., Hamdan, A., Marom, G., Lavon, K., Ben-Zekry,
S., Raanani, E., ... & Haj-Ali, R. (2016). Fluid–structure
interaction modeling of calcific aortic valve disease
using patient-specific three-dimensional calcification
scans. Medical & biological engineering &
computing, 54, 1683-1694.
Halevi, R., Hamdan, A., Marom, G., Lavon, K., Ben-Zekry,
S., Raanani, E., & Haj-Ali, R. (2018). A new growth
model for aortic valve calcification. Journal of
Biomechanical Engineering, 140(10), 101008.
IBAMR. Immersed Boundary Method Adaptive Mesh
Refinement Software Infrastructure. Available at:
https://ibamr.github.io/. Accessed 10 January 2021.
Kappetein, A. P., Head, S. J., Généreux, P., Piazza, N., Van
Mieghem, N. M., Blackstone, E. H., ... & Leon, M. B.
(2013). Updated standardized endpoint definitions for
transcatheter aortic valve implantation: the Valve
Academic Research Consortium-2 consensus
document. The Journal of thoracic and cardiovascular
surgery, 145(1), 6-23.
Lavon, K., Marom, G., Bianchi, M., Halevi, R., Hamdan,
A., Morany, A., ... & Haj-Ali, R. (2019). Biomechanical
modeling of transcatheter aortic valve replacement in a
stenotic bicuspid aortic valve: deployments and
paravalvular leakage. Medical & biological
engineering & computing, 57, 2129-2143.
Luraghi, G., Matas, J. F. R., Beretta, M., Chiozzi, N., Iannetti,
L., & Migliavacca, F. (2020). The impact of calcification
patterns in transcatheter aortic valve performance: a
fluid-structure interaction analysis. Computer Methods
in Biomechanics and Biomedical Engineering, 24(4),
375-383.
Nudel, I. (2015). Characterization of the Mechanical
Anisotropic Behavior of the Aortic Valve Leaflets. Ben-
Gurion University of the Negev, Faculty of Engineering
Sciences, Department of Biomedical Engineering.
Oks, D., Samaniego, C., Houzeaux, G., Butakoff, C., &
Vázquez, M. (2022). Fluid–structure interaction
analysis of eccentricity and leaflet rigidity on
thrombosis biomarkers in bioprosthetic aortic valve
replacements. International Journal for Numerical
Methods in Biomedical Engineering, 38(12), e3649.
Otto, C. M. (2008). Calcific aortic stenosis—time to look
more closely at the valve. New England Journal of
Medicine, 359(13), 1395-1398.
Pandya, A. (2012). Optimizing Cardiovascular Disease
Screening and Projection Efforts in the United
States (Doctoral dissertation, Harvard University).
Rubenstein, D., Yin, W., & Frame, M. D. (2015). Biofluid
mechanics: an introduction to fluid mechanics,
macrocirculation, and microcirculation. Academic
Press.
Sadrabadi, M. S., Hedayat, M., Borazjani, I., & Arzani, A.
(2021). Fluid-structure coupled biotransport processes
in aortic valve disease. Journal of Biomechanics, 117,
110239.
Spühler, J. H., Jansson, J., Jansson, N., & Hoffman, J.
(2018). 3D fluid-structure interaction simulation of
aortic valves using a unified continuum ALE FEM
model. Frontiers in physiology, 9, 363.
Thubrikar, M. J., Aouad, J., & Nolan, S. P. (1986). Patterns
of calcific deposits in operatively excised stenotic or
purely regurgitant aortic valves and their relation to
mechanical stress. The American journal of
cardiology, 58(3), 304-308.
Thubrikar MJ (1990) The aortic valve. CRC Press Inc.,
Boca Raton
Wang, R., 2015. GrabCAD - CAD library. Grabcad.com.
Available at: <https://grabcad.com/ library/aorta-aortic-
valve-1> [Accessed 01 January 2021].
SIMULTECH 2023 - 13th International Conference on Simulation and Modeling Methodologies, Technologies and Applications
48
