
Apply an Integrated Responsible AI Framework to Sustain the
Assessment of Learning Effectiveness
Tsung-Nan Chou
a
Department of Finance, Chaoyang University of Technology, Taichung 41349, Taiwan
Keywords: Educational Data Mining, Explainable AI, Adversarial Training.
Abstract: Recent developments in educational data mining and learning analytics have increased the need for
explainable artificial intelligence to interpret the decisions or predictions made by the algorithms. In order to
analyse the impact of students' learning input on their learning effectiveness, an innovative responsible and
trusted AI framework was developed and implemented as three separate modules that covered five different
stages in this study. The first module developed various explainable artificial intelligence (XAI) models based
on the model grafting and model fusion techniques that concatenated or synergized a global model with
different local models. In addition, the local models were also supplemented by several explanation methods
to provide additional explanatory information for the explainable XAI hybrid model. The second module
constructed three different safeguard and auditing models to provide complementary predictions for students
being misidentified as normal students and discovered the students at risk of failing a course. The adversarial
training models developed in the third module applied AI generated synthetic data to train the proposed
models and evaluate their performance with an attempt to search for any possible competent models that
performed better. The framework was implemented by using Microsoft Power BI tools to create various
visualized and interactive dashboards to demonstrate the analysis outcomes.
1 INTRODUCTION
For educational institutions, they are currently facing
the era of AI and big data challenges, as the amount
of data generated has grown significantly. In addition
to increasing the complexity of data processing and
analysis, it also prevents school teachers from
analysing useful information in real time to improve
teaching effectiveness. However, data mining
technology and machine learning algorithms can help
teachers quickly and effectively explore meaningful
patterns and trends from a large amount of data, and
help them solve assessment problems of student
learning effectiveness. In particular, the rapid
progress of artificial intelligence and deep learning
technology has had a great impact on the entire
educational industry. Both the artificial intelligence
(AI) and machine learning (ML) provide innovative
solutions for learning effectiveness analysis. With the
advancement of information technology and the
diversification of teaching materials, teachers can use
the learning management systems (LMS) to provide
a
https://orcid.org/0000-0001-9093-682X
presentations, videos, online discussions, or Internet
resources to prevent students from getting boredom
and distress in learning. These platforms or systems
can not only collect and record students' learning
history and learning statistical information, but also
can use various models of educational data mining
and recently developed explainable artificial
intelligence (XAI) techniques to provide diagnosis,
prediction, and early warning analysis to improve
student learning outcomes.
To address the need of XAI and its importance in
education, the XAI-ED framework based on six key
aspects was carried out explicitly by Khosravi et al.
(2022), and their case studies demonstrated how to
develop more effective educational XAI systems by
implementing the framework with four different
educational AI tools. Alamri and Alharbi (2021)
conducted a systematic review in existing work of
explainable models for student grade prediction based
on five research questions covering four main aspects
of the models. Their results indicated the need of
evaluation metrics for comparing the explainability of
142
Chou, T.
Apply an Integrated Responsible AI Framework to Sustain the Assessment of Learning Effectiveness.
DOI: 10.5220/0012058400003470
In Proceedings of the 15th International Conference on Computer Supported Education (CSEDU 2023) - Volume 2, pages 142-149
ISBN: 978-989-758-641-5; ISSN: 2184-5026
Copyright
c
2023 by SCITEPRESS – Science and Technology Publications, Lda. Under CC license (CC BY-NC-ND 4.0)
models, and both accuracy and explainability were
equally important to the prediction of student
performance. As the prediction outcomes of a black-
box model could be interpreted by both global and
local approaches, a number of previous studies in this
area of research have demonstrated how the
predictions can be explained both globally and
locally. For example, Nagy and Molontay (2023)
applied interpretable machine learning (IML) such as
permutation importance (PI), partial dependence plot
(PDP), LIME, and SHAP values to provide
explainability for dropout prediction. The LIME and
SHAP explainable methods were also examined and
validated across various course pairs by Swamy et al.
(2023). In order to construct a teaching support
system based on ML and AI algorithms to predict
student performance and identify whether the
students suffer from a learning difficulty, a
responsible and trusted AI framework shown in
Figure 1 was developed and implemented with three
main modules including explainable artificial
intelligence, safeguard and auditing, and adversarial
training.
Figure 1: The responsible and trusted AI framework.
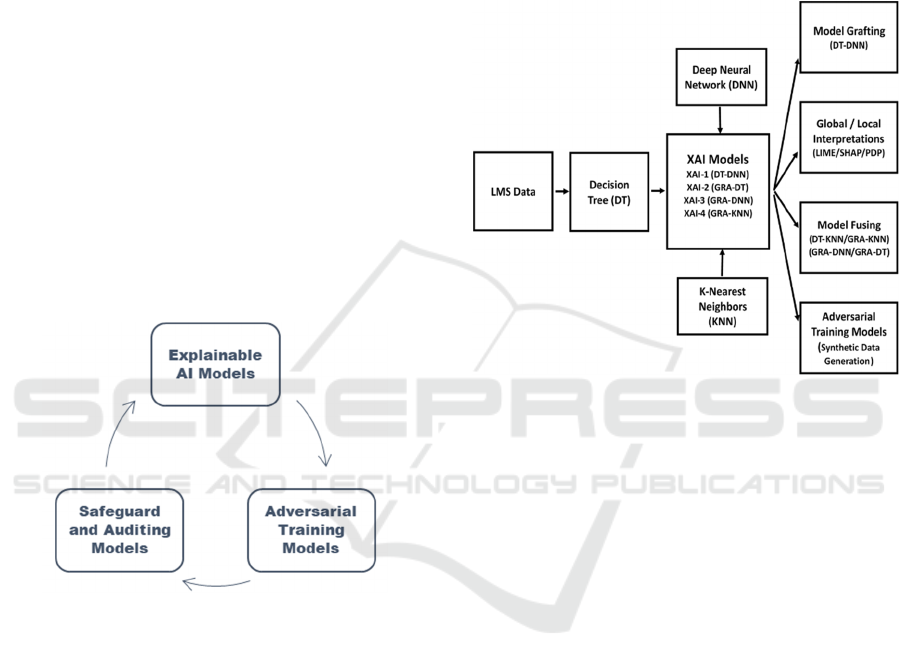
2 RESEARCH FRAMEWORK
As the development of explainable artificial
intelligence has gained much importance in recent
years, this research expanded the previous XAI model
(Chou, 2021) into a responsible and trusted AI
framework that used data collected from an online
learning platform to analyse the impact of students'
learning input on their learning effectiveness. The
innovative framework covers five major stages and its
detailed structure is illustrated in Figure 2. The first
stage of the framework applied decision tree (DT),
deep neural network (DNN), K-nearest neighbour
algorithm (KNN) and grey relational analysis (GRA)
as the global models to predict the learning effect of
students. Although DT, KNN and GRA provided
decision rules, case similarity and variable
importance rankings that humans could easily
understand, their prediction accuracies were still
underperforming if compared to the DNN model.
However, the network structure and weights of a
DNN model were usually regarded as black-box
operations, and the model was difficult to confirm
whether its prediction result was reasonable.
Figure 2: Structure of the research framework.
Therefore, the second stage used a model grafting
technique to concatenate the DT model as a global
model with the DNNs as local models to create an
explainable artificial intelligence (XAI-1) hybrid
model, where the local models were used to improve
the accuracy of prediction for each individual student.
Besides that, the partial dependence plots (PDP),
local interpretable model-agnostic explanations
(LIME) and Shapley values (SHAP) were also used
to provide additional supplementary interpretation for
the deep-learning based DNN model. The dedicated
XAI models might enable users to obtain an optimal
compromise between accuracy and interpretability.
Moreover, another model fusion technique was also
used to integrate the explainable GRA model with the
DT, DNN and KNN models to construct three hybrid
models, which were denoted as XAI-2, XAI-3 and
XAI-4, respectively. In the third stage, both the GRA
and KNN models, or either of them was employed as
three different safeguard models in an auditing
module to provide complementary predictions for
identifying whether students with poor learning
performance were misidentified as normal students
during the processes of the previous stages and
provided early warning to discover at-risk students.
Recent developments in adversarial training have
Apply an Integrated Responsible AI Framework to Sustain the Assessment of Learning Effectiveness
143

increased the need for synthetic data, as the
adversarial training is a technique that attempts to
train models with various deceptive data in AI and
machine learning. Because of this, the synthetic data
were used as adversarial examples to test a machine
learning model and cause the model to make a
mistake in its predictions. By emulating the technique
in a different way, the adversarial training models
developed at the fourth stage intended to apply
various AI generated synthetic data to train the
proposed machine learning models, and their
performance were evaluated with an attempt to search
for any possible competent models that performed
better. To be specific, the synthetic data were used as
adversarial examples for training the proposed XAI
models, and seeking for the chance to improve them
based on the comparison of their performance with
the original models trained with the real data. Both
the CTGAN (Xu et al., 2019) and Synthpop (Nowok
et al., 2016) methods were applied to generate
synthetic data for training the XAI models and
searching the optimal models. Essentially, the
proposed XAI models attempted to use these
generated synthetic data to explore the limitation of
their predictive ability.
During the last stage of the system development,
the entire framework was implemented by using
Microsoft Power BI tools to develop visualized and
interactive dashboards to deliver effective analysis
and decision-making information for the performance
evaluation of each individual student. As a matter of
fact, the interactive interface made it easier to provide
explainable reasons acquired from the global and
local models for the performance evaluation of
students. The methodologies used in this study are
briefly described in the following sections.
2.1 Model Grafting and Model Fusion
To optimize the trade-off between accuracy and
interpretability in machine learning, a practical model
grafting method developed in previous work (Chou,
2021) was applied in this study to combine the DT
model with several DNN models, and the resulting
model is denoted as the XAI-1 model. The DT model
was assigned as a global model due to its explainable
ability, while the DNN models were chosen as local
models to increase the accuracy. The DT global
model mainly provided interpretable rules and
variable importance, while local models were
designed to improve forecast accuracy or provide
other additional explanatory information.
Normally, the DT, KNN, GRA models could be
referred as interpretable models. In contrast to the DT
model, the KNN and GRA models were employed as
a counterpart to examine whether the non-tree-based
models could improve the system performance or
interpretability. Both models were capable of
working as either a global or local model to increase
the transparency and interpretability rather than
accuracy by seeking students with the similar risk of
failing a course. However, as the accuracy of a model
increased, the model became more complexity in
exchange for the cost of interpretability. On the other
hand, as both the GRA and KNN models could
supplement human decisions by identifying
meaningful case similarity from data and support
explain ability in the decision-making process. Both
models were used for model fusion to provide
synergy of models. The model fusion was performed
by extracting the top-500 similarity rankings from the
training cases based on the degree of grey incidence
in GRA model for training with the DT, DNN and
KNN models to construct three hybrid models, which
were denoted as XAI-2, XAI-3 and XAI-4 models,
respectively.
2.2 Models Explanation Methods
As the DNN models applied a black-box deep
learning algorithm, the model could be further
interpreted by the model explanation methods such as
partial dependence plots (PDP), local interpretable
model-agnostic explanations (LIME) and Shapley
values (SHAP) to increase its interpretability. In
addition, both the KNN, GRA models could also be
directly used to replace the DNN model during model
grafting to increase the interpretability. In general, the
PDP method (Berk & Bleich, 2013) changed the
value of a certain explanatory variable one by one
while controlling other variables and interprets the
relationship between the explanatory variable and the
target variable by a line graph. Comparatively, the
SHAP method applies the Shapley value to explain
the importance of feature variables. The LIME
method needed a small number of regional samples to
construct a simple local model as a proxy model to
interpret the original black-box model (Ribeiro et al.,
2016). Since the LIME algorithm was model-
agnostic, the global model could employ any machine
learning or deep learning model, while the local
model simply applied a regularized regression to fit
the target values predicted by the original global
model.
The fundamental idea for the grey relational
analysis was to measure the closeness of two data
sequences based on the similarity and nearness level
of the geometrical curves formed by the sequences.
CSEDU 2023 - 15th International Conference on Computer Supported Education
144

Therefore, the relational degree was calculated by
comparing the geometrical similarity between two
corresponding sequences. In grey relational analysis,
the more similar in the geometrical shape of
compared curves meant the higher grey relational
degree for the sequences. The GRA approach
transformed the data sequence into normalized
sequence in order to generate the so-called grey
sequence, and all values in the sequence originally
measured on different scales were required to be
converted to a common scale. After that, both the grey
relational coefficient and the degree of grey relation
were calculated for an individual element within the
data sequence and the entire sequence, respectively.
Although previous studies (Liu et al., 2016) in this
area of research reported different methods to
calculate the grey relational coefficient, the results of
these methods could lead to inconsistency in ranking
order and require further synthesis for the outcomes.
The grey relational analysis employed in this study is
categorized as absolute incidence approach because
all the sequences in training data were compared to a
specified target sequence rather than been compared
with each other in the relative incidence approach.
2.3 Safeguard and Auditing Models
Since the type I and II errors of a predictive model
caused the students with poor learning outcomes
being misjudged as normal, the students at risk of
failing a course could therefore lost the chance to
participate after-school tutoring or remedial teaching
provided by the school. Based on the artificial
intelligence and machine learning, a safeguard and
auditing mechanism could find out those students
with learning difficulties through the process of
evaluating learning effectiveness and provide after-
school tutoring and remedial teaching opportunities
in a timely manner. In this study, the students
achieved good to excellent performance and received
a final score above 80% were classified as “Good”.
On the other hand, the students demonstrated
generally weak to satisfactory performance and
received a final score between 60% and 80% were
classified as “Average”. If the students received a
final score below 60%, they were regarded as
unacceptable performance and classified as “Bad”.
Despite the fact that students achieved marginal
performance and were at higher risk of academic
failure, they could be incorrectly predicted as
“Average”. Accordingly, both GRA and KNN
models were used to establish a safeguards module.
The empirical results indicated that these models
found 8 out of 10 cases in which students with “Bad”
learning performance were misjudged as “Average”.
As a result, the early warning mechanism should be
enabled, and both the remedial program and after-
school tutoring should also be provided to those
students. On the contrary, there were 10 students
whose actual rating was “Average” and accompanied
by another student’s actual rating was “Good” in the
confusion matrix. This meant that a total of 11
students were incorrectly predicted as “Bad” and
enlisted in an early warning program. However, it
will not lead to the deterioration of students' learning
effect because their final grade could still benefit
from the additional after-school tutoring.
2.4 Adversarial Training Models
The synthetic data is an important component in AI
and also plays a key role in educational data mining,
because it can help to solve the privacy and
confidentiality issues and apply to specific conditions
and needs where real data does not exist or are hard
to obtain. For that reason, the cost of developing and
testing an educational data mining or learning
analytics model can be reduced. Although synthetic
data is not real data, it has the same statistical
characteristics as the real data, and will not be
affected by data protection regulations promulgated
by different countries. Since the data quality is a
major concern for training a machine learning model,
the synthetic data containing the binary, numerical,
categorical data can capture the basic structure and
statistical distribution as the real data while maintain
the full range of data diversity. In addition to
protecting the privacy and confidentiality of data, the
synthetic data can also be used in the training and
testing of machine learning systems, such as fraud
detection systems or adversarial training models. The
underlying concept of the adversarial training is to
train models with various deceptive data in machine
learning tasks. Basically, the synthetic data can be
used as adversarial examples to intrude a machine
learning model and cause the model to make a
mistake in its predictions. Therefore, the adversarial
training models in this study intended to apply
various AI generated synthetic data to train the
proposed machine learning models, and evaluated
their performance with an attempt to search for any
possible competent models that perform better.
Unlike the deceptive data used for adversarial
training, the synthetic data was applied as adversarial
examples to train the proposed XAI models, and
seeking for the chance to improve model performance
by comparing with the original models using real
data. Both the CTGAN and Synthpop methods were
Apply an Integrated Responsible AI Framework to Sustain the Assessment of Learning Effectiveness
145

used to generate adversarial examples for training the
XAI models rather than deceiving them. In fact, the
XAI models attempted to use these synthetic data to
explore the limitation of their predictive ability. As
the student data collected from the online learning
platform was organized in a table with various
variables, therefore, the tabular synthetic data was
generated to carry out adversarial training to test and
compare the impacts on the proposed models under
diversified data. Through training with a large
amount of synthetic data, it was possible to assess the
relationship between the students' learning input and
their corresponding learning effectiveness. More
importantly, the adversarial training allowed us to
understand whether the synthetic data could improve
the generalization ability of the models.
The Synthpop (CART) model generated three
times and five times the number of training samples
for the adversarial training with the DT global model
were denoted as ATM-1 and ATM-2 models,
respectively. Similarly, the CTGAN model was
configured to generate the same amount of training
samples as the Synthpop model for training with the
DT model and denoted as ATM-3, ATM-4 models.
As the training samples might contain imbalanced
data in student rating where the number of students
being rated as ‘Good’ had a much larger percentage
than the minor ‘Bad’, the majority class was
decreased to closely match the size of the minority
class. The downsampled dataset was used to train the
DT model again and denoted as the ATM-5 model.
3 EXPERIMENT RESULTS
The experimental data collected from the LMS
system contained 1040 anonymized students across
different study-level regarding their online activities
and academic performances. The experimental results
for the three stages were summarized in the following
sections.
3.1 The Experimental Results of XAI
and ML Models
In the first stage, the DT, DNN, GRA and KNN
models were employed as a single individual model
to predict the risk of student failure. The DNN model
was constructed with five different layers, including
a fully connected last layer, and the dropout layers
with a cutoff value of 0.1 were used to reduce the
overfitting problem. The activation functions such as
Sigmoid, Tanh and ReLU were assessed in different
hidden layers and another Softmax function was used
in the last fully connected layer. The DT model was
pruned according to the best complexity parameter
(CP), which controlled the number of splits in a
decision tree by examining the misclassification error
for each branch and was evaluated between 0.01 and
0.001. This study also implemented various XAI
models that could enable users to obtain an optimal
trade-off between the accuracy and interpretability. In
addition to create an XAI-1 model using model
grafting to concatenate DT model with DNN models,
the explainable GRA model was also fused with the
DT, DNN and KNN models to construct the XAI-2,
XAI-3 and XAI-4 hybrid models.
Although DT, GRA and KNN models were able
to provide the transparency and interpretability for
users to better understand the analysed results, their
prediction accuracies were unsatisfactory. Table 1
indicates that the deep-learning based DNN model
achieved the highest accuracy of 0.814. However, the
DNN model was regarded as a black box operation
due to its network architecture and weights. Table 1
also shows that all XAI models, except for XAI-3,
reported the predictive accuracy over 0.770.
Applying XAI models to predict student performance
could improve the interpretation while maintain the
performance of the prediction. For example, the XAI-
1 model integrating the DT and DNN models
achieved the highest accuracy at 0.785 among all XAI
models. Despite the accuracy being inferior to the
DNN model, the outperformance of XAI-1 over the
other models was also noticeable because it provided
explainable decision rules and variable importance
for users. On the other hand, the XAI-3 model gave
worse accuracy than any other XAI models, even
though it combined the explainable GRA model with
the more accurate DNN model. Interestingly, the
XAI-2 and XAI-4 models that GRA integrated with
DT and KNN models respectively were shown to
have the similar accuracies.
Table 1: Prediction result of XAI and ML models.
Models Accuracy Kappa
DT 0.734 0.536
GRA 0.740 0.538
KNN 0.772 0.596
DNN 0.814 0.676
XAI-1 (DT-DNN ) 0.785 0.630
XAI-2 (GRA-DT) 0.772 0.611
XAI-3 (GRA-DNN) 0.734 0.520
XAI-4 (GRA-KNN) 0.779 0.615
Since the GRA model was applied as the primary
model to filter the training samples with a higher
degree of relational analysis in model fusion,
different sizes of training samples were evaluated to
CSEDU 2023 - 15th International Conference on Computer Supported Education
146
account for whether the XAI models could improve
their accuracy with more training samples. Hence, the
resulting XAI-2, XAI-3 and XAI-4 models were
evaluated with the top-400 and top-500 similarity
rankings of all training samples. The results, as shown
in Table 2, indicated that the XAI-2 model using the
top-500 ranking data in the model fusion of GRA and
DT gave the best accuracy of 0.772. The XAI-2 also
achieved a better performance than the XAI-3 and
XAI-4 models by using the same amount of training
samples.
Table 2: Prediction result of XAI model fusion.
Sample Size (GRA) Accuracy Kappa
XAI-2 (400) 0.728 0.530
XAI-2 (500) 0.772 0.611
XAI-3 (400) 0.734 0.520
XAI-3 (500) 0.721 0.499
XAI-4 (400) 0.708 0.497
XAI-4 (500) 0.740 0.550
Figure 3: Analysis results of XAI-1 and LIME models.
In addition to the decision rule generated for the
XAI-1 model, the model could also be interpreted by
the explanation methods such as PDP, LIME and
SHAP to increase its interpretability. The importance
ranking of variables calculated for each of the three
performance ratings, including Bad, Average, Good,
and their corresponding positive or negative effects,
were shown in the bottom of Figure 3. The Final
Exam, Second Exam, Material File Downloading,
Course Completion and Rollcall were the top-5
important learning activities that affect the student
being classified as “Average” by the LIME
explanation method.
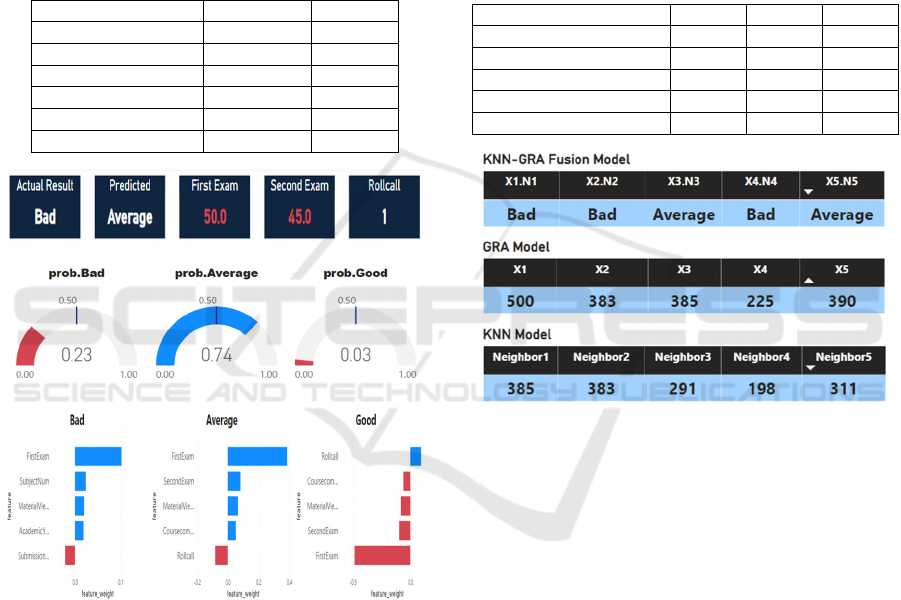
3.2 The Experimental Results of
Safeguard Models
In order to discover the students with poor learning
performance being misidentified as normal in the first
stage, the safeguard models performed an audit
mechanism to search for the misjudged students and
support early warning.
Table 3: Prediction result of safeguard models.
Models Bad Average Good
Safeguard (KNN - GRA) 0.825 0.175 0
Safeguard (KNN) 0.600 0.400 0
Safeguard (GRA) 0.820 0.180 0
DT 0.232 0.737 0.032
DNN 0.4673 0.516 0.0174
Figure 4: Top-5 similarity cases of safeguard models.
As shown in Table 3, the DT and DNN models
predicted that the rating of a student was “Average”
with a probability of 0.737 and 0.516, respectively. In
fact, the student's actual rating is “Bad”, and all the
three safeguard models, including KNN-GRA, KNN
and GRA, predicted that student’s rating was “Bad”
with the probability of 0.825, 0.600 and 0.820,
respectively. Although both the DT and DNN models
failed to recognize the actual rating, the safeguard
models found that the student with “Bad” rating was
misjudged as “Average”, and the early warning
mechanism including both the remedial program and
after-school tutoring should be enabled to assist that
student. The KNN-GRA model shown in Figure 4
also found 3 out of its top-5 nearest neighbours
predicted “Bad” for that student, and all the three
safeguard models suggested that the student was most
likely to demonstrate unsatisfactory performance.
Apply an Integrated Responsible AI Framework to Sustain the Assessment of Learning Effectiveness
147

3.3 The Experimental Results of
Adversarial Training Models
For validation of adversarial training models, both the
Synthpop (CART) and CTGAN models were applied
to generate synthetic data for training the original DT
model. Therefore, totally five different ATM models
were constructed to evaluate whether the synthetic
data could improve the performance the interpretable
DT model. As shown in Table 4, the empirical results
showed that the Synthpop (CART) based ATM-1 and
ATM-2 models trained with three-fold and five-fold
synthetic data outperformed the CTGAN based ATM
models. The accuracy and kappa values of ATM-1
were found at 0.756 and 0.578, respectively, while the
ATM-2 achieved similar results. The McNemar’s test
results using the ATM-1 and ATM-3 in Table 5 also
confirmed that the accuracy of Synthpop based ATM
model was statistically higher than that of CTGAN
based ATM models (p = 6.98E-08).
By comparison with the Synthpop based models
that generated three times and five times the number
of synthetic data for the adversarial training with the
ATM-1 and ATM-2 models, the CTGAN model were
configured with three different network architectures
including various combinations of the fully connected
layer, batch normalization, Leaky ReLU, dropout
layer to generate the same amount of synthetic data
for training ATM-3 and ATM-4 models. Another
downsampled synthetic dataset was also created to
train the ATM-5 model. The impact of the
aforementioned synthetic data for the adversarial
training was summarized in Table 4.
Table 4: Prediction result of ATM Models.
ATM Models Accuracy Kappa
ATM-1 0.756 0.578
ATM-2 0.750 0.565
ATM-3 0.715 0.502
ATM-4 0.644 0.423
ATM-5 0. 647 0.470
Since the Synthpop model applied the CART
decision tree algorithm to generate synthetic data, no
matter it generated three times or five times the
number of synthetic data, their prediction
performance surpassed 0.75 accuracy. However, even
though the CTGAN used three different amounts of
synthetic data for ATM-3, ATM-4 and ATM-5, the
highest model accuracy was 0.715, while the highest
accuracy of Synthpop was 0.756. Despite the
CTGAN based ATM models performing lower
accuracy, they could still generate a large amount of
diverse synthetic data to explore whether the models
were overfitting or underfitting.
3.4 Statistical Comparison of Models
In the previous section, the experimental results were
evaluated with accuracy, kappa metrics in comparing
the performance of models. To evaluate if the
performance of the one model was significantly better
than that of the other model, several statistical
comparison of models based on accuracy, kappa,
macro-averaged sensitivity and specificity metrics
were conducted to provide information on the
certainty of the differences between the models.
Table 5: Results of McNemar test.
Model Comparison Statistic p-value
XAI-3 vs XAI-4 0.52174 0.47010
XAI-2 vs XAI-3 0.01020 0.91954
XAI-2 vs XAI-4 0.63366 0.42601
XAI-4 vs ATM-1 0.25510 0.61351
ATM-3 vs ATM-1 29.0703 6.98E-08
With the intention of comparing the predictive
accuracy of the XAI and ATM models, the
McNemar's test for pairwise model comparison with
a significance level of α=0.05 was conducted to
determine whether the use of these ATM models
improved the accuracy of the XAI models. As shown
in Table 5, the McNemar test rejected the null-
hypothesis that the performance of both the ATM-3
and ATM-1 models was equal, as the p-value was
lower than the chosen significance level. The
remaining contrasts for other models were not
significant (p > 0:05).
On the other hand, Friedman's test and the post-
hoc statistical analyses were also employed for model
comparisons based on the classification metrics,
including accuracy, kappa, macro-averaged
sensitivity and specificity. Since the statistic value for
Friedman's test was 84.27 and the corresponding p-
value was 5.88E-06, the result rejected the null
hypothesis and indicated significant differences
among the compared models, with a p-value < 0.05.
Therefore, the Nemenyi post-hoc test was required
for all models to compare with each other. In addition,
both the Bonferroni–Dunn and Holm tests were also
carried out to identify significant differences among
a control DNN approach and the other models.
According to the Nemenyi post-hoc test where all
models were compared to each other, the DNN model
differed significantly (p < 0.05) compared to DT and
GRA models in Table 6, and the XAI-3 also differed
CSEDU 2023 - 15th International Conference on Computer Supported Education
148

significantly (p < 0.05) to DNN and XAI-1 models.
Other contrasts were not significant.
Table 6: Results of Nemenyi test.
Comparison Statistic Adj. p-value
XAI-3 vs DNN 4.06663 0.00172
XAI-1 vs XAI-3 3.55023 0.01386
DNN vs DT 3.48569 0.01767
DNN vs GRA 3.29204 0.03581
To test whether the performance of the black-box
DNN model was better than that of the other models,
the adjust p-values from both the Bonferroni and
Holm corrections were applied to compare all models
based on using the DNN model as a control model.
As shown in Table 7, the post hoc tests indicated that
the DNN model produced a significantly concrete
differences (p<0.01) to XAI-3, DT and GRA models,
and no evidences were found that DNN model
performed better than the remaining models.
Table 7: Results of Bonferroni-Dunn and Holm tests.
Approach Bonf.
Adj. p-value
Holm
Adj. p-value
DNN vs XAI-3 0.00038 0.00038
DNN vs DT 0.00393 0.00344
DNN vs GRA 0.00796 0.00597
DNN vs ATM-1 0.11337 0.07086
DNN vs KNN 0.26528 0.13264
DNN vs XAI-2 1.00000 0.52573
DNN vs XAI-4 1.00000 0.52573
DNN vs XAI-1 1.00000 0.60558
4 CONCLUSIONS
This study established an innovative responsible and
trusted AI framework to analyse and predict the
learning effectiveness of students based on their
online learning activities. Various explainable
artificial intelligence (XAI) models were developed
to provide interpretable and explainable information,
such as decision rules, variable importance rankings
and case similarity for the evaluation of student
learning performance. The XAI models achieved an
overall accuracy between 0.734 and 0.785 in
predicting learning rating for students. Another three
safeguard and auditing models were built to
complement the XAI models for retrieving the at-risk
students being misidentified as normal and providing
them the after-school tutoring or remedial teaching.
The adversarial training models applied AI generated
synthetic data to train the proposed models and
explored any possible improvement for the original
models by using the diversified synthetic data. The
experimental results implied that the diversified
synthetic data was unable to increase the accuracy of
models, and led us to a deeper understanding of how
the real data and synthetic data differed in exploring
the performance limitation of models. The framework
was finally implemented by the Microsoft Power BI
tools to create various visualized and interactive
dashboards to demonstrate and deliver effective
analysis.
REFERENCES
Berk, R., Bleich, J. (2013). Statistical procedures for
forecasting criminal behavior: A comparative
assessment. Criminology and Public Policy, 12(3), 513-
544.
Chou, T. (2021). Apply explainable AI to sustain the
assessment of learning effectiveness. In IMCIC 2021,
12th International Multi-Conference on Complexity,
Informatics and Cybernetics, Proceedings, (2), 113-
118.
Xu, L., Skoularidou, M., Cuesta-Infante, A.,
Veeramachaneni, K. (2019). Modeling tabular data
using conditional GAN. In NeurIPS, 7333-7343.
Liu, S., Yang, Y., Xie, N., Forrest, J. (2016). New progress
of Grey System Theory in the new millennium. Grey
Systems: Theory and Applications, 6 (1), 2–31.
Nowok, B., Raab, G., Dibben, C. (2016). synthpop:
Bespoke creation of synthetic data in R. Journal of
Statistical Software, 74(11), 1-26.
Ribeiro, M. T., Singh, S., Guestrin, C. (2016). Why should
i trust you? Explaining the predictions of any classifier.
In Proceedings of the 22nd ACM SIGKDD
International Conference on Knowledge Discovery and
Data Mining, 1135-1144.
Khosravi, H., Shum, S.B., Chen, G., Conati, C., Gasevic,
D., Kay, J., Knight, S., Martinez-Maldonado, R., Sadiq,
S., Tsai, Y.S. (2022). Explainable Artificial Intelligence
in education. Computers and Education: Artificial
Intelligence, 3, 100074.
Alamri, R., Alharbi, B. (2021). Explainable Student
Performance Prediction Models: A Systematic Review.
IEEE Access, 9, 33132-33143.
Nagy, M., Molontay, R. (2023). Interpretable Dropout
Prediction: Towards XAI-Based Personalized
Intervention. International Journal of Artificial
Intelligence in Education, Springer Nature.
Swamy, V., Du, S., Marras, M., Käser, K. (2023). Trusting
the Explainers: Teacher Validation of Explainable
Artificial Intelligence for Course Design. In LAK2023:
13th International Learning Analytics and Knowledge
Conference.
Apply an Integrated Responsible AI Framework to Sustain the Assessment of Learning Effectiveness
149
