
International Economic Integration from the Perspective of Economic
Complexity and Economic Fitness: A Methodological Proposal
Arturo González
1,2 a
, Sanny González
2b
, Gabriel Pereira
1c
, Gerardo Blanco
2d
and Christian von Lücken
3e
1
Universidad Americana, Facultad de Ciencias Económicas y Administrativas, Lab-iDi, Asunción, Paraguay
2
Universidad Nacional de Asunción, Facultad Politécnica, Grupo de Investigación en Sistemas Energéticos,
San Lorenzo, Paraguay
3
Universidad Nacional de Asunción, Facultad Politécnica, Núcleo de Investigación y Desarrollo Tecnológico,
San Lorenzo, Paraguay
Keywords: International Economic Integration, Economic Complexity, Economic Fitness, Development, Economic
Block.
Abstract: International Economic Integration can be described as a process in which a group of countries seeks mutual
benefits through mechanisms such as the elimination and/or reduction of trade, social, and political barriers
between others. From an economic point of view, the importance of the integration of countries is fundamental
for their development simply because most of them are part of some system of international economic
integration. In this work, the issue of economic integration will not be discussed in depth but instead will
oversee proposing some well-known metrics in the field of economic development that could be very useful
as analysis and decision-making tools. in the process of regional economic integration. In this sense, this work
proposes using concepts and metrics of Economic Complexity and Economic Fitness to identify combined
productive capacities between countries that are part of an economic block, whether real or fictitious. The
problem in understanding how economically integrate the countries is to identify the combined productive
capacities that would exist if two or more countries that make up an economic block are considered as a single
country. Experimental analyzes were carried out for a fictitious case, where a world with 10 countries and 15
products is presented; in addition, 3 economic blocks were defined, which were analyzed applying economic
complexity and economic fitness metrics. The results obtained reflect the great importance of economic
integration since, by establishing economic blocks, it is possible to capture more productive capacities by
improving both the diversity of the economic block and the ubiquity of the products produced in it by
addressing the productive capacities of the member countries.
1 INTRODUCTION
As time progresses, it is evident that societies are
heading towards a global integration that has been
exponentially accelerated thanks to the advancement
of technology. From an economic point of view, the
importance of the integration of countries is
fundamental for their development, and this is simply
because, except for a few cases, countries are part of
some system of international economic integration
a
https://orcid.org/0000-0001-5672-3679
b
https://orcid.org/0000-0002-8385-2852
c
https://orcid.org/0000-0001-9966-6715
d
https://orcid.org/0000-0001-9773-8922
e
https://orcid.org/0000-0002-2198-1237
(whether regional or international) without discussing
the degree of effectiveness or usefulness of these
(Pérez Bustamante., 2012).
International Economic Integration can be
described as a process (which can be very diverse in
its methods) through which a group of countries seeks
mutual benefits through mechanisms such as the
elimination and/or reduction of trade, social, and
political barriers between others. In this way, two or
more national markets, previously separate and of
different dimensions, come together to form a unified
González, A., González, S., Pereira, G., Blanco, G. and von Lücken, C.
International Economic Integration from the Perspective of Economic Complexity and Economic Fitness: A Methodological Proposal.
DOI: 10.5220/0012059400003485
In Proceedings of the 8th International Conference on Complexity, Future Information Systems and Risk (COMPLEXIS 2023), pages 109-121
ISBN: 978-989-758-644-6; ISSN: 2184-5034
Copyright
c
2023 by SCITEPRESS – Science and Technology Publications, Lda. Under CC license (CC BY-NC-ND 4.0)
109

economic space in such a way as to reduce
disadvantages and/or difficulties existing in separate
countries (Pérez Bustamante., 2012).
Achieving International Economic Integration is
complex since it depends on many factors and
variables (Economic, Geopolitical, Social, among
others.). Although there are cases of quite successful
economic integration blocks (European Union, and
others in South America), there are still difficulties to
overcome to get countries to embark on this process.
In this work, the issue of economic integration will
not be discussed in depth but only when immediately
relevant, proposing the use of some well-known
metrics in the field of economic development as
analysis and decision-making tools for regional
economic integration processes.
In this sense, this work proposes the use of
concepts and metrics of Economic Complexity
(Hidalgo & Haussman., 2009) and Economic Fitness
(Tacchella et al., 2012) to identify combined
productive capacities between countries that are part
of an economic bloc, whether real or fictitious, and
thus be able to measure the global performance of the
economic blocks worldwide as if it were a country.
To achieve the goals mentioned above, it is
important to be able to answer the following
questions: Is it possible to use complex systems to
analyze cases of international economic integration?
Are the methods based on complex systems adequate
to analyze cases of regional integration? Is it possible
to quantify the productive capacities of economic
blocks and not only of countries? And finally, is it
possible to propose a method of quantifying the
productive capacities of the economic blocks?
In this article, you can find a well-detailed
methodological proposal to address the problem of
International Economic Integration, for which the
proposal is systematically detailed, and a fictitious
practice case is presented for the experimental
application of the models.
The article is presented as follows: Section 2
presents a literature review of the studied areas;
Section 3 presents the Methodology proposed and
applied in this work; in Section 4, the Results and
Discussions are shown and finally, in Section 5, the
Conclusions.
2 LITERATURE REVIEW
2.1 Economic Complexity
The economic complexity is related to the ubiquity
and diversity of the accumulated knowledge in a
determined economy. Then, in a specific country, as
more people from different sectors interact,
combining their knowledge to produce diverse
products, a more complex economy could be
expected. Therefore, the economic complexity of a
country can be expressed as the share of productive
knowledge it accumulates, because of using and
combining that knowledge (Hausmann et al., 2011).
Knowledge can only be accumulated, transferred,
and preserved if inserted in a people´s network or in
organizations that apply that knowledge for
productive purposes. If producing a product requires
a specific type or combination of knowledge, then the
countries that produce that product reveal that they
have the capabilities and required knowledge to
produce it (Hidalgo & Haussman., 2009; Hausmann
et al., 2011).
The economic complexity of a country reflects the
amount of productive knowledge of its economy,
measured using 2 main indicators, the diversity, and
the ubiquity.
Diversity relates to the number of products produced
in a specific country, while ubiquity refers to the
number of countries that produce a specific product.
𝐷𝑖𝑣𝑒𝑟𝑠𝑖𝑡𝑦=𝐾𝑐,0=
∑
𝑀𝑐𝑝
(1)
𝑈𝑏𝑖𝑞𝑢𝑖𝑡𝑦=𝐾𝑝,0=
∑
𝑀𝑐𝑝
(2)
To generate a more accurate measure of the
number of available capabilities of a country or the
required capabilities for a product, it is necessary to
correct the information that the diversity and ubiquity
hold, using each of them to correct the other and vice
versa. As proposed by (Hidalgo & Haussman.,
(2009); Hausmann et al., (2011)), this can be
expressed as the following equations:
𝑀
´
=
∑
´
,
,
(3)
Therefore, the Economic Complexity Index (ICE)
is defined as follows (Hidalgo & Haussman., (2009);
Hausmann et al., (2011)):
𝐸𝐶𝐼=
⃗
⃗
(
⃗
)
(4)
Where, <𝐾
⃗
> is an average, stdev() represents the
standard deviation, and 𝐾
⃗
is the eigenvector of 𝑀
´
associated with the second largest eigenvalue.
Analogously, the Product Complexity Index
(PCI) is defined.
𝐼𝐶𝑃=
⃗
⃗
⃗
(5)
Where, 𝑄
⃗
is the eigenvector of 𝑀
´
associated to
the second largest eigenvalue.
COMPLEXIS 2023 - 8th International Conference on Complexity, Future Information Systems and Risk
110

[Experimental Data Box]
All the data and results can be found at: https://bit.ly/complexis23_Data
Table 1: Product Export Matrix - Test Model for Experimental Analysis (X
cp
).
Table 2: Experimental Process to obtain the Export Matrix that contains an International Economic Block (X
cp
to X
mp
) -
Example of Ec. Block. #1.
𝐶´=
{
𝑐
,𝑐
,𝑐
,𝑐
}
(a) Conformation of the International Economic Bloc #1
(b) The Export matrix of the Economic Block #1 (𝑬𝑩
𝒌𝒑
) is built
(c) Calculation of Vector "B", using the (9, of total export values of the International Economic Block #1
(e) Vector "B" replaces all the countries that make up the International Economic Block #1 and the export matrix that
contains it is formed. As a result, the Matrix (X
mp
) is obtained.
(a) M
cp
from the Original Export Matrix
(b) M
cp
of the Export Matrix that contains the International
Economic Bloc
k
#1
(c) M
cp
of the Export Matrix that contains the International
Economic Bloc
k
#1
(d) M
cp
of the Export Matrix that contains the International
Economic Bloc
k
#1
Figure 1: M
cp
Matrices of the (a) Original Export Matrix (X
cp
) and of the (b, c & d) Export Matrices of the Economic Blocks
(X
mp
) Proposed for this study calculated with the Eq. 7.
X
cp
p
1
p
2
p
3
p
4
p
5
p
6
p
7
p
8
p
9
p
10
p
11
p
12
p
13
p
14
p
15
c
1
0 42.627 0 0 0 0 0 0 0 0 0 7.095 0 0 0
c
2
28.350 277.775 1.674 371.691 46.857 3.034.718 26.355.142 0 1.515.962 0 14.802 42.371.264 6.284.352 1.372.309.632 1.201.978
c
3
0 5.216 0 9.158 0 156.295 86.464 24.779 5.648.211 16.256.469 304.646 10.071 619.167 0 0
c
4
26.227 40.294 0 4.780 0 12.626.318 4.678 6.920 3.306.102 65.784.052 31.552 444.469.600 362.779 33.522 8.441
c
5
430.025.280 102.318.904 6.954.244 58.085.384 234.929 233.119.760 137.473.696 84.333.632 90.806.104 0 29.043.196 5.741.459.456 369.889.600 185.851.248 9.093.049
c
6
6.400.370 11.242.664 6.264 3.643.282 725.795 4.410.605 307.132 0 4.157.532 0 2.731 7.407.275 10.967 5.067.202 17.794
c
7
6.871.145 6.349.536 0 15.359.048 0 96.720.000 10.334.506 332.191 25.312.052 0 503.529 182.173.968 11.194.842 116.190.032 274.509
c
8
0 0 0 29.464.208 17.703.662 16.929 0 810.382 24.814.384 42.568.613.888 12.799.707 12.226.431 3.497 1.548.972 2.750
c
9
518.443.552 95.476.752 29.089.984 11.991.583 17.625.200 456.977.600 81.602.312 289.626.240 8.044.192.768 27.847.991.296 27.986.572 21.523.519.488 496.113.344 124.086.304 194.398.960
c
10
25.424.708 2.667.031 76.896 1.779.958 0 18.301.440 16.807.418 4.748.828 403.493.536 638.850.560 640.625 297.708.000 1.121.468 39.320.432 822.995
EB
kp
p
1
p
2
p
3
p
4
p
5
p
6
p
7
p
8
p
9
p
10
p
11
p
12
p
13
p
14
p
15
c
1
0 42.627 0 0 0 0 0 0 0 0 0 7.095 0 0 0
c
2
28.350 277.775 1.674 371.691 46.857 3.034.718 26.355.142 0 1.515.962 0 14.802 42.371.264 6.284.352 1.372.309.632 1.201.978
c
3
0 5.216 0 9.158 0 156.295 86.464 24.779 5.648.211 16.256.469 304.646 10.071 619.167 0 0
c
5
430.025.280 102.318.904 6.954.244 58.085.384 234.929 233.119.760 137.473.696 84.333.632 90.806.104 0 29.043.196 5.741.459.456 369.889.600 185.851.248 9.093.049
p
1
p
2
p
3
p
4
p
5
p
6
p
7
p
8
p
9
p
10
p
11
p
12
p
13
p
14
p
15
B =
430.053.630 102.644.522 6.955.918 58.466.23
3
281.786 236.310.77
3
163.915.302 84.358.411 97. 970.27
7
16.256.46
9
29.362.64
4
5.783.847.886 376.793.11
9
1.558.160.880 10.295.02
7
X
m
p
p
1
p
2
p
3
p
4
p
5
p
6
p
7
p
8
p
9
p
10
p
11
p
12
p
13
p
14
p
15
B
430.053.630 102.644.522 6.955.918 58.466.233 281.786 236.310.773 163.915.302 84.358.411 97.970.277 16.256.469 29.362.644 5.783.847.886 376.793.119 1.558.160.880 10.295.027
c
4
26.227 40.294 0 4.780 0 12.626.318 4.678 6.920 3.306.102 65.784.052 31.552 444.469.600 362.779 33.522 8.441
c
6
6.400.370 11.242.664 6.264 3.643.282 725.795 4.410.605 307.132 0 4.157.532 0 2.731 7.407.275 10.967 5.067.202 17.794
c
7
6.871.145 6.349.536 0 15.359.048 0 96.720.000 10.334.506 332.191 25.312.052 0 503.529 182.173.968 11.194.842 116.190.032 274.509
c
8
0 0 0 29.464.208 17.703.662 16.929 0 810.382 24.814.384 42.568.613.888 12.799.707 12.226.431 3.497 1.548.972 2.750
c
9
518.443.552 95.476.752 29.089.984 11.991.583 17.625.200 456.977.600 81.602.312 289.626.240 8.044.192.768 27.847.991.296 27.986.572 21.523.519.488 496.113.344 124.086.304 194.398.960
c
10
25.424.708 2.667.031 76.896 1.779.958 0 18.301.440 16.807.418 4.748.828 403.493.536 638.850.560 640.625 297.708.000 1.121.468 39.320.432 822.995
International Economic Integration from the Perspective of Economic Complexity and Economic Fitness: A Methodological Proposal
111

It is necessary to consider the Revealed
Comparative Advantage to establish the M
cp
Matrix,
which allows the calculations of the Economic
Fitness. The definition of Revealed Comparative
Advantage (RCA) proposed by Balassa (1965) makes
countries and products comparable since it represents
the exports of products by country. This index
establishes that a country has revealed a comparative
advantage in a product if it exports more than the rest
of the world, in which case the RCA index adopts a
value equal to or greater than one; if it is less than one,
it indicates the opposite. It is formally defined as:
𝑅𝐶𝐴
=
X
X
X
X
(6)
Where:
X
=Exports o
f
the countr
y
"c" o
f
the product "p".
X
=Total Exports of the country "c".
X
=Total World Exports o
f
the product "p".
X
=Total World Exports o
f
the year (All Products).
This measure makes it possible to build a matrix
that connects each country with the products it
manufactures. The entries in the matrix are 1 if the
export of the product in each country with Revealed
Comparative Advantage is greater than or equal to 1,
and 0 otherwise. We formally define this as the M
cp
matrix as (Hidalgo & Haussman., (2009); Hausmann
et al., (2011)):
𝑀
=
1, i
f
RCA
≥1
0, otherwise
(7)
2.2 Economic Fitness
The Economic Fitness theory proposes a new
algorithm that shows an iterative and non-linear
approach, which makes it possible to efficiently
capture the link formed between the export basket of
different countries and their industrial
competitiveness (Tacchella et al., 2012; Cristelli et
al., 2013; Tacchella et al., 2013). This model has its
initial basis in the construction of a binary matrix of
countries and products (Mcp), which represents the
export basket of each country, whose elements are 1
if country "c" exports product "p" with revealed
comparative advantage and 0 otherwise (See Eq. 7).
This method consists of coupled non-linear maps and
new information is added in each iteration.
Therefore, the general idea of the algorithm
proposed in the Economic Fitness theory lies in
defining an iteration process for the Fitness of the
countries (F
c
) with the complexity of the products
(Q
p
) and then obtaining the values of the
convergence. In the case of F
c
, it is appropriate to be
proportional to the sum of the exported products
weighted by their complexity Q
p
.
For the case of Q
p
it becomes less intuitive
because, in a first approximation, the complexity of a
product is inversely proportional to the number of
countries that export it. However, in each iteration,
more information is added, considering that if a
country has a high level of Fitness, the weight is
reduced to limit the complexity of a product. On the
other hand, countries with low Fitness contribute
more and tend to limit the complexity of the products
(Tacchella et al., 2012; Cristelli et al., 2013;
Tacchella et al., 2013; Pugliese, Zaccaria &
Pietronero., 2016). These ideas are summarized in the
iteration of the following equations:
⎩
⎪
⎨
⎪
⎧
F
()
=M
Q
()
Q
()
=
1
∑
M
1
F
()
→
⎩
⎪
⎨
⎪
⎧
F
()
=
F
()
〈
F
()
〉
Q
()
=
Q
()
〈
Q
()
〉
(8)
Where:
n=Index of iteration.
c=Total number of countries.
p=Total number of products.
F
=Fitness of the country "c".
Q
=Product Complexity "p".
M
=Product − Country Logical Matrix.
𝑂𝑏𝑠.: F
and Q
corresponding to the
normalization
Since this theory proposes that less complex
exporters make a dominant contribution to product
complexity, non-linearity is a fundamental Mathema-
tical property that is unavoidable given the problem of
economic diversification (Cristelli et al., 2013). For the
definition of the complexity of the products, the sum in
the denominator is strongly dominated by the countries
with a lower Fitness measure. Another issue that must
be considered when considering the product
complexity denominator is that, as the total number of
countries that export that specific product increases,
this means that the complexity of the products
decreases, considering thus the product's ubiquity.
2.3 Economic Complexity and
Economic Fitness
The application of the Economic Complexity metrics
has had a great impact from the 2010s onwards
(Hidalgo & Haussman., 2009; Haussman et al.,
2011). It has become a quite popular tool for studying
economic development, economic geography and has
been applied to numerous case studies (Countries,
COMPLEXIS 2023 - 8th International Conference on Complexity, Future Information Systems and Risk
112

cities, etc.) It has also been related to other topics,
such as greenhouse gas emissions, economic growth
and inequality, in addition to extrapolating their
metrics for cases unrelated to the economy or at least
not directly (Hidalgo., 2021).
Although there are multiple applications and
work carried out under the Economic Complexity
approach, there are still many challenges in terms of
research topics, overcoming the issue of the difficulty
of having reliable data in the world and even more
outside of the products (services, patents, and others.),
in addition, several points remain pending, such as
being able to work at subnational or even international
levels (International Economic Blocks). In short, one
of the greatest contributions to the development of
Economic Complexity lies not in the mathematical
model itself, but in the integration of researchers from
areas of knowledge that long ago were on separate
paths (network scientists, economic geographers,
innovation economists, physicists, and others.)
achieving a very interesting interaction between
academics from different areas (Hidalgo., 2021).
Another metric for the analysis of the Economic
Complexity of countries and products is the
Economic Fitness proposed by Tacchella et al.
(2012). In a study carried out by Cristelli et al. (2013)
a comparison was made between both methods. To
deepen the methods and metrics of Economic Fitness,
the following literature is recommended (Tacchella et
al., 2013; Cristelli, Tacchella & Pietronero., 2015;
Mariani et al., 2020; Morrison et al., 2017; Vinci &
Benci., 2018 and Hidalgo., 2021).
2.4 International Economic Integration
International Economic Integration refers to the
process by which countries in a particular region
coordinate their economic policies and remove trade
barriers to increase trade and investment among each
other. In South America, regional economic
integration has been a major objective for many years,
aiming to boost economic growth and reduce poverty
(Carranza, 2017; Basnet & Pradhan, 2017).
One of the key initiatives in South America toward
economic integration is the formation of the Southern
Common Market (MERCOSUR), established in 1991.
MERCOSUR is a customs union that promotes free
trade and the movement of goods, services, and people
among its member countries. MERCOSUR has helped
to reduce trade barriers and increase trade among its
members, resulting in increased economic growth and
improved standards of living for the citizens of its
member countries. (Basnet & Pradhan, 2017; Caceres,
2011).
Despite these positive developments,
MERCOSUR has faced many challenges in its pursuit
of economic integration. One of the main challenges
has been the lack of political will among its members
to fully implement the agreements and remove all
trade barriers. This has resulted in the slow progress
of MERCOSUR and limited its ability to achieve its
goals of boosting economic growth and reducing
poverty. (Baer et al., 2002).
Another challenge facing MERCOSUR is the
lack of coordination among its members on
macroeconomic policies, such as fiscal and monetary
policies. This lack of coordination can lead to
imbalances in trade and investment among its
members and undermine the objectives of economic
integration. To overcome this challenge,
MERCOSUR must establish stronger mechanisms
for policy coordination among its members and
ensure that their policies are aligned with the
objectives of the organization. (Baer et al., 2002).
In conclusion, regional economic integration in
South America has made some progress. However,
there is still much work to be done to boost economic
growth and reduce poverty. MERCOSUR must
overcome its challenges and establish stronger
mechanisms for policy coordination to achieve its
objectives. Further research is needed to assess the
impact of MERCOSUR on economic growth and
poverty reduction in South America and to identify
the most effective ways to promote economic
integration in the region.
There are several approaches used to analyze
regional economic integrations, including the neo-
classical trade theory, the new trade theory, and the
political economy approach.
The neo-classical trade theory views regional
economic integration as a means of increasing trade
and promoting economic growth by removing trade
barriers and creating a single market. This approach
focuses on the benefits of trade, such as increased
efficiency and specialization, and argues that these
benefits will lead to increased economic growth and
improved living standards for the participating
countries citizens. (Pereira et al., 2021; González et
al., 2019).
On the other hand, the new trade theory focuses
on the importance of economies of scale and the role
of multinational corporations in shaping trade
patterns. This approach recognizes that multinational
corporations can use their bargaining power to
influence trade policies and shape the trade structure
within a region. The new trade theory also recognizes
that technological advances and the growth of the
service sector have changed the nature of trade,
International Economic Integration from the Perspective of Economic Complexity and Economic Fitness: A Methodological Proposal
113

making it more difficult for governments to influence
trade patterns through traditional trade policies.
(Amine,1986).
The political economy approach focuses on the
role of political institutions and power relations in
shaping regional economic integration. This approach
argues that the political dynamics of a region,
including the distribution of power among countries
and the bargaining power of different actors,
significantly impact the success or failure of regional
economic integration efforts. The political economy
approach recognizes that the distribution of costs and
benefits of integration is not equal among the
participating countries, and that the ability of
countries to participate in regional integration efforts
is influenced by their relative power and bargaining
position (Zaman et al., 2021; Timini & Viani, 2022).
3 METHODOLOGIES
This paper proposes a well-structured methodology to
analyze the incidence of different regional and
international economic blocks in world economic
complexity. To achieve the goal, not only the well-
known methods such as Economic Complexity or
Economic Fitness, which have been studied from
2010 onwards, are required.
In this sense, a methodology is presented that
extrapolates concepts of economic complexity to
analyze regional economic integration, as seen in the
work of Pereira, González & Blanco., (2021) or
González, Pereira & González., (2022), who did so to
identify sustainability capacities in the countries.
Therefore, it is feasible to establish a methodological
and experimental framework to apply to real data and
real economic blocks (even fictitious) such as
MERCOSUR (In South America) and the EU (In
Europe), among others.
A methodology defined in two parts is presented;
in the first where the Methodology is designed based
on the tools and metrics of Economic Complexity and
Economic Fitness. In the second part, the
recommended Experimental Process is presented.
3.1 Economic Complexity and
Economic Fitness Approaches for
International Economic
Integration: A Methodological
Proposal
The Methodological Design for the Study of
International Economic Integration is presented in
three well-detailed steps, for analyzing the scientific
community and its possible practical application. The
steps are detailed below:
Step 1: The Problem of International Economic
Integration
The theory of Economic Complexity establishes that
those countries that can produce and export more
products than others and that these products are not
exported by other countries to a large extent have a
great probability of having more complex economies
and consequently greater probability of development
and well-being for its inhabitants. In simple terms,
productive capabilities are highly embedded in
societies with complex economies.
Therefore, and from this point of view, the
problem in understanding how to integrate the
countries economically is to identify the combined
productive capabilities which would exist if two or
more countries that make up an economic bloc are
considered as a single country. This process is
feasible to analyze, and a theoretical and
experimental work framework can be established,
which is presented in this study and begins as follows.
Originally there is a matrix 𝑋
𝑐𝑝
of World Exports
for a certain year, where:
• 𝑖 = {1,2,3,..,𝑐} where “𝑐” is the quantity of
countries with records of total exports in the
world in a certain period (usually it is annual).
• 𝑗 ={1,23,..,𝑝} where “𝑝” is the quantity of
registered and standard coded products in the
world (The Standard International Trade
Classification (SITC) or the Harmonized
System (HS) code can be used as a reference for
real products).
𝑋
𝑐𝑝
=
𝑝
1
𝑝
2
⋯𝑝
𝑗
𝑐
1
𝑐
2
⋮
𝑐
𝑖
𝑥
11
𝑥
12
𝑥
21
𝑥
22
⋯𝑥
1𝑗
…𝑥
2𝑗
⋮⋮
𝑥
𝑖1
𝑥
𝑖2
⋱⋮
⋯𝑥
𝑖𝑗
Each entry in the Matrix corresponds to the total
exported (in monetary terms, generally in US Dollars)
from a country "𝑖" registered for the product "𝑗". So,
for this study, it is proposed to analyze regional
economic integration through "Economic Blocks", if
possible, it would be good if such blocks exist. In any
case, it does not matter that they are fictitious since
they could be a case study for academic purposes.
An "Economic Block" is defined as a composition
of at least two countries, which can be fictitious or
real, where the combination of productive capabilities
COMPLEXIS 2023 - 8th International Conference on Complexity, Future Information Systems and Risk
114

is assumed by adding the total exports of each similar
product from the member countries.
The process of defining the analysis of the
International Economic Integration begins with the
definition of the "Economic Blocks", where there is a
matrix, whose entries correspond only to the data of
the products exported from the countries that make up
the block. The following matrix is obtained:
𝐸𝐵
𝑘𝑝
=
𝑝
1
𝑝
2
⋯𝑝
𝑗
𝑐´
1
𝑐´
2
⋮
𝑐´
𝑙
𝑥
11
𝑥
12
𝑥
21
𝑥
22
⋯𝑥
1𝑗
…𝑥
2𝑗
⋮⋮
𝑥
𝑙1
𝑥
𝑙2
⋱⋮
⋯𝑥
𝑙𝑗
where:
• 𝐶´=
{
𝑐´ / 𝑐´∈𝑋
∨ 𝑛
(
𝐶´
)
≥2
}
where
𝐶´ represents the set of countries that
are part of a certain international economic
block. E.g. 𝐶´={𝑐
,𝑐
,𝑐
} international
economic block made up of countries c
1
, c
2
and c
3
.
• 𝑙 ={1,2,3,…,𝑘} where 𝑘=𝑛
(
𝐶´
)
and
represents the quantity of countries of a cert of
a certain international economic block. E. g. If
the set 𝐶´=
{
𝑐
,𝑐
,𝑐
}
of the countries that
are part of a given international economic
block is taken,
𝑘=𝑛
(
𝐶´
)
represents the
number of countries that belong to the block.
It is a mandatory condition that 𝑘≥2.
Subsequently, a single-row vector is obtained that
corresponds to the sum of all the export values of all
the countries of the block, for each one of the
products, maintaining the quantity of these and thus
disappearing the countries that originated them. the
block. The block vector is obtained as follows:
𝐵=
(
𝑏
𝑏
⋯𝑏
)
and each of the of the entries of the vector is
calculated as follows:
𝑏
= 𝑥
(9)
This new vector 𝐵 replaces the countries that
belong to the economic bloc and there is a new world
export matrix for the given year. There is the
particularity that 𝑘<𝑐 since the Economic Block
had to absorb at least two countries to be considered
as such.
The new export matrix, including the economic
block represented by B, should have the dimension
𝑋
where 𝑚 = 1 + (𝑐 − 𝑘). In this way, there is
1 (one) new country and "𝑘" countries of the
economic block are excluded from the total of "𝑐"
original countries. The matrix is as follows:
𝑋
𝑚𝑝
=
𝑝
1
𝑝
2
⋯𝑝
𝑗
𝐵
= 𝑐
1
𝑐
2
⋮
𝑐
𝑥
11
𝑥
12
𝑥
21
𝑥
22
⋯ 𝑥
1𝑗
…𝑥
2𝑗
⋮⋮
𝑥
𝑓1
𝑥
𝑓2
⋱⋮
⋯𝑥
𝑓𝑗
Where:
• 𝑓 = {1,2,3,..,𝑚} where “𝑚” is the quantity of
countries and the international economic block
with records of total exports in the world in a in
a specific year.
• 𝑗 ={1,23,..,𝑝} where “𝑝” is the quantity of
registered and standard coded products in the
world.
The data will be obtained from the export matrix
𝑿
𝒎𝒑
to carry out the analysis of the incidences of the
international economic blocks with the selected
metrics (Economic Complexity or Economic
Fitness).
Step 2: Quantification of Productive Capabilities of
International Economic Blocks.
To determine if a country has minimum productive
capacities for a certain product, Hidalgo &
Haussman., (2009) established the use of the
Revealed Comparative Advantage Index (RCA)
proposed by Balassa. (1965) as a mechanism;
therefore, it is a mandatory step to use the Economic
Complexity and Economic Fitness metrics.
Then, we calculate the VCR index for the Original
Export Matrix (X
cp
) and for the Export Matrix that
includes an International Economic Block (All the
X
mp
of the blocks formed). It is recommended to carry
out the analysis with a single economic block at a
time, or failing that, if tests are to be carried out with
two or more blocks at the same time, that these be
mutually exclusive with their member countries, that
is, that each block has its own their own countries
without repeating them in the other blocks (More
details on this subject are presented in Section 3.2).
Once the calculations of the RCA (See (6) to X
cp
and to all the X
mp
blocks have been completed, the
M
cp
matrix must be determined for each case. With
this it is possible to obtain the different measures of
Economic Complexity or Economic Fitness.
Step 3: Complexity approaches to the model:
Economic Complexity and Economic Fitness
Given the M
cp
Matrix, calculated according to the
procedure mentioned in the previous step, it is then
International Economic Integration from the Perspective of Economic Complexity and Economic Fitness: A Methodological Proposal
115
possible to use the mathematical models of
complexity measures proposed by Hidalgo &
Haussman., (2009) for the case of Economic
Complexity and those proposed by Tacchella et al.,
(2012) in the case of the Economic Fitness models.
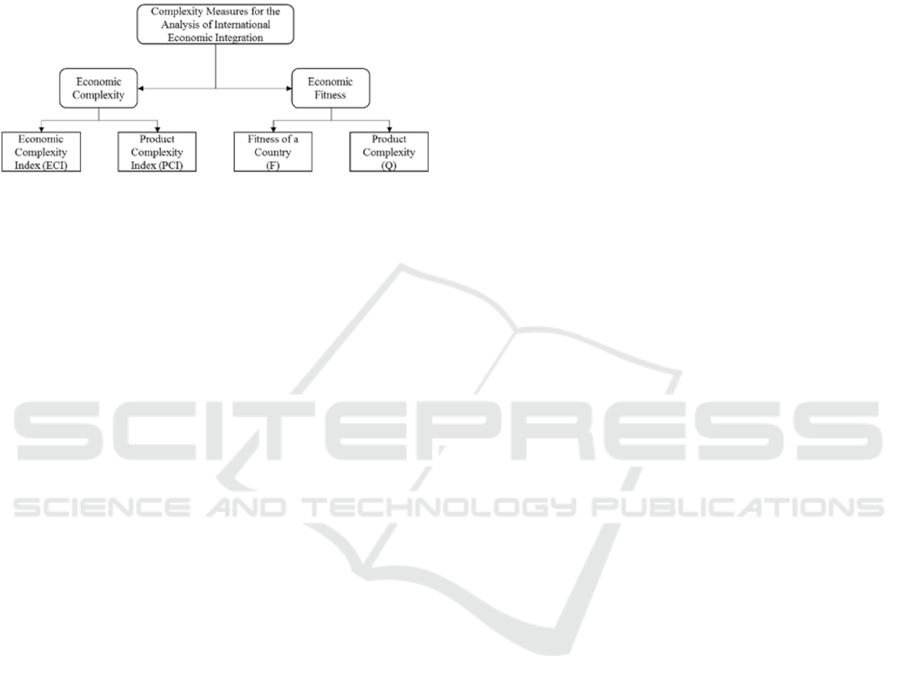
Figure 2 shows a scheme of the main metrics
recommended to apply to the analysis of international
economic integration.
Figure 2: Recommended Measures of Complexity.
If the Economic Complexity approach is used, the
recommended metrics are the Economic Complexity
Index (ECI) and the Product Complexity Index
(PCI). It would also be feasible to carry out the
Product Space calculations, however, with the first
two measurements, it would be enough. In the case of
the Economic Fitness approach, the metrics are
recommended: Country Fitness (F) and Product
Complexity (Q). They would be the counterparts of
the previous ones. Both approaches have their
particularities, pros and cons, and the debate on them
continues to this day.
3.2 Experimental Application Steps
It is important to note that in section 3.1, a
methodology has been developed in a general way
that allows the study of international economic
integration, however making a detailed study with
real data entails quite an interesting effort and even
makes it quite difficult to apply the two approaches.
proposed (Economic Complexity and Economic
Fitness). It is possible, that for a real situation, it
should be done separately. In this part of the work,
some steps to follow are proposed to apply an
experimental case study, where all the recommended
metrics are used (See Figure 2).
The experimental process carried out in this study
will be systematically detailed, as well as
recommendations for its application with a real case.
This will serve to have a first approximation of what
it would have at the time of a real application. It is
important to highlight that an Experimental Data Box
will be presented in a general way that will serve as a
guide in this section and in each step. The data, results
and graphs will be available in a repository for those
who are interested (See Experimental Data Box).
Step 1: Definition of Fictitious Economic Blocks
For this experimental study, a dummy export data
matrix was defined, consisting of ten countries (𝑐=
10) and fifteen export products (𝑝=15). Thus, there
is an 𝑿
𝒄𝒑
matrix with the following dimensions
𝑿
𝟏𝟎,𝟏𝟓
for further analysis. Matrix entries were
arbitrarily defined and randomly drawn from a real
export dataset, with 147 countries and more than 1000
products. It is recommended to adopt this procedure
that ensures a good random process, however
functions that generate a random matrix can be used
for analysis.
To have a basic guide of this procedure, and those
that come in the following steps, an "Experimental
Data Box" is presented where you can observe the
steps that will be described. In this sense, the
Fictitious Matrix for this case study can be seen in
Table 1.
For a possible application to real cases, the use of
export data is recommended either under the SITC
coding or under the HS coding. With a disaggregated
four-digit export database, it will be possible to have
a very good basis for working on the procedure
presented in this paper.
Step 2: Definition of the International Economic
Blocks and Initial Calculations.
For this case study, three fictitious economic blocks
were established that will be analyzed separately in
such a way as to compare the results obtained first
with the reference, which is the Original Matrix
(Without any economic block), and with the results
obtained from the other blocks. Given that there are a
total of ten fictitious countries, the conformation of
the 3 blocks is the following:
• 𝐶´=
{
𝑐
,𝑐
,𝑐
,𝑐
}
Ec. Block #1
• 𝐶´=
{
𝑐
4
,𝑐
,𝑐
}
Ec. Block #2
• 𝐶´=
{
𝑐
,𝑐
,𝑐
,𝑐
,
𝑐
,
𝑐
}
Ec. Block #3
This step simply consists of grouping the
countries that make up an international economic bloc
into sets 𝑪′. For an application with real data, existing
blocks such as the European Union or MERCOSUR
can be used, but also for academic purposes fictitious
blocks or those that are not really conformed can be
created, such as URUPABOL (Uruguay, Paraguay,
and Bolivia in South America) or the BRICS bloc
(Brazil, Russia, India, China, and South Africa). In
this way, many issues could be analyzed that could be
COMPLEXIS 2023 - 8th International Conference on Complexity, Future Information Systems and Risk
116

starting points for economic integration policies
between countries, among other things.
Then, the following steps should be
systematically applied:
• Build an export matrix where there are only
the countries that make up a block or in this
case, the different blocks. In other words, the
Export Matrix 𝑬𝑩
𝒌𝒑
is defined.
• Immediately the vector 𝑩 must be calculated,
which consists of the sum of all the exports of
each country for each of the products, using (9.
• Subsequently, the new Export Matrix is
established where the data of all the countries
that are part of the blocks are replaced by the
respective data of vector 𝑩. The Final
Exportation Matrix 𝑿
𝒎𝒑
is defined.
• Finally, the corresponding calculations are
made to obtain the M
cp
Matrix of each of the
economic blocks studied. The (6 and the (7 are
used for this purpose.
Once these steps are completed, the mathematical
complexity models can be applied to each case. Table
2 shows in detail the process to be followed with one
of the blocks defined for this study as an example.
And Figure 1 shows the four M
cp
matrices that will
be applied to the mathematical models of complexity
for this case study.
The problem of International Economic
Integration is complex, and with many edges to
observe and certainly, this proposal has a high
potential to become an analysis tool that can be used
by policy makers and decision makers within the
framework of the problem.
Step 3: Experimental Rounds under the Economic
Complexity and Economic Fitness models
For the case study, calculations will be made for all
previously recommended complexity measures (See
Figure 2). The mathematical-computational model
was created based on the Economic Complexity
models proposed by Hidalgo & Haussman., (2009)
and based on the Economic Fitness models proposed
by Tacchella et al., (2012) and runs were made using
proprietary models in the software MatLab®. (In case
any interested party requires the models, they can
request it from the authors without any
inconvenience).
The calculations were systematically performed
as follows:
Table 3: Complexity Measures Applied to the Study
Matrices.
Applied to
Economic
Complexity
Economic
Fitness
ECI PCI F Q
Original Matrix x x x x
Ec. Block #1 x x x x
Ec. Block #2 x x x x
Ec. Block #3 x x x x
Step 4: Analysis of Experimental Results
Once the experimental runs were finished to the data
presented with the approaches to economic
complexity and economic fitness, the following
analyzes of the results and discussions were carried
out:
• Descriptive analysis of the results of the MCP
(original matrix and economic blocks):
Descriptive analysis of two fundamental
indicators for the studies of the complexity
metrics that are: the diversity of the countries
(k
c,0
) and the ubiquity were carried out and the
ubiquity of products (k
p,0
). The discussions
about these results will mark the guideline on
the results of the different complexity
measures.
• Analysis of the results corresponding to the
complexity of the products for each metric
(ICP & Q
P
): For practical purposes, the
positions that the products occupy according
to their performance with the PCI and the PCI
and the QP were used. It is important to keep
in mind that the number of products does not
vary depending on the configuration of the
economic blocks, therefore, it is easier to
directly compare the variation of the
performances according to the position in the
ranking that the products occupy. Depending
on this, analysis and discussions were carried
out.
• Analysis of the results corresponding to the
economic complexity of the countries for
each metric (ECI & FC): It is important
directly the variation of the performances
according to the position in the ranking that
International Economic Integration from the Perspective of Economic Complexity and Economic Fitness: A Methodological Proposal
117

each country and each block occupies based
on the performance of its ECI and the F
C
. The
comparisons were made for each economic
block and for the original matrix each with
themselves but comparing the results obtained
in the ECI Vs. F
C
in such a way to analyze and
discuss those results.
In the case of the application to real data, it is
advisable to carry out a good study either using the
Economic Complexity measures or the Economic
Fitness measures. Although it is not something
extremely difficult to do, there are many factors and
elements that must be analyzed for each approach. In
fact, the analyzes carried out in this work are barely
minimal.
Step 5: Conclusions and Recommendations
After the analysis of the results, a conclusion on the
methodological proposal is presented, as well as a
critical review of the results and the model presented.
4 RESULTS & DISCUSSIONS
After the application of the mathematical models of
Economic Complexity and Economic Fitness, to the
different M
cp
matrices (Original Matrix and
Economic Blocks), the following coupled results of
some discussions are presented. Prior to the analysis
of the results of the complexity metrics, in Figure 3,
you can see a graph where the behavior of the
ubiquities of the products is recorded. It is observed
that the economic blocks affect the different
ubiquities as the block is more comprehensive or
large. In the curve of the original matrix (light blue
line), ubiquity peaks are observed, that is to say that
there were products for which many countries had the
capacity to produce them, however, for Economic
Block #3 (the block with the largest number of
members), ubiquities decrease drastically, which
implies that many capabilities are absorbed, both by
the block itself, which becomes more diverse, and by
products that become less ubiquitous, which could
affect the complexities (ECI & F
c
).
In Figure 4, another very important indicator for
complexity measures can be seen, which is the
diversity of countries. It can be clearly seen in the
figure that the crosses are not continuous, since the
economic blocks that were formed imply the
disappearance of the countries that formed them. In
general, blocks that include many countries, or even
those that contain countries that are already diverse,
have a high diversity index. However, those blocks
like Ec. Block #2 (B#2), whose member countries are
c
4
, c
6
and c
8
; which are countries with a low level of
diversity, clearly affect the bloc. It is important to
note that both Diversity and Ubiquity by themselves
do not provide all the information on the complexity
of a given country. Although the block is not very
diverse, perhaps the capabilities that they ended up
"absorbing" could generate an increase, or rather, a
variation in complexity.
Figure 3: k
p,0
- Ubiquity of the Products for each matrix M
cp
(Original Matrix and Economic Blocks).
Figure 4: k
c,0
- Diversity of the countries and economic
blocks defined in each matrix M
cp
(Original Matrix and
Economic Blocks).
Analyzing the first measure of complexity,
Figure 5 shows the results of the PCI of the Products
for each case study. This measure corresponding to
the Economic Complexity approach shows a very
important variation for each of the economic blocks
and initially to the results corresponding to the
original matrix. The most complex product for the
Initial Matrix is Product 15 (p
15
) which undergoes
variations in its position and consequently its
complexity did. The most evident behavior is that the
complexities undergo considerable changes due to the
variation of blocks, at least with the PCI metric.
COMPLEXIS 2023 - 8th International Conference on Complexity, Future Information Systems and Risk
118

Figure 5: Position in the performance ranking of Product
Complexity Index (PCI) for all case studies.
On the other hand, in Figure 6, the results of the
positions of the products based on the Q
p
metric show
more robust (They maintain the same position
regardless of the economic block analyzed) results for
the main products (the most complex ones),
especially those characterized by low ubiquity. The
behavior is quite different from that recorded in
Figure 5. The products p
15
, p
6
and p
8
are quite robust
to the variation of the economic blocks. In this way,
it can be observed how the results of the complexity
of products (PCI & Q
p
), set the pattern of the effects
produced by the economic integration of the
countries.
Figure 6: Position in the performance ranking of Product
Complexity (Q
c
) for all case studies.
Figure 7: Position in the performance ranking of complexity
metrics (ECI - F
c
) for the case of the Original Matrix.
Observing from the point of view of the countries,
in Figure 7, you can see the results of the original
matrix, where only the countries are and without any
blocks. The differences between the ranking of the
countries for the ECI and F
c
metrics show certain
differences, although in some cases, such as c
4
, c
2
and
c
1
, which are very marked, the rest, relatively, behave
in a similar way. The logic behind the results can be
observed, for example, c
4
and c
9
, which are the best
performers for the different metrics (ECI and F
c
), the
first is characterized by having low diversity and the
other with high diversity, however, for the ECI
approach, the c
4
products are less ubiquitous, which
generates that greater capacities are required,
however, for the Fc approach, the c
9
country that has
a higher level of diversity, has several products that
are less ubiquitous, so it provides more information
to generate a highly complex situation in the country.
In the case of Economic Block #1, in Figure 8, it
is found that for both metrics, the most complex
country is c
9
, given that in this case, the block studied
is in the highest places in both cases, therefore that it
can be seen joining the economic bloc favors the
member countries and what has been mentioned so
far has been fulfilled.
Figure 8: Position in the performance ranking of complexity
metrics (ECI - F
c
) for the case of the International
Economic Block #1.
Figure 9: Position in the performance ranking of complexity
metrics (ECI - F
c
) for the case of the International
Economic Block #2.
International Economic Integration from the Perspective of Economic Complexity and Economic Fitness: A Methodological Proposal
119
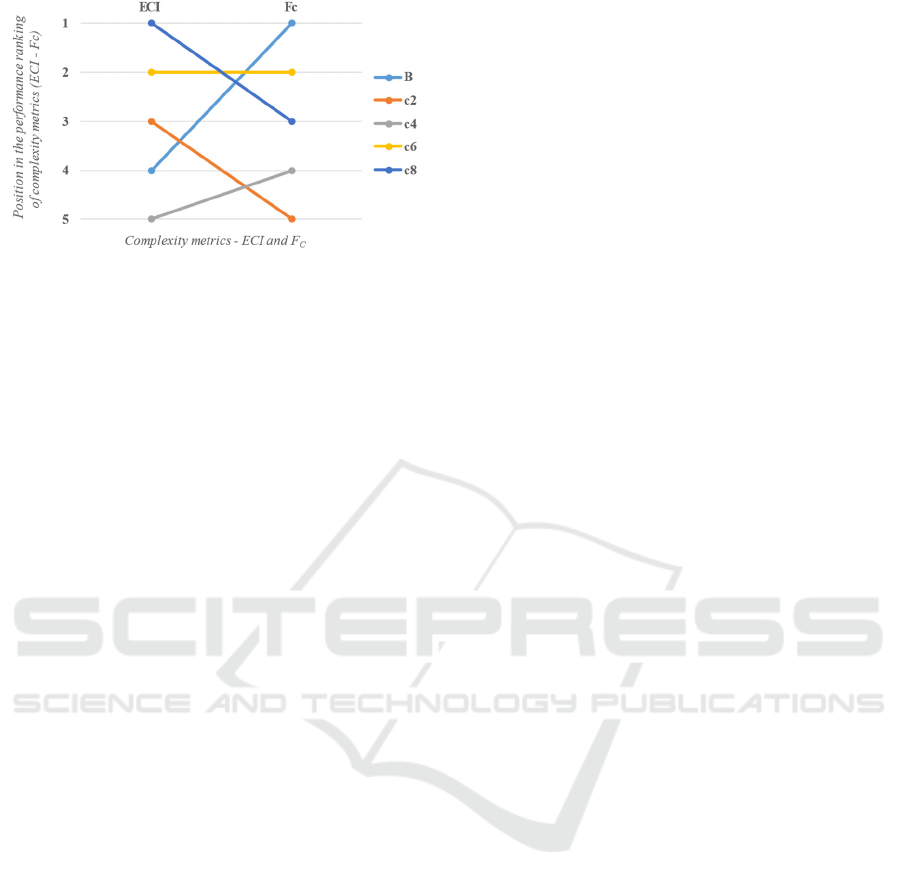
Figure 10: Position in the performance ranking of
complexity metrics (ECI - F
c
) for the case of the
International Economic Block #3.
In the case of Economic Block #2, there are two
well-marked behaviors. Within the same block is the
country c
2
, which already in Figure 7, occupied the
first places with the ECI, however, in the same way,
this behavior is repeated.
In the latter case, the behavior of the last
economic block studied can be observed. Economic
block #3 represents the block with the largest number
of countries (See Figure 10). In the case of the F
c
, the
Block represents the country with the highest fitness,
on the other hand, the country c
8
, is located in the
highest position with the ECI, since at the end of the
capacity identification process, it ends up with only
two products with comparative advantages, in
addition, these products end up being less ubiquitous,
which is why for the approach (ECI), it ends up
becoming a more complex economy.
5 CONCLUSIONS
With this work, it was possible to carry out a very
important analysis that allowed us to describe the
results obtained by applying various complexity
metrics to some case studies where economic blocks
were formed with various experimental tests with
fictitious data. In this way some very important
questions could be answered to begin to study
international economic integration.
It is possible to apply Economic Complexity
metrics (Economic Complexity Index and Product
Complexity Index) and also Economic Fitness
metrics (Country Fitness and Product Complexity),
for which certain hypotheses must be assumed, which
certainly they would be quite strong, but mainly it
must be assumed that when establishing an economic
bloc, the productive capacities of the countries that
are part of the economic blocs are directly added,
which is very simple in practical terms, however, in
the It actually represents a very complex and difficult
situation to achieve. But following the
methodological proposal, it is possible to quantify the
productive capacities of an economic block quite
effectively.
The most important points that can be concluded
with the results of the experimental tests are that the
economic blocks affect both the ubiquity of the
products and the diversity of the countries, which
implies a direct effect on the complexity metrics
(ECI, PCI, F
c
and Q
c
). The economic blocks
represent an opportunity for countries to improve
their possible situations in terms of Complexity,
which would increase the probability of achieving
development (increasing complexity implies
increasing the probability of achieving economic
development and improvement in many things).
It is very important to highlight that this
methodological procedure is the first step to advance
in an area that has practically not taken this type of
problem into account, which is economic integration
or international productive integration. The
complexity of creating integration ties between
different nations is high and has been the subject of
study for a long time, and this methodology aims to
provide a useful tool that can be used by policy
makers and decision makers as an input in the
process. analysis and design of international policies
in the area. The problem of international economic
integration will always persist; therefore, new
analytical tools and perspectives will always be of
great help in the process.
In terms of academic essays, it is recommended
to continue with them, experimentally, applying more
than one economic block for each run or calculation
of complexity metrics (both approaches) in addition
to carrying out more in-depth studies to interpret the
particularities obtained by both approaches. and their
differences (Economic Complexity Vs. Economic
Fitness). In the case of the use of real export data, it
is recommended to study historical data and approach
the studies with separate approaches (Economic
Complexity and on the other hand Economic Fitness),
in such a way that an analysis of the results can be
adequately carried out.
ACKNOWLEDGEMENTS
The authors are very grateful to the Paraguayan
National Council of Science and Technology
(CONACyT) for financial support through the
PRONII Program.
COMPLEXIS 2023 - 8th International Conference on Complexity, Future Information Systems and Risk
120

AUTHORS CONTRIBUTIONS
The authors declare the following contributions in
this study:
Activities
Methodology
Literature
Review
Mathematic
Model
Data
Manuscript
Calculations
Results
Analysis
A.G. X X X X X X X
S. G. X X X X X X X
G. P. X X X X
G. B. X X X
C. vL. X X X
REFERENCES
Amine, L. S. (1986). Multinational corporations in Eastern
Europe: Welcome trade partners or unwelcome change
agents?. Journal of Business Research, 14(2), 133-145.
Balassa, B. (1965). Trade liberalisation and “revealed”
comparative advantage 1. The manchester school,
33(2), 99-123.
Basnet, H. C., & Pradhan, G. (2017). Regional economic
integration in Mercosur: The role of real and financial
sectors. Review of development finance, 7(2), 107-119.
Basnet, H. C., & Pradhan, G. (2017). Regional economic
integration in Mercosur: The role of real and financial
sectors. Review of development finance, 7(2), 107-119.
Baer, W., Cavalcanti, T., & Silva, P. (2002). Economic
integration without policy coordination: the case of
Mercosur. Emerging Markets Review, 3(3), 269-291.
Cristelli, M., Gabrielli, A., Tacchella, A., Caldarelli, G., &
Pietronero, L. (2013). Measuring the intangibles: A
metrics for the economic complexity of countries and
products. PloS one, 8(8), e70726.
Cristelli, M., Tacchella, A., & Pietronero, L. (2015). The
heterogeneous dynamics of economic complexity. PloS
one, 10(2), e0117174.
Carranza, G. G. (2017). Íter constitutivo y desafíos del
Parlamento del Mercosur. Especial alusión al caso
argentino. Cuestiones constitucionales, (36), 51-77.
Caceres, L. R. (2011). Economic integration and
unemployment in Mercosur. Journal of Economic
Integration, 45-65.
González, S.; Pereira, G. and González, A. (2022).
Sustainability and Goal Fitness Index for the Analysis
of Sustainable Development Goals: A Methodological
Proposal. In Proceedings of the 7th International
Conference on Complexity, Future Information Systems
and Risk - COMPLEXIS, ISBN 978-989-758-565-4;
ISSN 2184-5034, pages 105-115. DOI:
10.5220/0011122400003197
González, A., Ortigoza, E., Llamosas, C., Blanco, G., &
Amarilla, R. (2019). Multi-criteria analysis of
economic complexity transition in emerging
economies: The case of Paraguay. Socio-Economic
Planning Sciences, 68, 100617.
Hausmann R, Hidalgo CA, Bustos S, Coscia M, Chung S,
Jimenez J., Simoes, A., Yildirim, M., 2011. The Atlas
of economic complexity: mapping paths to prosperity.
Cambridge, Mass: Center for International
Development, Harvard University; Harvard Kennedy
School; Macro Connections, Massachusetts Institute of
Technology
Hidalgo CA, Hausmann R. The building blocks of
economic complexity. Proc Natl Acad Sci USA
2009;106(26):10570–5. http://dx.doi.org/10.1073/pnas.
Hidalgo, C. A. (2021). Economic complexity theory and
applications. Nature Reviews Physics, 3
(2), 92-113.
Mariani, M. S., Vidmer, A., Medo, M., & Zhang, Y.-C.
(2015). Measuring economic complexity of countries
and products: which metric to use? The European
Physical Journal B, 88(11). doi:10.1140/epjb/e2015-
60298-7
Morrison, G., Buldyrev, S. V., Imbruno, M., Doria Arrieta,
O. A., Rungi, A., Riccaboni, M., & Pammolli, F.
(2017). On economic complexity and the fitness of
nations. Scientific Reports, 7(1), 15332.
Pugliese, E., Zaccaria, A., & Pietronero, L. (2016). On the
convergence of the Fitness-Complexity Algorithm. The
European Physical Journal Special Topics, 225(10),
1893-1911.
Pereira, G.; González, A. and Blanco, G. (2021).
Complexity Measures for the Analysis of SDG
Interlinkages: A Methodological Approach. In
Proceedings of the 6th International Conference on
Complexity, Future Information Systems and Risk -
COMPLEXIS, ISBN 978-989-758-505-0; ISSN 2184-
5034, pages 13-24. DOI: 10.5220/0010374600130024
Pérez Bustamante, R. (2012). Formas y ventajas de la
integración. Mediterráneo Económico, 22, 205-212.
Pereira, G., González, A., & Ríos, R. (2021). Capturing
multidimensional energy poverty in South America: a
comparative study of Argentina, Brazil, Uruguay, and
Paraguay. Frontiers in Sustainable Cities, 46.
Tacchella, A., Cristelli, M., Caldarelli, G., Gabrielli, A., &
Pietronero, L. (2012). A new metrics for countries'
fitness and products' complexity. Scientific reports,
2(1), 1-7.
Tacchella, A., Cristelli, M., Caldarelli, G., Gabrielli, A., &
Pietronero, L. (2013). Economic complexity:
conceptual grounding of a new metrics for global
competitiveness. Journal of Economic Dynamics and
Control, 37(8), 1683-1691.
Timini, J., & Viani, F. (2022). A highway across the
Atlantic? Trade and welfare effects of the EU-Mercosur
agreement. International Economics, 169, 291-308.
Vinci, G. V., & Benzi, R. (2018). Economic complexity:
Correlations between gross domestic product and
fitness. Entropy, 20(10), 766.
Zaman, M., Pinglu, C., Hussain, S. I., Ullah, A., & Qian, N.
(2021). Does regional integration matter for sustainable
economic growth? Fostering the role of FDI, trade
openness, IT exports, and capital formation in BRI
countries. Heliyon, 7(12), e08559.
International Economic Integration from the Perspective of Economic Complexity and Economic Fitness: A Methodological Proposal
121
