
Embedding-Enhanced Similarity Metrics for Next POI Recommendation
Sara Jarrad
1
, Hubert Naacke
1
, Stephane Gancarski
1
and Modou Gueye
2
1
LIP6, Sorbonne University, Paris, France
2
Department of Mathematics and Computer Science, Cheikh Anta Diop University, Dakar, Senegal
Keywords:
Point of Interest (POI), Next POI Recommendation, Word Embedding, Word2Vec, Similarity Metrics.
Abstract:
Social media platforms allow users to share information, including photos and tags, and connect with their
peers. This data can be used for innovative research, such as proposing personalized travel destination recom-
mendations based on user-generated traces. This study aims to demonstrate the value of using embeddings,
which are dense real-valued vectors representing each visited location, in generating recommendations for the
next Point of Interest (POI) to visit based on the last POI visited. The Word2Vec language model is used to
generate these embeddings by considering POIs as words and sequences of POIs as sentences. This model
captures contextual information and identifies similar contexts based on the proximity of numerical vectors.
Empirical experiments conducted on a real dataset show that embedding-based methods outperform conven-
tional methods in predicting the next POI to visit.
1 INTRODUCTION
Social networks provide valuable information on user
mobility and behavior, with geolocated data allowing
the identification of users’ itineraries and POIs vis-
ited. We are interested in the task of predicting the
next POI, which is of primary importance not only
for tourism but also for discovering new areas.
The challenges we face include data densification,
and using embeddings for next POI recommendation.
An active line of research is the use of language
models for recommendation tasks. However, most of
existing solutions focus on recommending items (e.g.,
products, movies) which is based on personal prefer-
ences and behavioral data, does not consider the se-
quential context and characteristics of mobility trajec-
tories. Therefore they are not applicable to the next
POI recommendation problem.
In this study, since user check-ins (photos labeled
with place and time) are sequential data, we target
the Word2Vec model for its efficiency in handling
sequential data, and investigate whether embeddings
provide benefits over classical recommendation meth-
ods. We have the following contributions:
• POI extraction and dataset construction.
• Embedding-enhanced similarity functions for tra-
jectory comparison.
• Solution’s implementation on the Spark parallel
computing engine, chosen for its speed and ability
to perform distributed processing, and computa-
tions on large-scale datasets for complex analysis.
• Extensive experiments using a large-scale
dataset of geolocated photos collected from
YFCC100M (Thomee et al., 2016), along with an
in-depth analysis of different parameters’ impact
on the prediction’s quality.
2 PROBLEM DEFINITION
Neural networks, particularly the Word2Vec
model (Mikolov et al., 2013), have gained at-
tention for their success in various NLP tasks. A line
of work investigates the potential of embeddings for
recommendation tasks (Grbovic et al., 2015).
This study aims to compare the effectiveness of
embeddings with classical methods that don’t use
them for next POI recommendation. However, this
raises two problems. Firstly, to learn Word2Vec em-
beddings, a dataset of sentences with a common vo-
cabulary is required, which creates a density prob-
lem when applied to check-ins data. Secondly, since
next POI recommendation is a collaborative filtering
method, finding similar trajectories to a given one is
essential, posing a trajectory similarity problem.
Jarrad, S., Naacke, H., Gancarski, S. and Gueye, M.
Embedding-Enhanced Similarity Metrics for Next POI Recommendation.
DOI: 10.5220/0012060300003541
In Proceedings of the 12th International Conference on Data Science, Technology and Applications (DATA 2023), pages 247-254
ISBN: 978-989-758-664-4; ISSN: 2184-285X
Copyright
c
2023 by SCITEPRESS – Science and Technology Publications, Lda. Under CC license (CC BY-NC-ND 4.0)
247
2.1 Dataset Density Problem
We consider a dataset that only includes check-ins
made by users and their geo positions (latitude and
longitude). Our study is based on the YFCC dataset,
which has a low number of check-ins per geo posi-
tion, with an average of only 4 check-ins.
However, to recommend POIs based on user
check-ins, we need locations that have been checked
in by many users, which is not the case for our dataset.
Therefore, we aim to increase the dataset’s density.
Let D be a dataset, its density, expressed as the
average number of check-ins per position, is denoted
d(D). The dataset density problem can be stated as
follows: given a dataset D such that d(D) = d
0
, and
a higher density value d
1
to reach (d
1
> d
0
), find sets
of close POIs to merge, which results in a dataset D
′
such that d(D
′
) = d
1
.
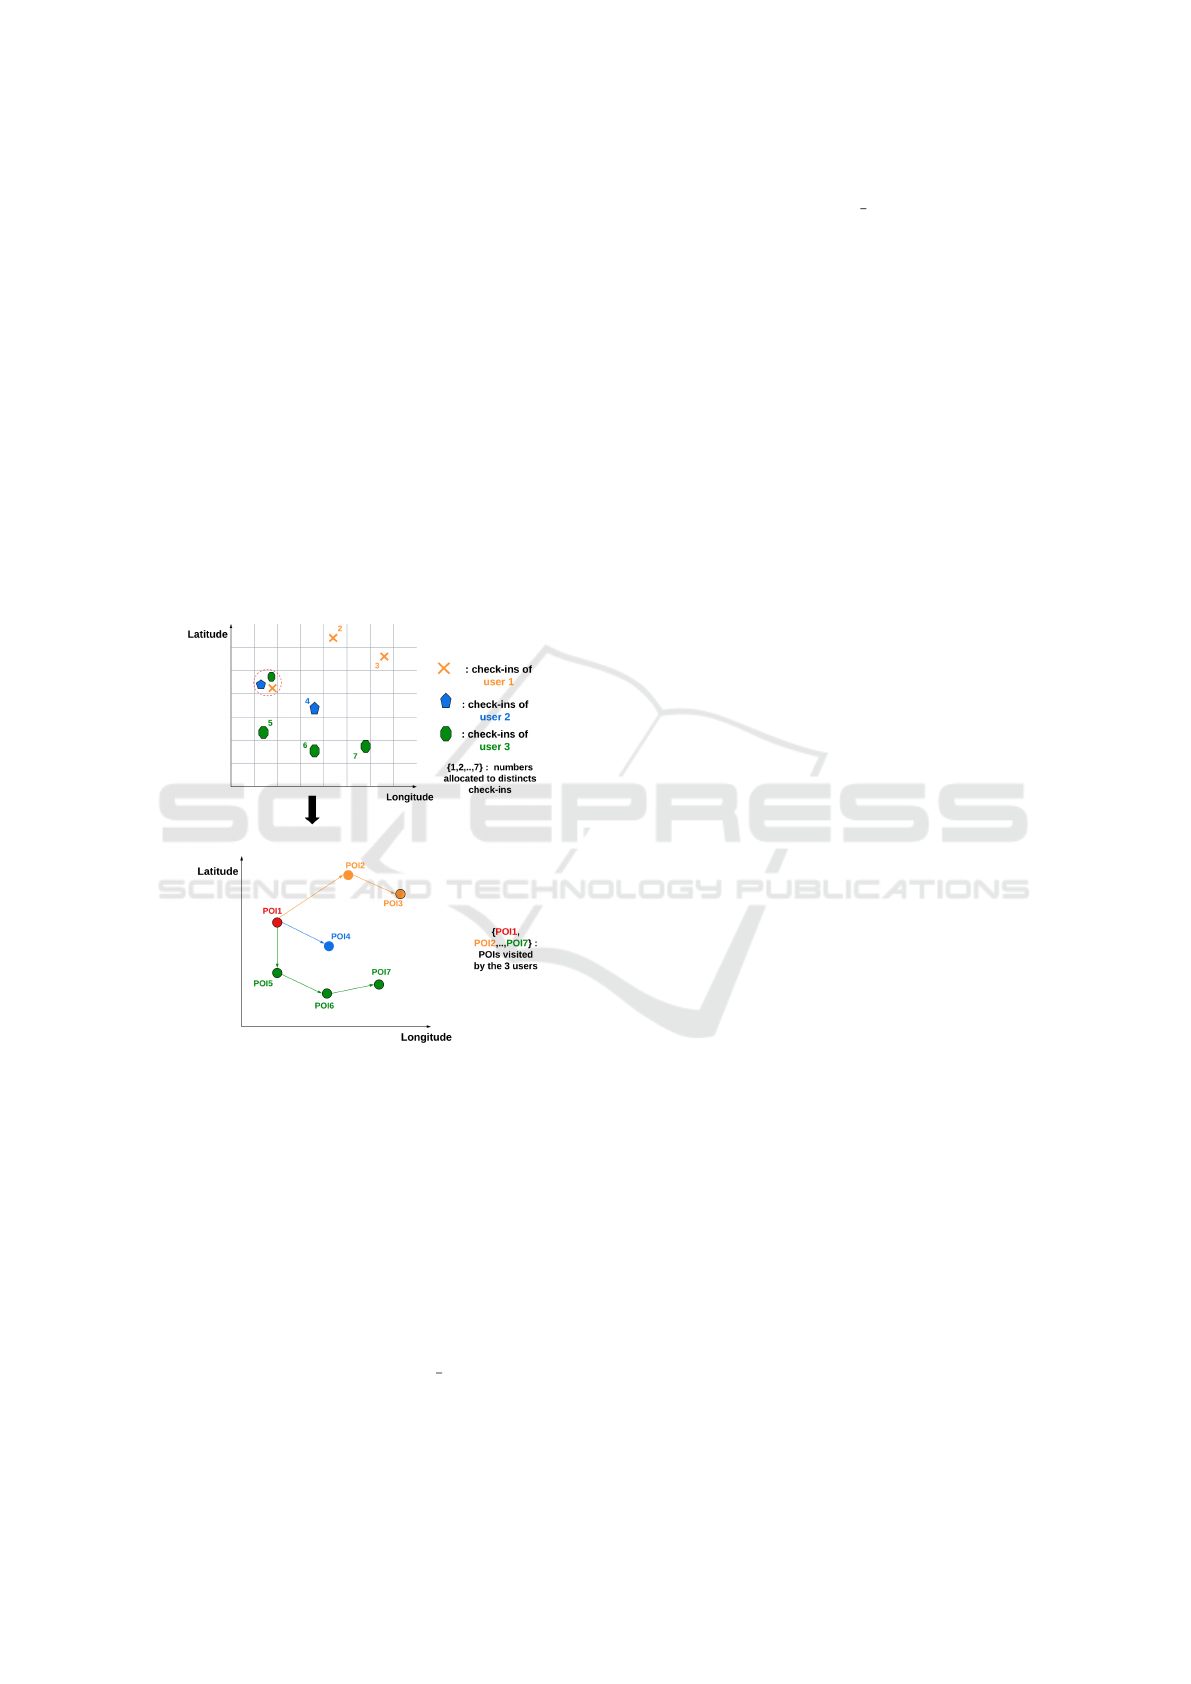
Figure 1: POIs identification from users check-ins.
In Figure 1, we illustrate that problem where three
users share no position (upper subfigure). Merging
three close positions into a single POI allows to con-
struct trajectories that share one POI (lower subfig-
ure).
2.2 Trajectory Similarity and POI
Ranking Problems
The goal of POI recommendation is to suggest POIs
to visit based on social media users’ records and
traces. A trajectory t in the Train Set represents a
sequence of visited POIs (p
1
,·· · , p
n
). Our task is to
recommend the next POI to visit after the last POI p
n
in a given trajectory t. This involves finding a set of
candidate trajectories in Train Set that contain a path
(p
n
, p
r
), and selecting the best POI from among the
possible p
r
points. Our focus is on the first step of
this process, which involves finding similar trajecto-
ries that contain p
n
using a similarity function sim.
We also use a value k for the top k most similar tra-
jectories and a POI ranking function rank to select the
highest rank POI in step 2.
3 RELATED WORKS
Location prediction is a challenge in human mobil-
ity modeling that predicts a user’s location using their
historical traces.
Recently, neural networks have gained attention
due to the success of word embeddings in various
NLP tasks, among them the W2V model described
in (Mikolov et al., 2013).
(Grbovic et al., 2015) proposes an algorithm
called Prod2vec. It generates product embeddings
from purchase sequences and performs recommenda-
tions based on the most similar products in the vector
space obtained using W2V on product sequences.
However, this work targets products recommen-
dation, which is often based on personal preferences
and behavioral data, while POIs recommendation of-
ten involve a deeper understanding of the proposed
trajectories. Moreover, (Grbovic et al., 2015) assumes
that the products are already predefined in the dataset,
so it does not solve our problem.
Among the works based on embeddings extracted
from the Word2Vec model and applied to the rec-
ommendation problem, we also cite (Caselles-Dupr
´
e
et al., 2018). In this article, the authors indicate that
model hyper-parameters are important and have an
effect on recommendation quality. They show that
using different values for certain hyper-parameters,
leads to significantly better performance for recom-
mendation tasks.
(Yang et al., 2022) proposed a global trajectory
flow map and a Graph Enhanced Transformer model
(GETNext) that incorporates the global transition pat-
terns, user’s general preference, spatio-temporal con-
text, and time-aware category embeddings together
into a transformer model to make the prediction of
user’s future moves.
This paper proposes an innovative POI recom-
mendation method which has shown good experi-
mental results in terms of recommendation accuracy.
However, the complexity of the method and the need
for a large amount of trajectory data to train the model
may make its implementation in real-time systems
difficult. Furthermore, it does not provide sufficient
DATA 2023 - 12th International Conference on Data Science, Technology and Applications
248

detail on the selection of the model’s hyperparame-
ters, which may limit the understanding of the impact
of these parameters on the method’s performance.
(Liu et al., 2021) proposed a recommendation
model for the next POI based on a Gated Recurrent
Unit (GRU) neural network (RNN), which uses atten-
tion to learn to weight the representation of each POI
according to its category to improve recommendation
accuracy. However, the lack of detailed explanation
of the model’s design choices, such as the number of
units in the GRU or the number of layers in the neural
network, makes it difficult to reproduce the proposed
model or adapt it to similar problems.
The solution we present in this paper is a trajec-
tory similarity based technique for next POI recom-
mendation. We calculate trajectory similarity using
classical metrics such as MRR and JACCARD, and
adapt them to Word2Vec embeddings, to assess the
benefit of using embeddings over classical methods
for the next POI recommendation. Unlike (Grbovic
et al., 2015), we assume that the POIs aren’t prede-
fined in the dataset, and use meshing technique to
identify them.
We provide recommendations of POIs that may
not be categorised in the same way but share simi-
lar semantic features, unlike (Liu et al., 2021), which
focuses on categorising POIs based on their type and
location.
We also carry out a study of the model hyper-
parameters to prove their importance and impact
on the quality recommendation as mentioned in
(Caselles-Dupr
´
e et al., 2018) but not detailed in (Yang
et al., 2022). This study allows us to position our-
selves with these works.
4 DATA PREPARATION
This study uses the YFCC dataset (Thomee et al.,
2016). We limits the dataset to France using its ge-
ographic boundaries as a bounding box. It is contain-
ing 2,052,004 records and 25 attributes. The choice
to apply our study to France is an arbitrary one, but it
does not affect the validity of the results, as the meth-
ods used are applicable to other countries or regions
of the world. This dataset does not have pre-defined
Points of Interest (POIs), which relies on pre-defined
POIs. User check-ins are used to identify POIs in-
stead, following a process where the space is divided
into a grid mesh with cells of a specific size in meters.
Each check-in is assigned to a cell that contains its
geo position, which is then assigned a unique number
corresponding to a POI. To ensure efficient prediction
and achieve better quality, we aim to find the optimal
grid granularity based on the required data density.
4.1 Effect of Grid Granularity on POIs
Density
We need a dense dataset. To achieve this, we first
test the effect of the grid granularity on the POIs den-
sity, specifically the number of POIs, and the average
number of check-ins per POI based on the grid cell
size expressed in meters, as shown in Table 1.
Table 1: POI density based on grid granularity.
Cell size (m) #POIs avg #check-ins /poi
10 473 296 4
20 404 627 5
50 302 067 7
70 266 331 8
100 231 086 10
150 194 579 11
200 171 592 12
400 123 630 17
500 110 425 19
To have enough information to share for the col-
laborative filtering task we are targeting, we need to
use a large number of check-ins. We therefore choose
a value of 10 check-ins per POI on average.
On Table 1, such density corresponds to a 100m
wide cell. This granularity generates a total number of
231,086 distinct POIs in France. Note that the value
of 100m is also used by (Lim et al., 2017) to map a
photo to a POI. Subsequently, we run all our experi-
ments with a grid granularity value of 100 m.
5 NEXT POI
RECOMMENDATION BASED
ON TRAJECTORY
SIMILARITY
As introduced in Section 2, next POI recommenda-
tion first selects a set of candidate trajectories. Let T
be a set of trajectories and an input trajectory t that
ends with POI p. Let sim : (a, b) 7→ [0,1] be a similar-
ity function for a and b trajectories. S(t, p) is the list
of trajectories in T that contain p and have positive
similarity with t, ordered by decreasing similarity:
S(t, p) = [t
i
| t
i
∈ T, p ∈ t
i
,∀i < j,
sim(t
i
,t) ≥ sim(t
j
,t) > 0]
S
k
contains the top-k highest similar trajectories of S :
Embedding-Enhanced Similarity Metrics for Next POI Recommendation
249

S
k
(t, p) = {t
i
|t
i
∈ S(t, p),i ∈ [1,k]}
Then, each top-k similar trajectory ”votes” for the
next POI based on its similarity with t. Let next(s, p)
be the POI next to p in trajectory s. We assign a score
to each next(s, p) by aggregating the similarities be-
tween t and s:
score(r) =
∑
s∈S
k
, next(s,p)=r
sim(s,t)
The POI r with the highest score is recommended.
In the following, we investigate various similar-
ity functions with and without considering embed-
dings. This allows us to assess the relative benefit of
embedding-based similarity functions applied to the
next POI recommendation.
5.1 Similarity Without Embeddings
The classical similarity metrics that are used in the
solution without embeddings are the following: JAC-
CARD and MRR.
JACCARD Similarity. Given two trajectories a
and b. The JACCARD similarity considers a and b
as sets of POIs, and is defined as the ratio between
the length of the intersection of sets a and b, and the
length of the union of a and b :
jaccard(a,b) =
|a ∩ b|
|a ∪ b|
Note that when computing the similarity between a
candidate trajectory s and a test trajectory t, the last
POI of s is not taken into account because it is a can-
didate POI for the recommendation.
Thus, for JACCARD similarity we have
sim(s,t) = jaccard(s
′
,t) with s
′
being s without
its last POI.
MRR Similarity. The MRR similarity of two tra-
jectories, s and t, is inspired by the Mean Reciprocal
Rank function. It measures the rank of POIs that ap-
pear at a similar position in both s and t. The recip-
rocal rank is the multiplicative inverse of the rank. To
bring the higher score to POIs closer to the last POI
of t, t and s are traversed from the last POI, denoted
t[−1], to the first one. Thus, t[−i] denotes the i
th
POI
of t in reverse order. MRR similarity is defined by:
MRR(s,t) =
L
∑
i=1
1
i
R
i
(s,t) with
L = min(|t|,|s|)
R
i
(s,t) =
1 if t[−i] = s[−i]
0 else
5.2 Embedding Based Similarity
In this section, we have adapted the MRR and JAC-
CARD functions to support embeddings. To this end,
we train the Word2Vec model on user trajectories,
which exploits local context co-occurrence (neigh-
bor words). By associating a dense vector with
each word, Word2Vec captures context and identifies
words (i.e., POIs) that share similar contexts if their
numerical vectors are close.
Then, we apply the next POI prediction algorithm,
based on the MRR cosine and JACCARD cosine sim-
ilarity metrics defined below.
JACCARD Cosine Similarity. As described in al-
gorithm 1. The goal is to find for every POI in test
trajectory t, the most similar POI in a train trajectory
s. The similarity between the two POIs is the cosine
of the corresponding vectors. Finally, the similarity
is the sum of all maximum similarities obtained for
every POI of t.
Algorithm 1: JACCARD cosine similarity function.
Require: s : train tr a j,t : test tra j,model
1: function JACCARDCOS SIMILARITY(s,t)
2: j ← 0
3: for p
1
∈ t do
4: v
1
← model.vector(p
1
)
5: m ← 0
6: for p
2
∈ s do
7: v
2
← model.vector(p
2
)
8: sim ← (v
1
· v
2
)/(||v
1
|| ∗ ||v
2
||)
9: m ← max(m,sim)
10: end for
11: j += m
12: end for
13: return j
14: end function
MRR Cosine Similarity. The goal is to compare
each POI of a test trajectory with every POI of a
candidate trajectory based on the cosine similarity of
their corresponding vectors. The matching score is
then the rank of the POI multiplied by the similarity
which captures a matching weight. In Algorithm 2 we
detail the MRR cosine similarity algorithm.
We provide readers with the code used for the so-
lution’s implementation which is available on
1
1
https://github.com/JarradSara/nextPOI-reco
DATA 2023 - 12th International Conference on Data Science, Technology and Applications
250

Algorithm 2: MRR cosine similarity function.
Require: s : train tr a j,t : test tra j,model
1: function MRRCOS SIMILARITY(s,t)
2: j ← 0
3: L ← min(length(s),length(t))
4: for i ∈ [1,L] do
5: v
1
← model.vector(t[-i])
6: m ← 0
7: for p
2
∈ s do
8: v
2
← model.vector(p
2
)
9: sim ← (v
1
· v
2
)/(||v
1
|| ∗ ||v
2
||)
10: m ← max(m,sim)
11: end for
12: j += m / i
13: end for
14: return j
15: end function
6 EXPERIMENTAL VALIDATION
6.1 Methodology
6.1.1 Train/Test Data
Test set Te and train set Tr are defined as follows :
• For each couple of POIs (p
n
, p
r
), we gather all the
trajectories that end with (p
n
, p
r
). Then, we add
the most recent one to Te.
• We suppose that T represents all the trajectories
in the dataset. The train set Tr = T \ Te.
6.1.2 Baseline Algorithm
We compared our solution to a recommendation
method that uses a global transition matrix. To create
this matrix, we analyzed all pairs of successive points
of interest (POIs) visited in the training set and cal-
culated the frequency of transition between each pair.
When a user visits a POI, this method recommends
the POI with the highest frequency of transition from
the visited POI.
By using this baseline, we obtain a prediction
quality of 25.7% .
6.1.3 Experimental Methodology Followed
For our experiments, we use the dataset mentioned in
section 4 limited to France, which is in tabular format
with 25 attributes, and contains 231,086 unique POIs,
obtained by applying a mesh size of 100m.
The recommendation process shown in Figure 2
involves three steps: First, a Word2Vec model is
trained to generate embeddings for each POI from in-
put trajectories, which are then used in JACCARD co-
sine and MRR cosine metrics. Second, the prediction
algorithm from Section 5 is applied for the next POI
prediction. Third, the prediction quality is computed
using test trajectories. This is the ratio of correct pre-
dictions to the total number of test trajectories. Four
parameters affect the prediction quality: the similar-
ity function used, the number of similar trajectories
(k ∈ [1,50]), the dimension of the W2V embeddings
(vector size ∈ [2, 50]), and the number of learning it-
erations (epochs ∈ [5,100]). For a given combination
of these parameters, the relative benefit of using em-
beddings is calculated as:
Benefit = (
quality using embeddings
quality without using embeddings)
− 1).
6.2 Results and Discussion
Following the experimental protocol described in sec-
tion 6.1.3, our goal is to determine the optimal com-
bination of similarity metric, number of k-nearest
neighbors, and model hyperparameters that yield the
highest quality of recommendation. We first provide
a brief summary of the numerical values obtained for
the maximum qualities and benefits, along with the
optimal combinations to obtain them. We then pro-
vide detailed results for each experiment, varying the
mentioned parameters.
Using the JACCARD cosine in Table 2, we
achieve a maximum benefit of 11.9% compared to
the JACCARD classic method, with corresponding
qualities of 33.37% and 29.8% respectively (a dif-
ference of 3.57). The optimal combination of values
that yields this benefit is k=15, dimension=12, and
epoch=100.
Table 2: Max quality obtained with JACCARD metrics.
jaccard cosine jaccard Quality gap benefit
33.37% 29.8% 3.57 11.9%
As for the MRR/MRR cosine method in Table 3,
the embedding-based MRR cosine method yields a
maximum benefit of 7.4% compared to the non-
embedding MRR method, with corresponding qual-
ities of 33.08% and 30.8% , respectively (a differ-
ence of 2.28). The optimal combination of values
that yields this benefit is k=20, dimension=30, and
epoch=100.
Table 3: Max quality obtained with MRR metrics.
mrr cosine mrr Quality gap benefit
33.08% 30.8% 2.28 7.4%
Embedding-Enhanced Similarity Metrics for Next POI Recommendation
251
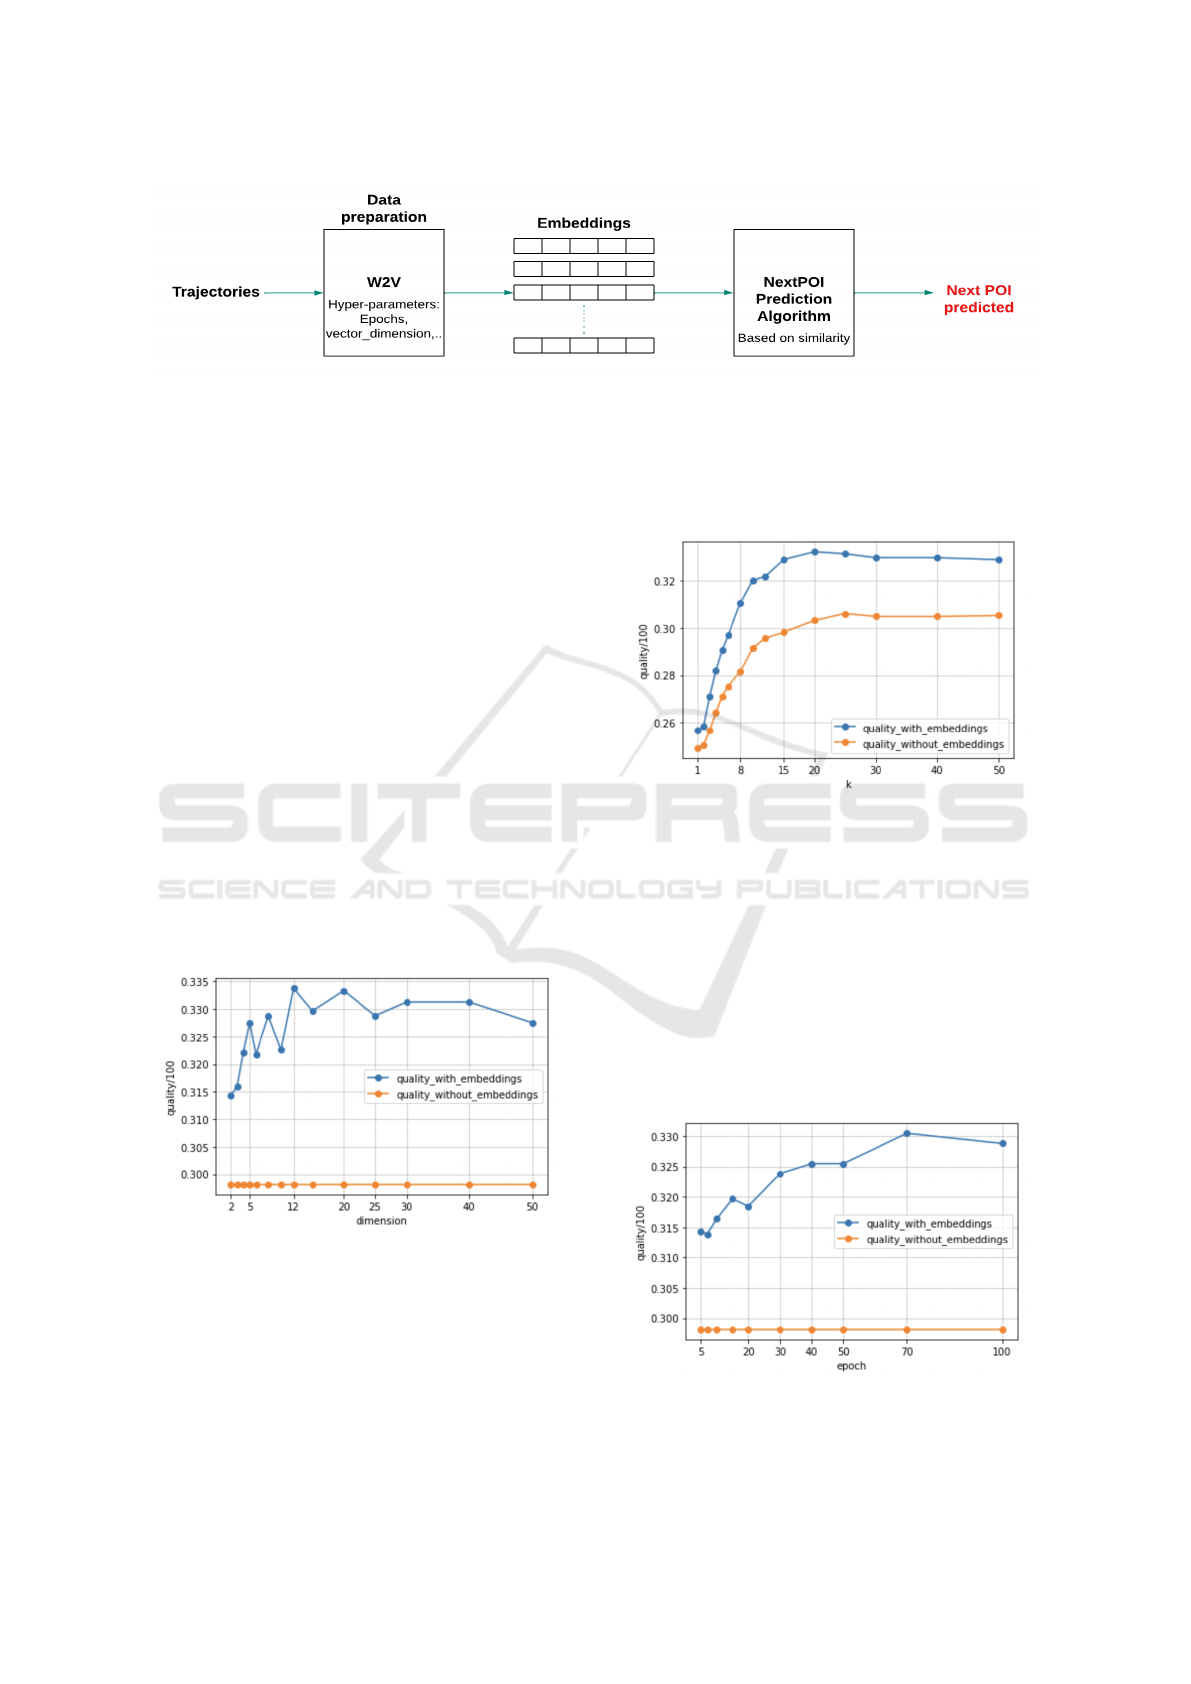
Figure 2: Functional architecture of the proposed solution.
The total execution time of all experiments (com-
putation of methods with/ without embeddings) is
∼20 minutes. The value of time execution was much
higher (∼2 hours) and which we were able to opti-
mise thanks to the distributed computation on Spark.
Details of all experiments are given below, in which
we compare the methods with and without embedding
according to different parameters.
6.2.1 JACCARD vs. JACCARD Cosine
We plot quality for embedding-based and non-
embedding-based JACCARD metric with different
values of k, epochs, and dimensions, and visualize
the results. The fixed values for each experiment
were chosen based on the optimal combinations that
achieved the highest quality of prediction and benefit.
Quality with Fixed K and Epochs, and Variable
Vector Dimensions Value. This experiment (Fig-
ure 3) concerns the qualities of JACCARD and JAC-
CARD cosine functions. We keep the value of k and
epochs fixed at 15 and 100 respectively, and vary the
dimension of the Word2Vec model.
Figure 3: Quality of JACCARD/JACCARD cosine metrics
by dimension value.
Figure 3 shows that the quality obtained using
JACCARD (orange data points) is 29.8%, while us-
ing JACCARD cosine represented by the blue data
points, reach a quality of 33.37%, generating a ben-
efit of 11.9% by using embeddings.
Quality with Fixed Dimension and Epochs, and
Variable K Value. For this experiment (Figure 4),
we keep the model dimension and epochs fixed at 25
and 100 respectively. We then test the variation of the
values of k.
Figure 4: Quality of JACCARD/JACCARD cosine metrics
by k value.
Figure 4, shows that JACCARD, reach a quality
of 30.31%, whereas using JACCARD cosine, we ob-
tain a quality of 33.2%, generating a benefit of 9.56%
using embedding.
Quality with Fixed Dimension and K, and Variable
Epoch Value. In the experiment shown in Figure 5,
we keep the dimension of the model and the value of
k fixed at 25 and 20 respectively. We then test the
variation of the epoch values.
Figure 5: Quality of JACCARD/JACCARD cosine metrics
by epoch value.
DATA 2023 - 12th International Conference on Data Science, Technology and Applications
252

Figure 5 shows that the quality obtained with JAC-
CARD is 29.81%, while using JACCARD cosine, we
manage to reach a quality of 33.04%, generating a
benefit of 10.83% by using embeddings.
6.2.2 MRR vs. MRR Cosine
Quality with Fixed K and Epochs, and Variable
Dimension Values. For this experiment (Figure 6),
we use the MRR and MRR cosine, keeping the val-
ues of k and epoch fixed at 20 and 100, respectively.
We test the variation of the dimension values of the
model.
Figure 6: Quality of MRR/MRR cosine metrics by dimen-
sion value.
Based on Figure 6, the MRR achieves a quality of
30.8%. On the other hand, when using MRR cosine,
we obtain a quality of 33.08%. We note that the ben-
efit generated by the use of embeddings is 7.4%.
Quality with Fixed Dimension and Epochs, and
Variable K Value. This experiment (Figure 7) con-
cern using the MRR and MRR cosine models, by
keeping the model dimension and epochs fixed at 25
and 100 respectively, and vary k parameter.
Figure 7: Quality of MRR/MRR cosine metrics by k value.
In Figure 7, the quality obtained by MRR reaches
a maximum value of 30.9% for k > 15, whereas by
using MRR cosine we obtain a maximal quality of
32.2% for k = 20, which achieves a maximal benefit
of 4.14% by using the embeddings. This also con-
firms that k, the number of neighbors, affects the qual-
ity of the results: taking into account up to 20 neigh-
bors tends to improve the recommendation quality.
Moreover, since the average number of similar
neighboring trajectories in the whole dataset is 37,
we can conclude that the optimal k parameter is about
twice lower than the average number of neighbors for
both methods with and without embeddings. Indeed,
it confirms that considering as many neighbors as pos-
sible is not optimal.
Quality with Fixed Dimension and K, and Vari-
able Epoch Value. The experiment visualized in
Figure 8 concerns keeping the dimension of the model
and the value of k fixed at 25 and 20 respectively, and
varying epoch values.
Figure 8: Quality of MRR/MRR cosine metrics by epoch
value.
In Figure 8, the quality obtained with MRR is
30.8%, while using the MRR cosine reach a quality of
32.75%, thus obtaining a benefit of 6.03% with em-
beddings. We note that the data points representing
the MRR without embeddings are constant because k
is fixed.
6.2.3 Effect of Mesh Configuration on
Recommendation Quality
We vary the value of the grid cell size in the inter-
val [10,500] meters, and we compare the recommen-
dation quality with/without the use of embeddings
for all combinations of the following parameters: k
∈ [1,50], dimension ∈ [2,50], and epoch ∈ [5,100].
In Figure 9, we plot, for each grid cell size value, the
best quality obtained with embeddings and without
embedding.
As we can see, the best quality obtained with the
embeddings is equal to 67%, corresponding to a 10m
grid cell size. The quality without embeddings (in or-
ange) is 64%. For a cell size of 100m, we obtain the
Embedding-Enhanced Similarity Metrics for Next POI Recommendation
253

Figure 9: Quality of prediction according to grid cell size.
result seen in the previous sections, corresponding to
33% with the embeddings. On the other hand, for
larger grid cells, the quality drops to 27% for 500m.
We can conclude that the quality increase as the cell
size decreases, and that the methods with embeddings
are always performing better than the methods with-
out embeddings.
Using a grid cell size smaller than 100m results in
a better prediction quality of up to 67% for 10m wide
cells. However, with such small cell sizes, the dataset
is not dense enough in terms of the number of check-
ins per POI, and thus it does not meet the requirement
stated in section 4.1.
7 CONCLUSION
This paper demonstrates the effectiveness of using
embeddings with the Word2Vec model for the next
POI recommendation, highlighting that embeddings
provide a better recommendation quality than classi-
cal methods. Our contributions are :
• The POI identification to handle check-in records
without POI information.
• The extention of JACCARD and MRR metrics
to embeddings, validating the benefits of embed-
dings in terms of recommendation quality.
• The analysis of parameters that influence recom-
mendation quality.
Results show that embedding-based methods out-
perform classical methods for next POI prediction.
However, the study also notes some limitations of the
JACCARD and MRR metrics. The JACCARD metric
doesn’t consider the order in which POIs are visited
in trajectories, while MRR can be imprecise due to its
sequential nature, which takes into account the visit
order. To overcome these limitations, future work will
define other metrics that better address the problem
of similarity/distance between trajectories to achieve
better prediction accuracy.
In this study, we consider trajectories whith POIs
visited in a given order. However, this approach is not
always relevant. For example, tourists may visit sev-
eral museums in no particular order. This limitation
can affect the similarity measures between trajecto-
ries, which in turn affects the quality of the predic-
tion. An alternative approach that does not take into
account the order in the trajectory could strengthen
the validity and relevance of this study.
REFERENCES
Caselles-Dupr
´
e, H., Lesaint, F., and Royo-Letelier, J.
(2018). Word2vec applied to recommendation: Hy-
perparameters matter. arXiv.
Grbovic, M., Radosavljevic, V., Djuric, N., Bhamidipati,
N., Savla, J., Bhagwan, V., and Sharp, D. (2015). E-
commerce in your inbox: Product recommendations
at scale. In Cao, L., Zhang, C., Joachims, T., Webb,
G. I., Margineantu, D. D., and Williams, G., edi-
tors, Proceedings of the 21th ACM SIGKDD Interna-
tional Conference on Knowledge Discovery and Data
Mining, Sydney, NSW, Australia, August 10-13, 2015,
pages 1809–1818. ACM.
Lim, K. H., Chan, J., Karunasekera, S., and Leckie, C.
(2017). Personalized itinerary recommendation with
queuing time awareness. In Kando, N., Sakai, T.,
Joho, H., Li, H., de Vries, A. P., and White, R. W.,
editors, Proceedings of the 40th International ACM
SIGIR Conference on Research and Development in
Information Retrieval, Shinjuku, Tokyo, Japan, August
7-11, 2017, pages 325–334. ACM.
Liu, Y., Pei, A., Wang, F., Yang, Y., Zhang, X., Wang, H.,
Dai, H., Qi, L., and Ma, R. (2021). An attention-based
category-aware GRU model for the next POI recom-
mendation. Int. J. Intell. Syst., 36(7):3174–3189.
Mikolov, T., Chen, K., Corrado, G., and Dean, J. (2013).
Efficient estimation of word representations in vector
space. In Bengio, Y. and LeCun, Y., editors, 1st In-
ternational Conference on Learning Representations,
ICLR 2013, Scottsdale, Arizona, USA, May 2-4, 2013,
Workshop Track Proceedings.
Thomee, B., Shamma, D. A., Friedland, G., Elizalde, B.,
Ni, K., Poland, D., Borth, D., and Li, L. (2016).
YFCC100M: the new data in multimedia research.
Commununications of the ACM, 59(2):64–73.
Yang, S., Liu, J., and Zhao, K. (2022). Getnext: Trajectory
flow map enhanced transformer for next POI recom-
mendation. In Amig
´
o, E., Castells, P., Gonzalo, J.,
Carterette, B., Culpepper, J. S., and Kazai, G., editors,
SIGIR ’22: The 45th International ACM SIGIR Con-
ference on Research and Development in Information
Retrieval, Madrid, Spain, July 11 - 15, 2022, pages
1144–1153. ACM.
DATA 2023 - 12th International Conference on Data Science, Technology and Applications
254
