Astronomical Images Quality Assessment with Automated Machine
Learning
Olivier Parisot, Pierrick Bruneau and Patrik Hitzelberger
Luxembourg Institute of Science and Technology (LIST), 5 Avenue des Hauts-Fourneaux,
4362 Esch-sur-Alzette, Luxembourg
Keywords:
Astronomical Images, Image Quality Assessment, Automated Machine Learning.
Abstract:
Electronically Assisted Astronomy consists in capturing deep sky images with a digital camera coupled to
a telescope to display views of celestial objects that would have been invisible through direct observation.
This practice generates a large quantity of data, which may then be enhanced with dedicated image editing
software after observation sessions. In this study, we show how Image Quality Assessment can be useful
for automatically rating astronomical images, and we also develop a dedicated model by using Automated
Machine Learning.
1 INTRODUCTION
Nowadays, Electronically Assisted Astronomy
(EAA) is widely applied by astronomers to observe
deep sky objects (nebulae, galaxies, star clusters). By
capturing raw images directly from a digital camera
coupled to a telescope and applying lightweight
image processing (fast alignment and stacking), this
approach allows to generate enhanced views of deep
sky targets that can be displayed in near real time on
a screen (laptop, tablet, smartphone) (Figure 1).
EAA also enables observing faint deep sky tar-
gets in difficult outdoor conditions, for example in
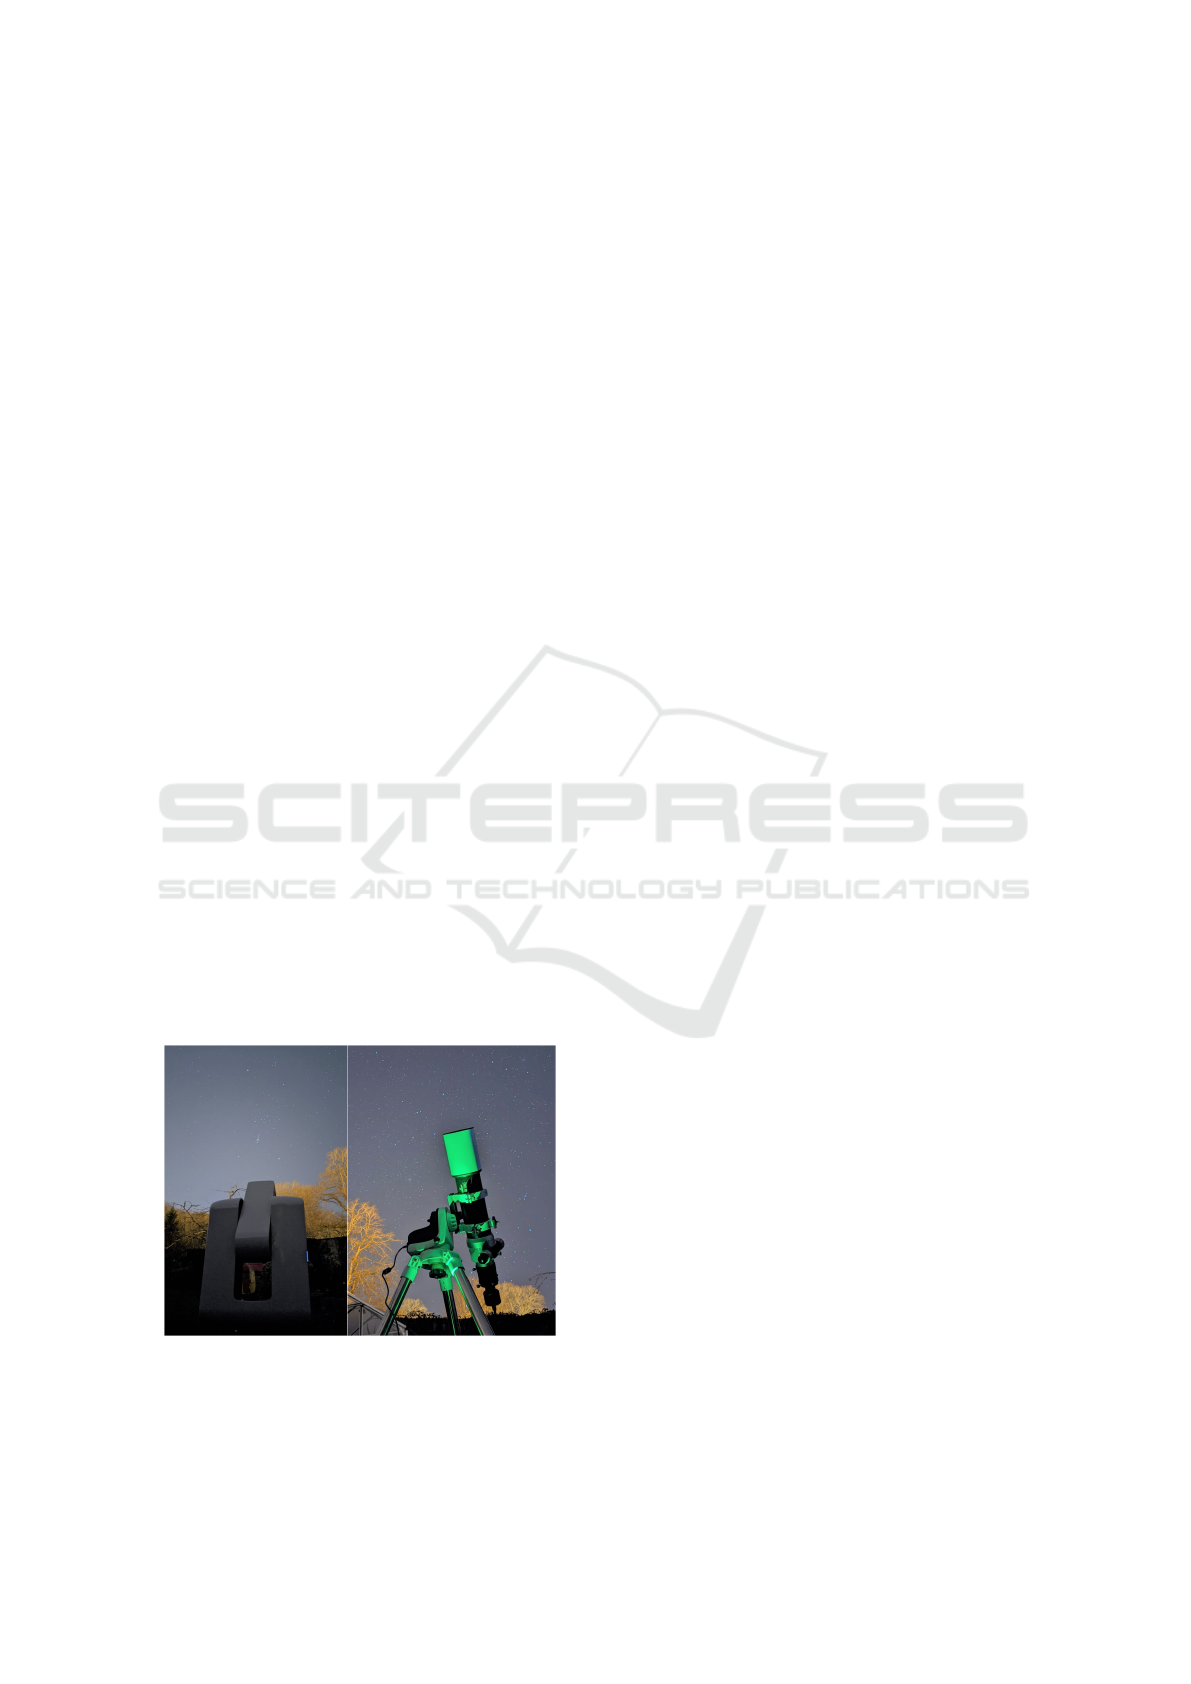
Figure 1: EAA setups used to capture data. The first one is a
Stellina automated station, the second one is a 72/420 apoc-
hromatic refractor complemented by a low-end SVBONY
SV305 digital camera – connected to a laptop and driven by
a dedicated software.
geographical zones heavily impacted by light pollu-
tion or during a night with Moon (it considerably af-
fects the sky background, often making it difficult
the observations). Celestial objects like nebulae and
galaxies are almost invisible through direct observa-
tion in an urban or suburban night sky; with EAA
they become impressive and detailed (Parisot et al.,
2022). In practice, hundreds of targets can be imaged
– they are listed in well-known astronomical catalogs
(Messier, New General Catalog (NGC), Index catalog
(IC), Sharpless, Barnard) and described many books
and software (Zack et al., 2018).
Thus, a large quantity of images are handled by as-
tronomers during such EAA sessions: the targets are
numerous, the observation conditions variable, which
means that each image is different. Quality may de-
pend on many parameters (Redfern, 2020), among
them:
• Instrument: aperture and focal ratio, optical qual-
ity, digital camera sensitivity and read noise,
tracking mount precision.
• Setup installation: balance and stability of tripod,
focusing, collimation.
• Seeing conditions: light pollution weather
(clouds, fog, wind), moon phase, steadiness and
transparency of the atmosphere.
Some of these conditions may vary during the same
night, meaning that acquired data may have very het-
erogeneous quality levels.
During night capture sessions, it is possible to vi-
Parisot, O., Bruneau, P. and Hitzelberger, P.
Astronomical Images Quality Assessment with Automated Machine Learning.
DOI: 10.5220/0012073800003541
In Proceedings of the 12th International Conference on Data Science, Technology and Applications (DATA 2023), pages 279-286
ISBN: 978-989-758-664-4; ISSN: 2184-285X
Copyright
c
2023 by SCITEPRESS – Science and Technology Publications, Lda. Under CC license (CC BY-NC-ND 4.0)
279

sualize on live the target by doing a lightweight pro-
cessing: on-the-fly raw frames alignment and stack-
ing, then quick cosmetic processing (in general, his-
togram stretching). This type of on-the-fly processing
is performed by software such as SharpCap
1
At the
beginning, the stacked image is very noisy, then with
the accumulation of raw images, this image will be-
come more qualitative.
After night capture sessions (generally days after),
raw images are then heavily post-processed in dedi-
cated editing / post-processing tools, allowing to mit-
igate most of the issues (noise, aberrations removal,
blur) and to enhance the signal (contrast stretch-
ing, color correction) (Bracken, 2017; Adake, 2022).
The calibration images play an important role in this
phase. However, all these tools are very complex, and
only very experienced users can really estimate the
quality of the final processed images and thus improve
it in a relevant way.
In this paper, we propose to combine Image
Quality Assessment (IQA) and Automated Machine
Learning (AutoML) to automatically rate astronomi-
cal RGB images: it aims at guiding EAA sessions and
then images post-processing.
The rest of this article is organized as follows.
Firstly, related works are described (Section 2). Then,
an approach with dataset preparation, model training
and a prototype are detailed (Section 3). Finally, pre-
liminary results on astronomical images are presented
(Section 4) and discussed (Section 5). We conclude
by opening some perspectives (Section 6).
2 RELATED WORKS
2.1 IQA
Quality of astronomical images is traditionally esti-
mated through two methods:
• Signal-to-noise ratio (SNR): ratio of the strength
of the astronomical signal to the level of the noise
in an image. A higher SNR indicates that the im-
age is of higher quality.
• Full Width at Half Maximum (FWHM): sharpness
of the point sources in an image, such as stars.
A smaller FWHM indicates that the image is of
higher quality.
An other popular measure is the highest magni-
tude of the faintest star/object visible in the image:
it needs precise astrometry to do the comparison be-
tween the image and the known deep sky objects
1
https://www.sharpcap.co.uk.
and stars present in celestial catalogues (Hogg et al.,
2008).
Recently, numerous IQA generic approaches were
developed (Zhai and Min, 2020). In this paper, we fo-
cus on No-reference (NR) and Blind methods to rate
single RGB images; among them we can list:
• BRISQUE, efficient on natural scenes: a score be-
tween 0 (good quality) and 100 (poor quality) is
computed (Mittal et al., 2012). It works well to
filter really bad images by using a fixed threshold
(i.e. 70).
• Deep Learning methods like NIMA (Neural Im-
age Assessment): technical and aesthetic scores
between 0 (bad) and 10 (good) (Talebi and Milan-
far, 2018). In practice, this score is not efficient
on low-light images (Parisot and Tamisier, 2022).
• Deep CNN-Based Blind Image Quality Predictor
(DIQA) methodology: two models provide scores
between 0 (bad) and 10 (good) (Kim et al., 2019).
Naively, these generic methods may be used to
filter very bad astronomical images by using a value
threshold, but it is not efficient in practice. Let’s take
the example of two different images of the M17 neb-
ulae (Parisot et al., 2023) analyzed with two Python
tools ( image-quality package
2
and NIMA tensor-
flow model
3
). In this typical case, the BRISQUE and
NIMA evaluations are slightly better for the first im-
age. However, the second image has a better overall
quality, especially regarding contrast, luminance and
noise.
Figure 2: First image of M17 (aka Omega Nebula) -
BRISQUE score is 28.25 and NIMA score is 4.52. The im-
age lacks contrast, the stars are mixed with noise and the
nebulosity is not visible.
We can note that a recent IQA method based on
clustering was proposed to deal with ground-based as-
tronomical images captured by professional surveys
(Teimoorinia et al., 2020).
2
https://pypi.org/project/image-quality/
3
https://tinyurl.com/idealo-iqa
DATA 2023 - 12th International Conference on Data Science, Technology and Applications
280

Figure 3: Second image of M17 - BRISQUE score is 28.28
and NIMA score is 4.17. The contrast is good, stars and
nebulosity are clearly distinct from noise.
2.2 AutoML
AutoML consists in generating and deploying Ma-
chine Learning models from an input dataset with lit-
tle or no configuration and coding effort (Hutter et al.,
2019). The growing application of Machine Learning
in a wide range of fields has led to the design of frame-
works facilitating the production of readily actionable
models. Let us consider the traditional pipeline for
traditional Machine Learning tasks:
• Data preprocessing is required to adjust raw data
to the specificity of Machine Learning algorithms
(Zelaya, 2019): cleansing, feature selection, sam-
pling, transformation, etc.
• A Machine Learning model architecture is se-
lected and then trained by using the prepared data
(Raschka, 2018).
• Depending on the algorithm, some hyper-
parameters have to be optimized to improve the
accuracy of the model; in general, this is real-
ized through heuristics requiring heavy computa-
tion (Feurer and Hutter, 2019).
• Model accuracy is evaluated by computing stan-
dard statistical tests (AUC, Precision, Recall, F1,
etc.) with a given strategy (holdout or cross-
validation).
In practice, all those steps are time-consuming and ex-
posed to methodological errors. AutoML platforms
aim at systematizing the whole process in order to
launch it a number of times with various combina-
tions: numerous pipelines are tested, the obtained
models are evaluated and the most accurate one is fi-
nally selected (Raschka, 2018).
3 APPROACH
Our approach consists in providing an image regres-
sor model to rate the quality of RGB astronomical im-
ages obtained during EAA sessions. The model aims
at taking into account the following criteria: contrast/-
luminance, noise and sharpness. To this end, we have
designed a set of images associated to a defined rat-
ing, and the task consists in training a model to fit
with this score definition. AutoML allows to test au-
tomatically a multitude of combinations – leading to
models with various characteristics: sizes (i.e. param-
eters count and feature map size, etc.) and accura-
cies. Then, these models are tested through a process
based on specific data augmentation process, in order
to select the most robust model (test-time augmenta-
tion (Shorten and Khoshgoftaar, 2019)).
3.1 Data Preparation
We have built a dataset with deep sky images and an
associated rate (between 0 and 10, from bad to good),
in a similar way to what is done in the DIQA method-
ology (Kim et al., 2019).
As original sources, we have used:
• Galaxy10 DECals Dataset containing 17736
256x256 pixels RGB galaxy images (Leung and
Bovy, 2018).
• Nebula Dataset containing 1657 high-resolution
images extracted from Wikimedia commons
(Ravi, 2020).
Then, we have prepared a set of ideal images, ob-
tained after a long manual treatment of initial images
with different editing software that are efficient to im-
prove astronomical images: Siril, TopazLabs (Red-
fern, 2020). For each ideal image, a rating of 10
was assigned. We have produced a set of transformed
images by applying random degradations to modify
noise level (adding Gaussian & Poisson noise), sharp-
ness (blurring, deforming stars) and luminance/con-
trast (adding background level and gradient, reducing
signal, degrading color saturation).
Each transformed image is then rated using a
value between 0 (bad quality) an 10 (good quality)
. To determine a value, we have evaluated the impacts
of distortions on contrast/luminance, noise and sharp-
ness – by comparing the transformed image with the
ideal image.
• Contrast/luminance: we used Structural Similar-
ity Index Measure (SSIM) because it is efficient
to compare difference of contrast and luminance
(Aliakhmet and James, 2019): 1 is given to a per-
fectly similar image and 0 indicates no similarity.
Astronomical Images Quality Assessment with Automated Machine Learning
281

• Noise: we used the normalized Noise Variance
difference between the ideal and the transformed
image. Noise Variance is estimated through the
Fast Estimation method.
• Sharpness: we used the normalized FWHM dif-
ference between the ideal and the transformed im-
age. FWHM is estimated through an heuristic
based on stars detection
4
.
We have defined the final rating associated to the
transformed image as:
10 ∗ (r
con
− max(r
noi
, A) − max(r
sha
, B)
This formula ensures that each starting criterion is
taken into account in the rating – the interest being
to have an index to compare the images as a whole,
whatever the defect. The value A and B acts as maxi-
mum malus associated to noise and lack of sharpness
– in practice we have empirically used 4 as value for
this two constants.
Thus, the constructed dataset contains several
thousands of images of different qualities and associ-
ated ratings, for instance: good (Figure 4), medium-
quality (Figure 5), very bad (Figure 6).
The image resolution (256x256) is a good com-
promise because it corresponds to a standard amount
of data for recent Deep Learning model architectures.
Figure 4: A good-quality 256x256 RGB image of Helix
Nebula (NGC7293) – rating: 9. The contrast is good, the
noise level is low.
In the next section, we show how this dataset is
then used to train a IQA model able to rate astronom-
ical RGB images.
3.2 Training
To run AutoML, a Python prototype was imple-
mented. Image processing is realized with well-
known open-source packages like openCV
5
and
scikit-images
6
.
4
https://tinyurl.com/starsfinder
5
https://pypi.org/project/opencv-python/
6
https://pypi.org/project/scikit-image/
Figure 5: A 256x256 RGB image with moderated quality of
the Andromeda galaxy (M31) – rating: 6. Slight noise and
blur have been added to degrade the original image.
Figure 6: A poor-quality 256x256 RGB image of Orion
Nebula (M42) in the built dataset – rating: 2. Background
noise and strong motion blur have been added to degrade
the original image.
We have used AutoKeras – an open source Python
package based on Bayesian optimization (Jin et al.,
2023). AutoKeras aims at building and fine-tuning
Machine Learning and Deep Learning models by only
defining inputs and expected outputs. Other AutoML
solutions exist (like TPOT (Olson and Moore, 2016)),
but AutoKeras provides a native support for Image
Regression models.
Behind the scenes, AutoKeras generates and
launches numerous predefined training pipelines on-
the-fly (model architecture selection, preprocessing,
hyper-parameters setting, training, model evaluation
and comparison). it will notably check if normal-
ization step of the input data will allow to obtain a
better model. It will also test a whole list of hyper-
parameters such as drop-our rate, activation func-
tion (ex: Relu, Sigmoid), optimization algorithm (ex:
ADAM, RMSprop), learning rate, etc. AutoKeras
does not work randomly to find the best configuration:
it tests a number of pre-defined pipelines, then refines
the best configuration by making small mutations (as
an evolutionary algorithm would do) (Jin et al., 2023).
Step by step, the pipeline producing the best model is
thus refined up to a user-defined limit (i.e. number of
trials).
DATA 2023 - 12th International Conference on Data Science, Technology and Applications
282

The computations were executed on a computing
infrastructure with the following hardware capabili-
ties: 40 cores and 128 GB RAM (Intel(R) Xeon(R)
Silver 4210 CPU @ 2.20GHz) and NVIDIA Tesla
V100-PCIE-32GB. CUDA
7
and NUMBA
8
frame-
works have been used in background to optimize the
hardware usage during images treatment(CPUs and
GPUs).
After numerous experiments, we have run thou-
sands of different pipelines by combining variations
of data preprocessing, optimizers usage, different
hyper-parameters values (Figure 7).
Figure 7: Console dashboard of AutoKeras during the ex-
ecutions of numerous training pipelines. It is thus possible
to monitor the execution of the pipelines and to see which
is the best model at time t.
Two models were shown to be worthy of interest
after all the calculations:
• The best one leds to a model embedding a
ResNet50 model (He et al., 2016), with 23
millions trainable parameters and 53 120 non-
trainable parameters – obtained with a ADAM op-
timizer (learning rate of 0.01). Its accuracy is 1.19
(Mean Squared Error, MSE) on the test dataset.
The R squared value is 0.4 – which is rather sat-
isfying because we have here a regression on im-
ages.
• The smaller model is based on EfficientNetB1
with 6.589.337 parameters (Tan and Le, 2019) –
obtained with a ADAM optimizer (learning rate of
0.00001). The model accuracy was worse (MSE
1.25).
To observe the robustness of these two trained
models on realistic data, we tested them on a aug-
mented test dataset – on images having additional dis-
tortions – not present in the training set.
7
https://developer.nvidia.com/cuda-zone
8
http://numba.pydata.org
Table 1: Rating obtained with the best ResNet50 IQA
model on a augmented test dataset built from 500 different
256x256 RGB images. The (mean, standard deviation, min-
imum, maximum) outputs of the model are given for each
images set.
ResNet50 ratings
mean std min max
No distortion 9.2 0.6 3.6 10
Distortion 3.6 0.9 1.1 6.9
Strong distortion 0.7 0.6 0 3.6
3.3 Model Selection on an Augmented
Test Set
To obtain an additional large and realistic test dataset,
we wrote several Python scripts for realistic image
augmentation, i.e. to reproduce defects that are fre-
quently found in astronomical images. For example,
we have added different types of noises (Gaussian,
Poisson, Salt and Pepper), we have merged the real
signal with a realistic sky background (Bradley et al.,
2016). We also have blurred images in a sophisticated
way by using image augmentation techniques based
on Deep Learning – especially for motion blur (Jung,
2019). In a similar way, we generated starless ver-
sions of the images, in order to test the robustness of
the model – this was realized with a dedicated Deep
Learning model
9
.
Both models are globally able to reproduce the de-
fined rating – to make an estimation between images
with and without defects. However the IQA model
based on ResNet50 provides much better results, es-
pecially on the ratings of very good or very bad im-
ages (around 0 or around 10).
Figure 8: Regression plot of expected (x axis) and com-
puted ResNet50 IQA ratings (y axis) obtained on a part of
the augmented dataset (i.e. 100 images).
Certainly, there are more powerful classification
architectures than ResNet50 and EfficientNet. Never-
9
https://www.starnetastro.com
Astronomical Images Quality Assessment with Automated Machine Learning
283
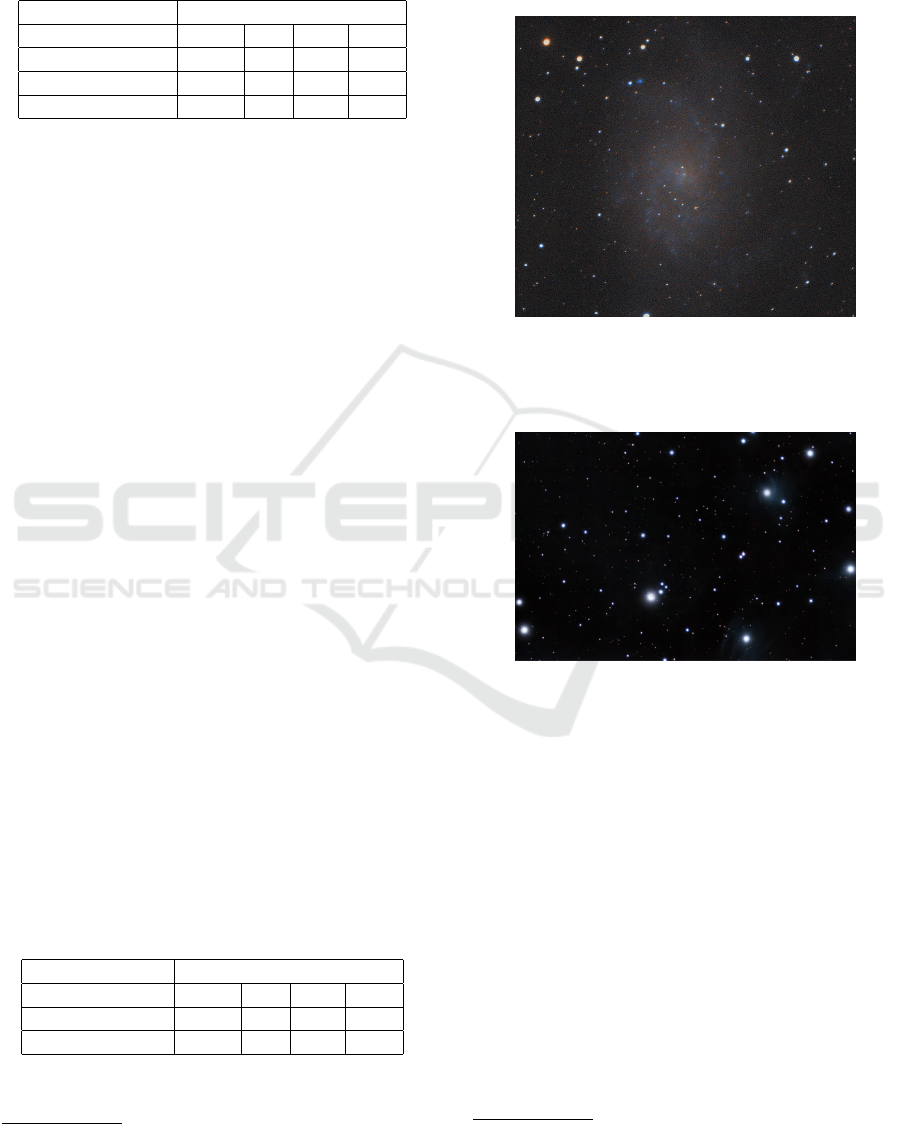
Table 2: Rating obtained with the best EfficientNetB1 IQA
model on a augmented test dataset built from 500 different
256x256 RGB images. The (mean, standard deviation, min-
imum, maximum) outputs of the IQA model are given for
each images set.
EfficientNetB1 ratings
mean std min max
No distortion 8.9 1.8 1.2 10
Distortion 5.5 2.8 0.7 10
Strong distortion 2.9 3.2 0 10
theless, AutoML allowed us to obtain optimized mod-
els for the use-case presented in this paper.
In the next section, we detail the efficiency of the
ResNet50 IQA model on live stacked images captured
during EAA sessions.
4 EXPERIMENTS
The model was then tested on data captured during
EAA sessions with two setups:
• 300 live stacked images obtained from 10 seconds
sub-frames, with short total integration time (from
20 to 30 minutes) by using a Stellina observation
station (Parisot et al., 2023). Images correspond
to different deep sky objects (example: Messier
31, NGC4565, etc.).
• 100 live stacked images obtained from 5 seconds
sub-frames, with short total integration time (from
20 to 30 minutes) by using a 72/420 refractor
and a dedicated low-end astronomical digital cam-
era(
10
).
All these RGB images have a high resolution
(3096x2048 for the first set, 2048x2048 for the sec-
ond set). As the input of our IQA model are 256x256
RGB images, all of them were split into patches and
the overall IQA rating is the mean of patch ratings (no
overlap).
Table 3: Evaluation of live stacked images captured dur-
ing EAA sessions with two setups: a Stellina observation
station (300 images) and a 72/400 refractor coupled to a
low-end digital camera (100 images). The (mean, standard
deviation, minimum, maximum) outputs of the ResNet50
IQA model are listed.
ResNet50 IQA rating
mean std min max
Stellina 5.8 1 2.6 9
72/400 refractor 1.3 0.7 0.6 3.1
The computed ratings are representative of the im-
age sets: in practice, the Stellina observation station
10
https://tinyurl.com/sv305
provides much better quality images than the other
setup (Table 3). They are useful to compare images
too: the second M17 nebula image presented in Fig-
ure 2 has a rating which is 50% higher than the rating
of the first image (Figure 3).
Figure 9: Live stacked image of the M33 galaxy obtained
with a SV305 camera and a 72/400 refractor: high noise,
malformed stars and insufficient contrast. The ResNet50
IQA model rating is 1.49.
Figure 10: Live stacked image of Pleiades (M45) captured
with a Stellina automated station: with little noise and stars
with a punctual appearance. The ResNet50 IQA model rat-
ing is 7.1.
One of the interests of the approach is to mea-
sure the quality of the stacked image obtained during
a EAA capture session. In theory, an astronomical
image improves when accumulating integration time
(i.e. by collecting as much data as possible). Captur-
ing data is time-consuming and sometimes challeng-
ing (especially due to weather conditions), and the
IQA estimation on the live stacked image may help to
capture only what is necessary to have a stacked im-
age with the desired quality (Figure 11). As the num-
ber of raw images increases, it becomes more difficult
to increase the quality of the stacked image. Let’s take
the example of the observation of NGC1499 with a
Stellina station: 711 images of 10 seconds of expo-
sure time each
11
. The graph shows that the quality
11
https://youtu.be/BTURaF9dTIU
DATA 2023 - 12th International Conference on Data Science, Technology and Applications
284

increases strongly at the beginning of the capture, and
less afterwards (Figure 11). The score can thus be
used to determine if it is still relevant to continue data
acquisition.
Figure 11: Evolution of IQA score during a EAA session
for observing the California Nebula (NGC1499). The more
raw images accumulated, the better the final stacked image
quality.
Out of curiosity, we have tested the IQA model on
two extreme cases of well-known astronomical pic-
tures. Although not typical use cases of our approach,
it gives us an overview of what our model produces
on different images:
• First Andromeda image captured by Isaac Roberts
in (1899)
12
: our IQA model provides a rating of
2.56. Even if the image is incredible for its time,
it is far from the standards expected today: a poor
score is logic.
• Webb’s First Deep Field – a long-exposure im-
age of the SMACS0723 galaxy cluster captured
vy the James Webb Space Telescope
13
: our IQA
model computes a rating of 7.2 for the part with-
out the JWST’s typical diffraction spikes (Rigby
et al., 2022). The rating drops to 4.9 with these
spikes because the model seems to consider them
as defects.
5 DISCUSSION
With our approach, we can observe that the image de-
fects are really penalized by the IQA model as we
have chosen to mix potential distortions into the train-
ing process. There is a drawback: this method is not
able to list, grade and locate precisely the defects that
12
https://commons.wikimedia.org/wiki/File:
Pic iroberts1.jpg
13
https://tinyurl.com/webbdf
are most present in an image, and for this we will have
to go further (for instance, by combining with object
detection).
Another point concerns the execution time of the
IQA model on large images. Even if training is real-
ized on a high performance computing platform, the
models use should be possible on normal computers
with modest capabilities – especially for on-the-fly
evaluation of stacked images.
Let’s take the example of a 4096x4096 astronom-
ical image: with no overlap, we may need to eval-
uate 256 256x256 patches – it may take some time
depending of the hardware. To be efficient, one must
try to minimize the number of calculations required.
In a pragmatic way, the following strategies can be
applied:
• Decrease the resolution of the image to reduce the
count of patches to evaluate.
• Estimate the IQA rating of a small relevant subset
of patches – for instance by ignoring dark patches
or patches with low signal.
During our experiments, we have concluded that the
second one provides better results. Further perfor-
mance optimizations will be realized after deep anal-
ysis of model execution with dedicated tools (Jin and
Finkel, 2020).
6 CONCLUSION
This paper presented an approach to automatically es-
timate the quality of astronomical RGB images. A
dedicated model was trained by using Automated Ma-
chine Learning, and then tested on various image sets
captured during Electronically Assisted Astronomy
sessions. A Python prototype was presented and pre-
liminary results were discussed. In future works, we
will extend the approach building on these current re-
sults to design and train additional models that are
both more sophisticated and interpretable, by relying
on eXplainable Artificial Intelligence.
ACKNOWLEDGMENTS
This research was funded by the Luxembourg
National Research Fund (FNR), grant reference
15872557. Tests were realized on the LIST AIDA
platform, thanks to Raynald Jadoul and Jean-Franc¸ois
Merche.
Astronomical Images Quality Assessment with Automated Machine Learning
285

REFERENCES
Adake, N. (2022). Trust the process: An investigation into
astrophotography. In AIAA Southeastern Regional
Student Conference.
Aliakhmet, K. and James, A. P. (2019). Temporal g-
neighbor filtering for analog domain noise reduction
in astronomical videos. IEEE Trans. on Circuits and
Systems II: Express Briefs, 66(5):868–872.
Bracken, C. (2017). The deep-sky imaging primer. Deep-
sky Publishing.
Bradley, L., Sipocz, B., Robitaille, T., Tollerud, E., Deil, C.,
Vin
´
ıcius, Z., Barbary, K., G
¨
unther, H. M., Bostroem,
A., Droettboom, M., et al. (2016). Photutils: Photom-
etry tools. Astrophysics Source Code Library, pages
ascl–1609.
Feurer, M. and Hutter, F. (2019). Hyperparameter optimiza-
tion. In Automated Machine Learning, pages 3–33.
Springer, Cham.
He, K., Zhang, X., Ren, S., and Sun, J. (2016). Deep resid-
ual learning for image recognition. In IEEE CVPR
2016, pages 770–778.
Hogg, D. W., Blanton, M., Lang, D., Mierle, K., and
Roweis, S. (2008). Automated astrometry. In As-
tronomical Data Analysis Software and Systems XVII,
volume 394, page 27.
Hutter, F., Kotthoff, L., and Vanschoren, J. (2019). Au-
tomated machine learning: methods, systems, chal-
lenges. Springer Nature.
Jin, H., Chollet, F., Song, Q., and Hu, X. (2023). Autok-
eras: An automl library for deep learning. Journal of
Machine Learning Research, 24(6):1–6.
Jin, Z. and Finkel, H. (2020). Analyzing deep learning
model inferences for image classification using Open-
VINO. In IPDPSW 2020, pages 908–911.
Jung, A. (2019). Imgaug documentation. Readthedocs. io,
Jun, 25.
Kim, J., Nguyen, A.-D., and Lee, S. (2019). Deep cnn-
based blind image quality predictor. IEEE Trans. on
Neural Networks and Learning Systems, 30(1):11–24.
Leung, H. W. and Bovy, J. (2018). Deep learning of
multi-element abundances from high-resolution spec-
troscopic data. Monthly Notices of the Royal Astro-
nomical Society.
Mittal, A., Moorthy, A. K., and Bovik, A. C. (2012).
No-reference image quality assessment in the spa-
tial domain. IEEE Trans. on image processing,
21(12):4695–4708.
Olson, R. S. and Moore, J. H. (2016). TPOT: A tree-
based pipeline optimization tool for automating ma-
chine learning. In Workshop on automatic machine
learning, pages 66–74. PMLR.
Parisot, O., Bruneau, P., Hitzelberger, P., Krebs, G., and
Destruel, C. (2022). Improving accessibility for deep
sky observation. ERCIM News, 2022(130).
Parisot, O., Hitzelberger, P., Bruneau, P., Krebs, G., De-
struel, C., and Vandame, B. (2023). MILAN Sky Sur-
vey, a dataset of raw deep sky images captured during
one year with a Stellina automated telescope. Data in
Brief, 48:109133.
Parisot, O. and Tamisier, T. (2022). Applying genetic algo-
rithm and image quality assessment for reproducible
processing of low-light images. In IMPROVE 2022,
pages 189–194.
Raschka, S. (2018). Model evaluation, model selection, and
algorithm selection in machine learning.
Ravi, A. (2020). Nebula images.
Redfern, G. I. (2020). Astrophotography is Easy!: Basics
for Beginners. Springer.
Rigby, J., Perrin, M., McElwain, M., Kimble, R., Fried-
man, S., Lallo, M., Doyon, R., Feinberg, L., Fer-
ruit, P., Glasse, A., et al. (2022). Characterization of
jwst science performance from commissioning. arXiv
preprint arXiv:2207.05632.
Shorten, C. and Khoshgoftaar, T. M. (2019). A survey on
image data augmentation for deep learning. Journal
of big data, 6(1):1–48.
Talebi, H. and Milanfar, P. (2018). Nima: Neural im-
age assessment. IEEE Trans. on Image Processing,
27(8):3998–4011.
Tan, M. and Le, Q. (2019). Efficientnet: Rethinking model
scaling for convolutional neural networks. In ICML,
pages 6105–6114. PMLR.
Teimoorinia, H., Kavelaars, J., Gwyn, S., Durand, D., Rol-
ston, K., and Ouellette, A. (2020). Assessment of as-
tronomical images using combined machine-learning
models. The Astronomical Journal, 159(4):170.
Zack, M., Gannon, A., and McRoberts, J. (2018). Software
and apps to help the suburban astronomer. In Stargaz-
ing Under Suburban Skies, pages 341–350. Springer.
Zelaya, C. V. G. (2019). Towards explaining the effects
of data preprocessing on machine learning. In ICDE
2019, pages 2086–2090. IEEE.
Zhai, G. and Min, X. (2020). Perceptual image quality as-
sessment: a survey. Science China Information Sci-
ences, 63(11):1–52.
DATA 2023 - 12th International Conference on Data Science, Technology and Applications
286
