
RoLA: A Real-Time Online Lightweight Anomaly Detection System for
Multivariate Time Series
Ming-Chang Lee
1 a
and Jia-Chun Lin
2 b
1
Department of Computer science, Electrical Engineering and Mathematical Sciences, Høgskulen p
˚
a Vestlandet (HVL),
Bergen, Norway
2
Department of Information Security and Communication Technology, Norwegian University of Science and Technology
(NTNU), Gjøvik, Norway
Keywords:
Anomaly Detection, Multivariate Time Series, Online Model Training, Unsupervised Learning, LSTM,
Parallel Processing, Pearson Correlation Coefficient, Apache Kafka.
Abstract:
A multivariate time series refers to observations of two or more variables taken from a device or a system
simultaneously over time. There is an increasing need to monitor multivariate time series and detect anoma-
lies in real time to ensure proper system operation and good service quality. It is also highly desirable to
have a lightweight anomaly detection system that considers correlations between different variables, adapts
to changes in the pattern of the multivariate time series, offers immediate responses, and provides support-
ive information regarding detection results based on unsupervised learning and online model training. In the
past decade, many multivariate time series anomaly detection approaches have been introduced. However,
they are unable to offer all the above-mentioned features. In this paper, we propose RoLA, a real-time online
lightweight anomaly detection system for multivariate time series based on a divide-and-conquer strategy,
parallel processing, and the majority rule. RoLA employs multiple lightweight anomaly detectors to moni-
tor multivariate time series in parallel, determine the correlations between variables dynamically on the fly,
and then jointly detect anomalies based on the majority rule in real time. To demonstrate the performance of
RoLA, we conducted an experiment based on a public dataset provided by the FerryBox of the One Ocean Ex-
pedition. The results show that RoLA provides satisfactory detection accuracy and lightweight performance.
1 INTRODUCTION
A multivariate time series consists of sequences of
values of several simultaneous variables changing
with time (Chakraborty et al., 1992). In the real
world, multivariate time series are continuously gen-
erated by sensors of industry devices or large systems
such as server machines, spacecrafts, engines, water
treatment plant, power grids, etc (Su et al., 2019).
Monitoring multivariate time series and detecting
anomalies in the time series has become an imperative
task for critical infrastructures such as transportation
systems, communication networks, and diverse cyber-
physical systems. There is an increasing need to have
a real-time, reliable, and accurate anomaly detection
approach that does not rely on labeled data or super-
vised learning and that is fast enough to provide in-
stant reporting (Wu et al., 2020). It is also essential to
a
https://orcid.org/0000-0003-2484-4366
b
https://orcid.org/0000-0003-3374-8536
take the correlations between different variables of a
multivariate time series into consideration in order to
reduce false positives (Zhao et al., 2020). In addition,
it would be desirable to have a lightweight anomaly
detection approach that can adapt to changes in the
pattern of the time series and requires no excessive
computation resources (Lee et al., 2020b; Lee et al.,
2021; Lee and Lin, 2023).
A number of multivariate time series anomaly de-
tection approaches have previously been introduced
based on machine learning. Many of them are based
on either supervised or semi-supervised learning,
which was found ineffective and infeasible in real-
world applications. Some approaches have a com-
plex design and require substantial human interven-
tion to tune and configure different hyperparameters
or parameters. Most of the approaches rely on of-
fline model training, and therefore unable to adapt to
changes in multivariate time series over time. In addi-
tion, almost all approaches act as a black box without
Lee, M. and Lin, J.
RoLA: A Real-Time Online Lightweight Anomaly Detection System for Multivariate Time Series.
DOI: 10.5220/0012077200003538
In Proceedings of the 18th International Conference on Software Technologies (ICSOFT 2023), pages 313-322
ISBN: 978-989-758-665-1; ISSN: 2184-2833
Copyright
c
2023 by SCITEPRESS – Science and Technology Publications, Lda. Under CC license (CC BY-NC-ND 4.0)
313

explicitly learning the relationship between variables,
which therefore limits their detection ability and dis-
able them from providing interpretation when anoma-
lies occur (Pang and Aggarwal, 2021; Deng and Hooi,
2021).
In this paper, we propose a real-time online
lightweight anomaly detection system (RoLA for
short) for multivariate time series following a divide-
and-conquer strategy, parallel processing, and the
majority rule. RoLA employs a set of lightweight
anomaly detectors (LADs for short) to detect anoma-
lies in multivariate time series in parallel based on
RePAD2 (Lee and Lin, 2023), which is a state-of-the-
art real-time and lightweight anomaly detection ap-
proach for open-ended univariate time series.
Whenever a LAD detects a suspicious data point
for the variable it has been tracking, RoLA will cal-
culate the correlation between that variable and every
other variable by tracing back their time series in a
recent period based on the Pearson correlation coef-
ficient (Cohen et al., 2009). After that, all highly-
correlated variables will go through a polling process.
If more than half of them have a suspicious data point
detected by their own LADs at that moment, RoLA
will report that all these data points are anomalous
and output all relevant variables as supportive infor-
mation. It is worth noting that RoLA requires no of-
fline model training, labeled data, or pre-defined de-
tection threshold. Its simple and lightweight design
makes itself to be easily deployed on any commodity
computer.
To demonstrate the performance of RoLA in terms
of detection accuracy, time consumption, and instant
response, we conducted an experiment based on real-
world multivariate time series generated by FerryBox
(Schroeder et al., 2008) of the One Ocean Expedition
(King et al., 2021; Knoblauch, 2022) by ingesting the
multivariate time series into RoLA via Apache Kafka
(Garg, 2013) to mimic the real-world streaming be-
havior. Note that Apache Kafka is an open-source dis-
tributed streaming platform developed by the Apache
Software Foundation for real-time stream processing.
The results show that RoLA provides satisfactory
detection accuracy and offers instant response to ev-
ery detected anomaly without needing any general-
purpose GPUs or high-performance computers. Fur-
thermore, RoLA provides useful information about
what variables are involved in each detected anomaly.
Such information would be helpful for domain ex-
perts to further investigate the anomalies and identify
the events that caused the anomalies. The contribu-
tions of RoLA are summarized as follows:
1. Unsupervised learning and online model training:
RoLA does not require any offline model training,
labelled dataset or normal dataset to learn a mul-
tivariate time series. Instead, RoLA individually
learns and monitors each time series of a multi-
variate time series in an online manner. Further-
more, RoLA also learns the dynamic correlation
between different variables whenever any LAD
detects a suspicious data point. These features
enable RoLA to capture dynamic and unforeseen
correlations among all variables.
2. Adaptability: In RoLA, each LAD automatically
and periodically updates its detection threshold
and retrains its model when needed. Hence,
RoLA can adapt to changes in the pattern of the
multivariate time series over time. There is no
need for users to determine any detection thresh-
old.
3. Real-time processing, instant response, and sup-
portive information: RoLA can process multivari-
ate time series in real time and provide an instant
response whenever an anomaly occurs. Each de-
tected anomaly also comes with useful informa-
tion about all relevant variables.
4. Lightweight design without much human inter-
vention: The design of RoLA is simple and
lightweight. There is no need for users to config-
ure many hyperparameters or parameters. Only
two variables are needed to be determined before-
hand, which will be described later.
5. No additional data storage: By incorporating
Apache Kafka into the design of RoLA, multivari-
ate time series can be directly ingested into RoLA
and processed by RoLA without requiring any ad-
ditional large data storage.
The rest of the paper is organized as follows: Sec-
tion 2 discusses related work. In Section 3, we intro-
duce the details of RoLA. Section 4 presents and dis-
cusses the experiment and the corresponding results.
In Section 5, we conclude this paper and outline fu-
ture work.
2 RELATED WORK
Anomaly detection in multivariate time series has
been an active research topic, and many related ap-
proaches have been introduced. Conventional super-
vised learning approaches rely on labeled data for
model training and can only detect known anomalies.
Due to lack of labeled data in many real-world ap-
plications, many anomaly detection approaches were
design based on either semi-supervised learning or
unsupervised learning. In semi-supervised anomaly
detection, training data is assumed to include only
ICSOFT 2023 - 18th International Conference on Software Technologies
314

normal data. However, the training data in unsuper-
vised anomaly detection is assumed to include a small
minority of abnormal data instances (Chandola et al.,
2009).
Hundman et al. (Hundman et al., 2018) handle
multivariate time series anomaly detection by cre-
ating a model to detect anomalies for each space-
craft telemetry variable based on the Long Short-Term
Memory (LSTM) and introducing a dynamic thresh-
olding method to determine the detection threshold at
each time step. Even though this approach is unsu-
pervised, it is based on offline model training. Indi-
vidually training a model for each telemetry variable
can indeed speed up the learning, but this approach
did not take correlations between different variables
into consideration. Therefore, it might not be able to
detect anomalies that propagate to multiple variables.
Audibert et al. (Audibert et al., 2020) proposed
an unsupervised anomaly detection approach called
USAD for multivariate time series based on autoen-
coders and adversarial training. USAD needs to go
through three stages of offline training (autoencoder
training, adversarial training, and two-phase training)
even though their experiment results show that their
training time is short. Due to the offline training,
USAD might not be able to adapt to changes or cap-
ture unforeseen patterns in multivariate time series
over time.
Deng and Hooi (Deng and Hooi, 2021) proposed
a graph neural network-based anomaly detection for
multivariate time series by learning a graph of the de-
pendence relationships between sensors, computing
individual anomalousness scores for each sensor, and
combining them into a single anomalousness score.
Similar to many other anomaly detection methods,
this approach still requires offline training to learn
the relationships between sensors, meaning that their
model will not be able to capture relationship changes
between sensors over time.
Rettig et al. (Rettig et al., 2019) introduced an
online anomaly detection approach for signaling traf-
fic of a mobile cellular network based on relative en-
tropy and the Pearson correlation coefficient. How-
ever, they require both normal dataset and anomalous
dataset, and require domain knowledge to set detec-
tion thresholds. Yao et al. (Yao et al., 2010) proposed
an online anomaly detection method for wireless sen-
sor systems by constructing a piecewise linear model
for multivariate time series and comparing the piece-
wise linear models of sensor data collected during a
time interval with a reference model. If there are sig-
nificant differences, the data is flagged as anomalies.
Apparently that this approach depends on the refer-
ence model, which requires support from domain ex-
perts and it needs to be done in advance.
According to the comprehensive review on out-
lier/anomaly detection for time series (Bl
´
azquez-
Garc
´
ıa et al., 2021), current research gaps include
how to design dynamic and adaptive detection thresh-
olds, take complex correlations between variables of
multivariate time series into consideration, and de-
velop real-time anomaly detection that can provide
immediate responses in real time and can be practi-
cally used in real-world applications.
Laxhammar and Falkman (Laxhammar and Falk-
man, 2013) also pointed out that many methods have
the following limitations: invalid statistical assump-
tion, parameter-laden, ad-hoc anomaly thresholds, of-
fline learning, and offline anomaly detection. In ad-
dition, a lot of anomaly detection methods are con-
structed as a black box without being able to provide
any information or explanation to their detection re-
sults (Pang and Aggarwal, 2021), or they do not ex-
plicitly learn the relationships between different vari-
ables of multivariate time series, therefore unable to
detect and explain deviations from such relationships
when anomalous events happen. (Deng and Hooi,
2021)
Different from many existing multivariate time se-
ries anomaly detection approaches, RoLA is a novel
real-time online lightweight anomaly detection sys-
tem. Each variable of a multivariate time series is
continuously learned and monitored by a lightweight
anomaly detector, which retrains its detection model
only when it is needed based on a dynamically cal-
culated detection threshold. All lightweight anomaly
detectors work together to detect anomalies based on
the corrections between variables and the majority
rule. In addition, RoLA is also capable of offer-
ing supportive information, which allows domain ex-
perts to further investigate any detected anomaly. Be-
cause of its lightweight design, RoLA can provide in-
stant responses in real time without requiring general-
purpose GPU or high-performance computers.
To our best knowledge, RoLA is the first approach
that can learn multivariate time series in a completely
online manner and provide real-time and transpar-
ent anomaly detection without requiring any labeled
dataset, normal dataset, or reference model.
3 RoLA
Recall that RoLA is proposed to be a real-time, on-
line and lightweight anomaly detection system for
multivariate time series and to provide instant re-
sponses and supportive information without much hu-
man intervention. In order to achieve this ambi-
tious goal, we follow a divide-and-conquer strategy,
RoLA: A Real-Time Online Lightweight Anomaly Detection System for Multivariate Time Series
315

parallel processing, and the majority rule to design
RoLA. Instead of using one complex model to learn
the target multivariate time series, RoLA employs one
lightweight anomaly detector (i.e., LAD) to learn and
monitor each individual variable of the target multi-
variate time series, and all LADs work together to de-
tect anomalies in the multivariate time series. Each
LAD is based on RePAD2 (Lee and Lin, 2023), which
is a state-of-the-art real-time and lightweight anomaly
detection approach for open-ended univariate time se-
ries.
Just like RePAD2, LAD always uses three histor-
ical data points to predict each upcoming data point
in the target time series based on LSTM, a neural net-
work designed to learn long-term dependencies and
model temporal sequences (Hochreiter and Schmid-
huber, 1997). LAD inherits a simple LSTM struc-
ture (only one hidden layer and ten hidden units)
from RePAD2 (Lee and Lin, 2023) and RePAD (Lee
et al., 2020b). By dynamically calculating a detec-
tion threshold at each time point and retraining a new
LSTM model only when the current LSTM model
cannot predict the next data point value accurately,
LAD can adapt to any unforeseen changes in the pat-
tern of the time series on the fly. LAD only considers
the data point at the current time point as anomalous
when it has tried retraining a new LSTM mode but
the model still results in an AARE value higher than
the detection threshold. Note that AARE stands for
average absolute relative error.
Figure 1: The architecture of RoLA.
Figures 1 and 2 illustrate the architecture and al-
gorithm of RoLA, respectively. Suppose that the tar-
get multivariate time series consists of N variables,
denoted by V
1
, V
2
, ..., and V
N
. Let S
V
x
be the time
series of variable V
x
, x=1, 2, ..., N. Assume that the
source (which can be a device or a server) observes
a new data point from every variable at every time
point. Let S
V
x
,T
be the data point of variable V
x
ob-
served at T, where T denotes the current time point
and T starts from 0. Whenever the source observes
a N-dimensional vector [S
V
1
,T
, S
V
2
,T
, ..., S
V
N
,T
] at T,
this vector will be immediately sent to Apache Kafka.
Hence, RoLA does not require any extra data storage
to keep the time series. After that, Kafka distributes
data points S
V
1
,T
, S
V
2
,T
, ..., and S
V
N
,T
to LAD
1
, LAD
2
,
..., and LAD
N
, respectively. Note that LAD
x
is re-
sponsible for learning time series S
V
x
and detecting
anomalous data points in S
V
x
.
Let R
x,T
be the detection result generated by
LAD
x
, and it indicates either data point S
V
x
,T
is
anomalous or not. As long as the current data point of
a variable is detected as anomalous by its LAD, RoLA
will calculate the Pearson correlation coefficient be-
tween that variable and every other variable in a re-
cent period to find out which variables are highly cor-
related with that variable. Then all highly-correlated
variables will go through a polling process.
Figure 2: The algorithm of RoLA.
In order to explain how the polling process works,
let us look at an example. Assume that the target mul-
tivariate time series consists of 5 variables (i.e., V
1
,
V
2
, ..., and V
5
). If data point S
V
3
,2000
is detected as
anomalous by LAD
3
, RoLA will calculate the corre-
lation coefficient between variable V
3
and every other
variable (i.e., V
1
, V
2
, V
4
, and V
5
) based on Equation
1, where p is a pre-defined integer. Let a denote vari-
able V
3
, and let b denote every other variable. In this
example, b = V
1
, V
2
, V
4
, or V
5
. If current time point
T is less than p, RoLA will use all past data points of
a and b to compute E
a,b
. Otherwise, it will use the p
most recent data points of a and b to calculate E
a,b
.
E
a,b
=
T (
∑
T −1
z=0
S
a,z
S
b,z
)−(
∑
T −1
z=0
S
a,z
)(
∑
T −1
z=0
S
b,z
)
√
[T
∑
T −1
z=0
(S
a,z
)
2
−(
∑
T −1
z=0
S
a,z
)
2
][T
∑
T −1
z=0
(S
b,z
)
2
−(
∑
T −1
z=0
S
b,z
)
2
]
, T < p
p(
∑
T −1
z=T −p
S
a,z
S
b,z
)−(
∑
T −1
z=T −p
S
a,z
)(
∑
T −1
z=T −p
S
b,z
)
√
[p
∑
T −1
z=T −p
(S
a,z
)
2
−(
∑
T −1
z=T −p
S
a,z
)
2
][p
∑
T −1
z=T −p
(S
b,z
)
2
−(
∑
T −1
z=T −p
S
b,z
)
2
]
, T ≥ p
(1)
In Equation 1, S
a,z
and S
b,z
are the data points of
variables a and b at time point z, respectively. The
ICSOFT 2023 - 18th International Conference on Software Technologies
316

Pearson correlation coefficient is a statistical measure
of the strength and direction of the linear relationship
between two variables, and it ranges from −1 to 1.
A value of −1 shows a perfect negative correlation,
0 indicates no correlation, and 1 indicates a perfect
positive correlation.
In this paper, if the correlation coefficient between
a and b (i.e., E
a,b
) is larger than or equal to a positive
threshold thd
pos
, it means that a and b have a highly
positive correlation. On the other hand, if E
a,b
is less
than or equal to a negative threshold thd
neg
(where
thd
neg
is negative thd
pos
), it means that a and b have
a highly negative correlation. In both cases, RoLA
will further check if the current data point of b has
been detected as anomalous by its LAD (see line 22
of Figure 2). If the answer is yes, RoLA increases
counter C
agree
by one, add the data point to a list de-
noted by L
data
, and add b to another list denoted by
L
var
(see lines 22 to 25). Otherwise, RoLA increases
counter C
disagree
by one. The above process is so
called polling. Afterwards, if the condition shown on
line 27 is evaluated to be true,all data points in L
data
will be reported as anomalous data points by RoLA,
and all variables in L
var
will be outputted as anoma-
lous variables (see lines 27 to 29).
Let us continue with our previous example. Sup-
pose that V
4
and V
5
are found highly correlated with
V
3
, but only V
4
has its current data point detected as
anomalous in addition to the current data point of V
3
.
In this case, C
agree
will be 2, but C
disagree
will be 1.
Hence, RoLA will report the current data points of V
3
and V
4
as anomalous data points, and report both V
3
and V
4
as anomalous variables.
4 EXPERIMENT RESULTS
To evaluate RoLA, we conducted an experiment
based on the multivariate time series generated by the
FerryBox (King et al., 2021; Schroeder et al., 2008)
used in the One Ocean Expedition (King et al., 2021;
Knoblauch, 2022), which is a circumnavigation of
the globe by a Norwegian tall ship called Statsraad
Lehmkuhl to share knowledge about the crucial role
of the ocean for a sustainable development. The Fer-
ryBox uses several sensors to monitor seawater tem-
perature, conductivity, salinity, oxygen concentration,
saturation, etc. The dataset consists of the time series
of the 12 variables measured every one minute from
2021/10/05 08:49 to 2021/11/29 07:12. However, the
time series was not continuous. It could be that the
FerryBox was not used all the time.
Therefore, we chose a continuous measure-
ment period from 2021/10/28 00:00 to 2021/10/30
23:59 and used the corresponding multivarite
time series to be our target dataset in this exper-
iment. The total number of time points in this
datset is 4316, and the following 9 variables are
involved: SBE45 Salinity, SBE45 Conductivity,
Optode Concentration, Optode Saturation,
C3 Temperature, Flow Temperature, Op-
tode Temperature, C3 Turbidity, and Flow Flow.
Note that SBE45 denotes a temperature monitor
called SBE 45 MicroTSG (SEA.BIRD Scientific,
2023), and it was used by the FerryBox to measure
seawater salinity and conductivity. Optode refers
to a sensor used to measure seawater temperature,
oxygen saturation, and oxygen concentration (AAN-
DERAA, 2023; Schroeder et al., 2008). C3 is a
submersible fluorometer that can be configured
with up to three or six optical sensors ranging from
deep ultraviolet to the infrared spectrum (FONDRI-
EST ENVIRONMENTAL, 2023), and it was used to
measure seawater temperature and turbidity.
Figure 3 illustrates the time series of these 9 vari-
ables. We annotated all obvious anomalies and high-
lighted each of them in gray. Apparently from Fig-
ure 3 that not all the variables are involved in every
anomaly. Table 1 lists the details of these anomalies.
All the anomalies are collective anomalies since they
all last more than one time point, which satisfies the
definition of a collective anomaly, i.e., a sequence of
data instances that are anomalous compared with the
rest of the data (Chandola et al., 2009).
As mentioned earlier, the measurement interval
time in the FerryBox dataset is one minute. In order
to prove that RoLA can provide immediate response
for multivariate time series that are generated on the
fly, we reduced the interval time from 1 minute to 10
seconds and injected each 9-dimensional vector of the
target multivariate time series from Kafka into RoLA
sequentially based on the new interval.
We followed the hyperparameters and parameters
used by RePAD2 (Lee and Lin, 2023) to configure
the hyperparameters and parameters for each LAD of
RoLA. Please see Table 2 for all the values. In other
words, users are not required to tune these hyperpa-
rameters and parameters for RoLA. In this experi-
ment, RoLA used nine LADs for the nine variables.
Each LAD has a simple LSTM network structure with
only one hidden layer and ten hidden units, and all
LADs adopted Early Stopping (EarlyStopping, 2023)
to automatically determine the number of epochs (up
to 50) for their online LSTM model training.
RoLA required two parameters to be defined in
advance. One is parameter p for correlation coeffi-
cient calculation. In this experiment, p was set to
2880, which corresponds to two days for the Fer-
RoLA: A Real-Time Online Lightweight Anomaly Detection System for Multivariate Time Series
317

Figure 3: The time series of the nine variables in the target multivariate time series. All anomalies are annotated and high-
lighted in gray. Note that these anomalies are unknown to RoLA since RoLA is based on unsupervised learning.
ICSOFT 2023 - 18th International Conference on Software Technologies
318

Table 1: The details of each annotated anomaly.
Anomaly No. Time period Number of data points Variables involved
1 2021-10-28 10:05 to 2021-10-28 10:17 13 Optode Concentration, Optode Saturation, Flow Flow
2 2021-10-28 12:15 to 2021-10-28 12:39 25
SBE45 Salinity, SBE45 Conductivity, Optode Concentration, Optode Saturation,
C3 Temperature, Flow Temperature, Optode Temperature, C3 Turbidity, Flow Flow
3 2021-10-30 10:08 to 2021-10-30 11:19 71 Optode Concentration, Optode Saturation, Flow Flow
4 2021-10-30 22:13 to 2021-10-30 23:29 77 Optode Concentration, Optode Saturation, Flow Flow
Table 2: The hyperparameter and parameters for each LAD.
Hyperparameters and parameters Value
The number of hidden layers 1
The number of hidden units 10
The number of epochs 50
Learning rate 0.005
Activation function tanh
Random seed 140
The sliding window size W 1440
ryBox dataset. The other parameter is the positive
threshold thd
pos
, which was set to a high value of 0.95
(recall that 1 is the highest value). Note that the neg-
ative threshold thd
neg
does not need to be configured
because it equals negative thd
pos
, i.e., −0.95.
In this experiment, we implemented RoLA and all
the LADs in Deeplearning4j (Deeplearning4j, 2023),
which is a programming library written in Java for
deep learning. Furthermore, we used Apache Kafka
of version 2.13-3.4.0 to inject the target multivariate
time series into RoLA sequentially based on the 10-
second interval. The entire experiment was performed
on a MacBookPro laptop running MacOS Monterey
12.6 with 2.6GHz 6-Core Intel Core i7 and 16GB
DDR4 SDRAM. The purpose of using this laptop is
to show that RoLA can be very efficient even though
it runs on a commodity computer.
As mentioned earlier that RoLA is the first
anomaly detection approach that can learn multivari-
ate time series in a completely online manner, and
provide real-time and transparent anomaly detection
without any labeled dataset, normal dataset, or refer-
ence model. According to all the above features, we
could not find any similar approach to compare with
RoLA. Hence, we chose to compare the joint detec-
tion results of RoLA with the individual detection re-
sults of LADs.
To easily present the detection performance of
RoLA, we illustrated the individual detection results
of each LAD on its own variable on the left part of
Figure 4 while presenting the joint detection results of
RoLA on the right part of Figure 4. Each data point
that was detected as anomalous is marked by a small
red square. Apparently, when LADs worked on indi-
vidual variables, each of them generated many false
positives, which are the red squares unable to be cov-
ered by the gray bars (see the left part of Figure 4).
The total number of the false positives is 224.
However, when RoLA was used, it significantly
reduced false positives from 224 to 66, implying that
combining multiple LADs to jointly detect anoma-
lies is a promising approach. Note that RoLA
generated a false positive in the beginning because
RoLA found that many variables have a high corre-
lation at that moment. However, this is inevitable
since RoLA did not go through any offline train-
ing and that it learned only few historical data
at that moment. Table 3 lists the detailed detec-
tion performance of RoLA. We followed the eval-
uation method used by (Lee et al., 2020a) to cal-
culate precision, recall (also known as sensitivity),
and F-score, which are three widely used metrics
for measuring the accuracy of an approach. Note
that precision=TP/(TP+FP), recall=TP/(TP+FN),
and F-score= 2·(precision·recall)/(precision+recall)
where TP, FP, and FN represent true positive, false
positive, and false negative, respectively. As long as
any point anomaly occurring at time point Z can be
detected within a time period ranging from Z−K to
time point Z+K where K was set to 7 following by
the suggestion made by (Ren et al., 2019), we say that
the anomaly is correctly detected. On the other hand,
for any collective anomaly, if it starts at time point I
and ends at time point J (J>I), and it can be detected
within a period between I−K and J, we say that the
anomaly is correctly detected.
Table 3: The detection performance of RoLA.
Metric Value
TP 186
FP 66
FN 0
Precision 0.738
Recall 1
F-score 0.849
Based on the result listed in Table 3, we can
see that RoLA offers satisfactory detection accuracy
given the fact that it is a completely unsupervised
learning approach and that it uses only online model
training without any offline process.
Table 4 details all supportive information out-
putted by RoLA regarding all detected anomalies.
From this table, we can see all variables that were
found involved in each anomaly. When Anomalies 1
and 2 just occurred, only few variables were found in-
RoLA: A Real-Time Online Lightweight Anomaly Detection System for Multivariate Time Series
319
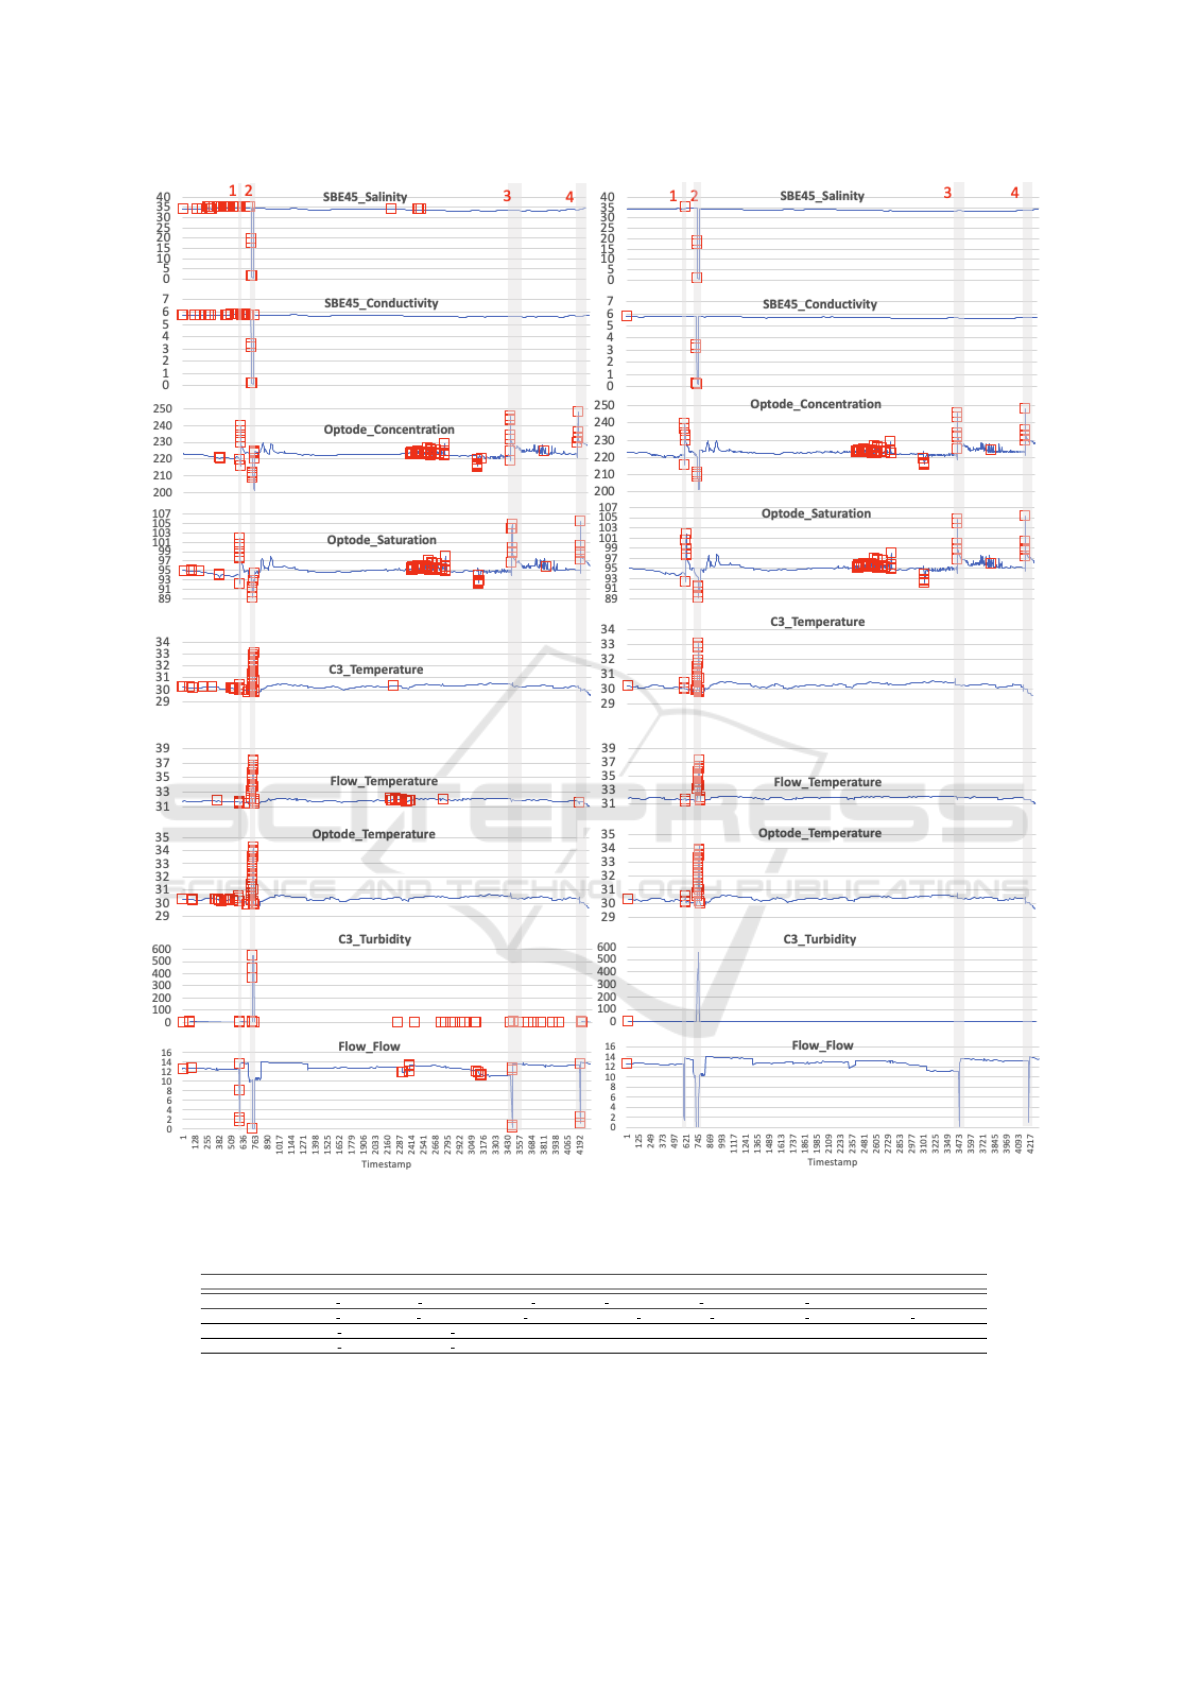
Figure 4: The detection results of the LADs on individual variables (the left part) and the final detection results of RoLA (the
right part).
Table 4: The supportive information outputted by RoLA.
Anomaly No. All variables that are found involved
1
SBE45 Salinity, Optode Concentration, Optode Saturation, C3 Temperature, Flow Temperature, Optode Temperature
2
SBE45 Salinity, SBE45 Conductivity, Optode Concentration, Optode Saturation, C3 Temperature, Flow Temperature, Optode Temperature
3 Optode Concentration, Optode Saturation
4 Optode Concentration, Optode Saturation
volved. However, when the two anomalies continued
(recall that they are both collective anomalies), more
variables were found involved because of the obvious
changes in their time series. Hence, we showed the
largest set of variables that are found involved in each
anomaly in Table 4. For Anomaly 1, RoLA found
ICSOFT 2023 - 18th International Conference on Software Technologies
320

that all involved variables are SBE45 Salinity,
Optode Concentration, Optode Saturation,
C3 Temperature, Flow Temperature, and Op-
tode Temperature. However, the real vari-
ables involved in this anomaly are only Op-
tode Concentration, Optode Saturation and
Flow Flow (see Table 1). We can see that Flow Flow
was not found involved in this anomaly by RoLA
even though it had some anomalous data points (see
the right part of Figure 4). This is because that RoLA
at that moment did not find that all the past data
points of Flow Flow was highly correlated with those
of any above-mentioned involved variable.
For Anomaly 2, RoLA found that all involved
variables are SBE45 Salinity, SBE45 Conductivity,
Optode Concentration, Optode Saturation,
C3 Temperature, Flow Temperature, and Op-
tode Temperature. However, we can see that both
C3 Turbidity and Flow Flow were not found involved
since the past data points of these two variables be-
fore the occurrence of Anomaly 2 were not highly
correlated with any other variable.
In fact, C3 Turbidity and Flow Flow were not
found highly correlated with any other variable in the
entire dataset. Nevertheless, all the four anomalies
still can be successfully detected by RoLA with other
variables. That is why the recall of RoLA is 1.
As for the execution performance of RoLA, we
calculated the time required by RoLA to decide
whether or not each 9-dimensional vector in the target
multivariate time series is anomalous. The average
response time is 0.149 sec with a standard devia-
tion of 0.168 sec. Due to the fact that the LADs of
RoLA need to retrain their LSTM models when they
cannot predict well, the standard deviation is slightly
higher than the average response time. Recall that we
have reduced the interval time of the target multivari-
ate time series from 1 minute to 10 sec in this ex-
periment. The response time result shows that RoLA
indeed offers real-time streaming processing and im-
mediate responses even though it runs only on a com-
modity laptop.
5 CONCLUSIONS AND FUTURE
WORK
In this paper, we have introduced RoLA for detecting
anomalies in a multivariate time series in real time.
Different from existing anomaly detection approaches
for multivariate time series, RoLA does not need to
go through any offline training since it can learn mul-
tivariate time series in a completely online manner
without requiring any labeled dataset, normal dataset,
or reference model. In addition, RoLA does not re-
quire users to determine detection thresholds or con-
figure many hyperparameters or parameters.
The most distinct feature of RoLA is its simple
and efficient design. By using a LAD to individ-
ually learn the time series of each variable, deter-
mining highly correlated variables dynamically only
when it is needed, and following the majority rule to
jointly determine anomalous data points, RoLA can
efficiently and effectively detect anomalies and pro-
vide useful supportive information for domain experts
to further investigate any detected anomaly. The ex-
periment results on the FerryBox dataset show that
RoLA offers satisfactory detection performance and
instant useful reporting in real time.
In our future work, we plan to improve the de-
tection accuracy of RoLA by reducing false positives.
Furthermore, the current version of RoLA will repeat-
edly calculate correlation coefficients during the oc-
currence of a collective anomaly. This could be im-
proved to further enhance the performance of RoLA.
Another work is to investigate how parameters p and
thd
pos
impact the detection performance of RoLA and
to see if there is a way to automatically determine
these two parameters.
ACKNOWLEDGEMENT
The authors want to thank the anonymous reviewers
for their reviews and suggestions for this paper.
REFERENCES
AANDERAA (2023). The Aanderaa Oxygen Sensors. ht
tps://www.aanderaa.com/oxygen-sensors. [Online;
accessed 23-February-2023].
Audibert, J., Michiardi, P., Guyard, F., Marti, S., and Zulu-
aga, M. A. (2020). USAD: Unsupervised anomaly de-
tection on multivariate time series. In Proceedings of
the 26th ACM SIGKDD International Conference on
Knowledge Discovery & Data Mining, pages 3395–
3404.
Bl
´
azquez-Garc
´
ıa, A., Conde, A., Mori, U., and Lozano,
J. A. (2021). A review on outlier/anomaly detection
in time series data. ACM Computing Surveys (CSUR),
54(3):1–33.
Chakraborty, K., Mehrotra, K., Mohan, C. K., and Ranka,
S. (1992). Forecasting the behavior of multivariate
time series using neural networks. Neural networks,
5(6):961–970.
Chandola, V., Banerjee, A., and Kumar, V. (2009).
Anomaly detection: A survey. ACM computing sur-
veys (CSUR), 41(3):1–58.
Cohen, I., Huang, Y., Chen, J., Benesty, J., Benesty, J.,
Chen, J., Huang, Y., and Cohen, I. (2009). Pearson
RoLA: A Real-Time Online Lightweight Anomaly Detection System for Multivariate Time Series
321

correlation coefficient. Noise reduction in speech pro-
cessing, pages 1–4.
Deeplearning4j (2023). Introduction to core deeplearning4j
concepts. https://deeplearning4j.konduit.ai/. [Online;
accessed 24-February-2023].
Deng, A. and Hooi, B. (2021). Graph neural network-based
anomaly detection in multivariate time series. In Pro-
ceedings of the AAAI conference on artificial intelli-
gence, volume 35, pages 4027–4035.
EarlyStopping (2023). What is early stopping? https://
deeplearning4j.konduit.ai/. [Online; accessed 24-
February-2023].
FONDRIEST
ENVIRONMENTAL (2023). Turner De-
signs C3 Submersible Fluorometer. https://www.fo
ndriest.com/turner-designs-c3-submersible-fluorom
eter.htm. [Online; accessed 23-February-2023].
Garg, N. (2013). Apache kafka. Packt Publishing Birming-
ham, UK.
Hochreiter, S. and Schmidhuber, J. (1997). Long short-term
memory. Neural computation, 9(8):1735–1780.
Hundman, K., Constantinou, V., Laporte, C., Colwell,
I., and Soderstrom, T. (2018). Detecting space-
craft anomalies using lstms and nonparametric dy-
namic thresholding. In Proceedings of the 24th ACM
SIGKDD international conference on knowledge dis-
covery & data mining, pages 387–395.
King, A. L., Sørensen, K., Jaccard, P., and Mengeot, C.
(2021). One ocean expedition - leg 2 - underway fer-
rybox. http://metadata.nmdc.no/metadata-api/landing
page/d508ffaf5ba3ba8618e25ad83686db75. [Online:
accessed 23-February-2023].
Knoblauch, F. M. (2022). Measurement of wave properties
with a custom built sensor system as part of the one
ocean expedition (2021-2023): Technical aspects and
post processing of field data. Master’s thesis.
Laxhammar, R. and Falkman, G. (2013). Online learning
and sequential anomaly detection in trajectories. IEEE
transactions on pattern analysis and machine intelli-
gence, 36(6):1158–1173.
Lee, M.-C. and Lin, J.-C. (2023). RePAD2: Real-time,
lightweight, and adaptive anomaly detection for open-
ended time series. In Proceedings of the 8th Inter-
national Conference on Internet of Things, Big Data
and Security - IoTBDS, pages 208–217. INSTICC,
SciTePress. arXiv preprint arXiv:2303.00409.
Lee, M.-C., Lin, J.-C., and Gan, E. G. (2020a). ReRe: A
lightweight real-time ready-to-go anomaly detection
approach for time series. In 2020 IEEE 44th Annual
Computers, Software, and Applications Conference
(COMPSAC), pages 322–327. IEEE. arXiv preprint
arXiv:2004.02319.
Lee, M.-C., Lin, J.-C., and Gran, E. G. (2020b). RePAD:
real-time proactive anomaly detection for time series.
In Advanced Information Networking and Applica-
tions: Proceedings of the 34th International Confer-
ence on Advanced Information Networking and Ap-
plications (AINA-2020), pages 1291–1302. Springer.
arXiv preprint arXiv:2001.08922.
Lee, M.-C., Lin, J.-C., and Gran, E. G. (2021). How far
should we look back to achieve effective real-time
time-series anomaly detection? In Advanced Infor-
mation Networking and Applications: Proceedings of
the 35th International Conference on Advanced In-
formation Networking and Applications (AINA-2021),
Volume 1, pages 136–148. Springer. arXiv preprint
arXiv:2102.06560.
Pang, G. and Aggarwal, C. (2021). Toward explainable
deep anomaly detection. In Proceedings of the 27th
ACM SIGKDD Conference on Knowledge Discovery
& Data Mining, pages 4056–4057.
Ren, H., Xu, B., Wang, Y., Yi, C., Huang, C., Kou, X., Xing,
T., Yang, M., Tong, J., and Zhang, Q. (2019). Time-
series anomaly detection service at microsoft. In Pro-
ceedings of the 25th ACM SIGKDD international con-
ference on knowledge discovery & data mining, pages
3009–3017.
Rettig, L., Khayati, M., Cudr
´
e-Mauroux, P., and
Pi
´
orkowski, M. (2019). Online anomaly detection
over big data streams. Applied Data Science: Lessons
Learned for the Data-Driven Business, pages 289–
312.
Schroeder, F., Mizerkowski, B., and Petersen, W. (2008).
The pocketferrybox–a new portable device for water
quality monitoring in oceans and rivers. Journal of
Operational Oceanography, 1(2):51–57.
SEA.BIRD
Scientific (2023). SBE45 MicroTSG Thermos-
alinograph. https://www.seabird.com/sbe45-micro
tsg-thermosalinograph/product?id=54627900541.
[Online; accessed 23-February-2023].
Su, Y., Zhao, Y., Niu, C., Liu, R., Sun, W., and Pei, D.
(2019). Robust anomaly detection for multivariate
time series through stßochastic recurrent neural net-
work. In Proceedings of the 25th ACM SIGKDD inter-
national conference on knowledge discovery & data
mining, pages 2828–2837.
Wu, W., He, L., Lin, W., Su, Y., Cui, Y., Maple, C., and
Jarvis, S. (2020). Developing an unsupervised real-
time anomaly detection scheme for time series with
multi-seasonality. IEEE Transactions on Knowledge
and Data Engineering, 34(9):4147–4160.
Yao, Y., Sharma, A., Golubchik, L., and Govindan, R.
(2010). Online anomaly detection for sensor systems:
A simple and efficient approach. Performance Evalu-
ation, 67(11):1059–1075.
Zhao, H., Wang, Y., Duan, J., Huang, C., Cao, D., Tong, Y.,
Xu, B., Bai, J., Tong, J., and Zhang, Q. (2020). Multi-
variate time-series anomaly detection via graph atten-
tion network. In 2020 IEEE International Conference
on Data Mining (ICDM), pages 841–850. IEEE.
ICSOFT 2023 - 18th International Conference on Software Technologies
322
