
Inspect-GPU: A Software to Evaluate Performance Characteristics of
CUDA Kernels Using Microbenchmarks and Regression Models
Gargi Alavani
a
and Santonu Sarkar
b
Dept. of CSIS, BITS Pilani K. K Birla Goa Campus, India
Keywords:
Microbenchmarking, GPU Computing, CUDA, Performance.
Abstract:
While GPUs are popular for High-Performance Computing(HPC) applications, the available literature is inad-
equate for understanding the architectural characteristics and quantifying performance parameters of NVIDIA
GPUs. This paper proposes “Inspect-GPU”, a software that uses a set of novel, architecture-agnostic mi-
crobenchmarks, and a set of architecture-specific regression models to quantify instruction latency, peakwarp
and throughput of a CUDA kernel for a particular NVIDIA GPU architecture. Though memory access is
critical for GPU performance, memory instruction execution details, such as its runtime throughput, are not
revealed. We have developed a memory throughput model providing unpublished crucial insights. Inspect-
GPU builds this throughput model for a particular GPU architecture. Inspect-GPU has been tested on multiple
GPU architectures: Kepler, Maxwell, Pascal, and Volta. We have demonstrated the efficacy of our approach by
comparing it with two popular performance analysis models. Using the results from Inspect-GPU, developers
can analyze their CUDA applications, apply optimization, and model GPU architecture and its performance.
1 INTRODUCTION
Over the last decade, Graphics Processing Unit
(GPU) has emerged as a general-purpose computing
machine. In this paper we propose “Inspect-GPU”,
a toolchain that analyzes various instruction sets of
NVIDIA GPUs to compute several properties such as
latency, throughput, and peak warp values using a set
of microbenchmarks. A microbenchmark is a tiny
unit of code, designed to analyze a GPU operation.
By measuring the performance of this code unit, one
can estimate the latency, and throughput of this oper-
ation, which are not documented or disclosed by the
vendor. As a case in point, the vendor typically pub-
lishes theoretical peak performance, and this may not
be very useful when we want to understand the ac-
tual performance of an application. On the contrary,
if these estimates derived through microbenchmark-
ing are reasonably accurate, they can be a valuable
input to build a complex performance model (Resios,
2011; Kandiah et al., 2021). This, in turn, can help
practitioners in discovering the performance charac-
teristics of a GPU architecture. Inspect-GPU results
can be used to gain insights into the GPU code for
a
https://orcid.org/0000-0003-2758-4694
b
https://orcid.org/0000-0001-9470-7012
performance estimation, code optimization for perfor-
mance, simulation, and so on.
Several studies have estimated the latency, and
throughput of instructions on older architectures (Re-
sios, 2011; Wong et al., 2010; Volkov, 2016). How-
ever, with every new architecture introduced, its in-
struction execution characteristics (latency, through-
put etc.) may vary from its predecessor. In this paper,
we have used Inspect-GPU to analyze four NVIDIA
GPU architectures namely Tesla K20, Quadro K4200,
Tesla M60, and GTX1050. Noteworthy innovations
of Inspect-GPU are as follows:
• We have developed microbenchmarks that
Inspect-GPU uses to calculate the peak per-
formance values of computing instructions
belonging to the PTX instruction set.
• We have proposed a novel empirical model to es-
timate kernel launch overhead which has a signif-
icant impact on the performance of the kernel.
• Contrary to the existing approaches, we propose a
new global memory latency model to predict the
latency of instruction based on access stride.
• We propose a novel exponential model for global
and shared memory throughput estimation.
• We did not find any approach to estimate the min-
imum number of ready warps required to achieve
Alavani, G. and Sarkar, S.
Inspect-GPU: A Software to Evaluate Performance Characteristics of CUDA Kernels Using Microbenchmarks and Regression Models.
DOI: 10.5220/0012079200003538
In Proceedings of the 18th International Conference on Software Technologies (ICSOFT 2023), pages 59-70
ISBN: 978-989-758-665-1; ISSN: 2184-2833
Copyright
c
2023 by SCITEPRESS – Science and Technology Publications, Lda. Under CC license (CC BY-NC-ND 4.0)
59

peak throughput. We propose an approach to esti-
mate this peakwarp value.
We have compared our approach with two popu-
lar performance modeling approaches, namely the
Roofline model and the approach proposed by Volkov
et al (Volkov, 2016). We demonstrated that the esti-
mation using Inspect-GPU is more accurate than these
two methods. The remainder of the paper is orga-
nized as follows. Section 3 describes the basics of
GPU architecture, CUDA programming model, and
PTX ISA. Section 4 provides details of microbench-
marks designed for computing instructions. Section 5
presents the approaches used to design microbench-
marks for memory instruction. In section 6, we quan-
tified kernel launch overhead using a linear regression
model. Section 7 discusses the approaches used for
checking the efficacy of the global memory through-
put model. Section 9 presents the related work. Sec-
tion 10 concludes this work and discusses future di-
rections.
2 INSPECT-GPU OVERVIEW
Inspect-GPU is a tool that uses a set of microbench-
marks that evaluate different GPU instructions and
quantify their performance. The tool is GPU archi-
tecture agnostic. Once it is installed and executed,
the tool invokes multiple microbenchmarks, executes
them on the target GPU, collects the profile data, and
then generates the regression models, as depicted in
Figure 1). The “ModelGenerator” component gener-
ates these models from the profile data using PyCaret
(Ali, 2020) library which is typically used to auto-
mate training and model management. In particular,
we used PyCaret to create a regression model, tune
the hyperparameters of a model, and evaluate model
errors to choose the best model for our micro bench-
marking dataset.
In the rest of the paper, we describe the key ele-
ments of each module of Inspect-GPU. First, we dis-
cuss GPU architecture and performance characteris-
tics we want to estimate, to set the context.
3 GPU ARCHITECTURE AND
PERFORMANCE
CHARACTERISTICS
GPU architecture offers multiple memory options
such as global, shared, constant, and texture which
developers can utilize as per applications demand.
CUDA kernel which executes on GPU is launched us-
Figure 1: Inspect GPU Overview.
ing the number of blocks (nB) and number of threads
per block (nT_b) The CUDA cores have access to pri-
vate registers allocated from a register file. The shared
memory is assigned to a block, and the global mem-
ory space is within a grid. Hence, threads within a
block can share data using shared memory, but to ac-
cess data across blocks, the data must be accessed
from global memory. NVIDIA GPUs can be pro-
grammed using CUDA (Compute Unified Device Ar-
chitecture) for GPGPU applications. CUDA provides
a device abstraction by defining a logical architecture
of the device, which remains unchanged even when
the GPU is changed
1
. CUDA allows programmers
to manipulate various GPU memories.
The CUDA code is first compiled into user-
readable “intermediate Parallel Thread Execution”
2
(PTX) code, which is then converted into native code
executed on GPU architecture. PTX instructions are
backed by a stable instruction set architecture (ISA),
that spans across multiple GPU generations, and it
is the last level user-understandable ISA (Resios,
2011). PTX codes have been used extensively for
architecture-level analysis. We have considered PTX
codes as the basis for performance analysis.
There are three important characteristics of an in-
struction that influence its performance, namely:
Latency (L): Total time a single instruction takes to
execute.
Throughput (T P ): Number of instructions exe-
cuted per cycle per SM.
1
https://docs.nvidia.com/cuda/cuda-c-programming-
guide/
2
https://docs.nvidia.com/cuda/parallel-thread-
execution/index.html
ICSOFT 2023 - 18th International Conference on Software Technologies
60
Peakwarps (P W ): The minimum number of con-
currently executing warps required to achieve
peak throughput.
While latency and throughput are well-established
performance characteristics, we propose a new metric
called peakwarps to model the level of maximal par-
allelism, at which peak throughput is obtained. There
will be no increase in throughput value beyond this
point (peakwarps) even if we continue to increase the
number of warps. While computing the performance
of instruction this peakwarps value can be used as a
performance cap (Resios, 2011) for computing the de-
lay (in clock cycles) by an instruction.
The types of PTX instructions considered in
Inspect-GPU are computing instructions and memory
access instructions. The details on how these perfor-
mance characteristics are obtained for CUDA instruc-
tions are explained in the following sections.
4 COMPUTING INSTRUCTIONS
Computing instructions are arithmetic and logical in-
structions which can be integer operations ( such as
add, mul), floating point operations (such as fma),
or special instructions (such as sqrt). We have devel-
oped microbenchmarks to compute latency, through-
put, and peakwarps for computing instruction.
The approach followed by designing a latency
computation benchmark (for a computing instruction)
in Inspect-GPU is straightforward.The “uBenchExe-
cuter(Compute)” module shown in Figure 1 launches
a single thread with two dependent instructions of the
same instruction type to ensure that the GPU cannot
issue the next instruction until the previous instruc-
tion has finished. Before executing instructions, the
start time T
s
is recorded. Then a set of 256 instruc-
tions are executed to ensure that the total execution
time is substantial enough to be recorded. uBenchEx-
ecuter records the time after the execution T
e
and mea-
sures the execution time T = T
e
− T
s
. This process
is repeated N times and the execution time of each
run (T
tot
+ = T ) are accumulated. Finally, the mod-
ule computes the average latency of the instruction as
L =
T
tot
2∗256∗N
.
Throughput and peakwarps value estimation pro-
cesses are relatively more complex than latency
computation since instruction level parallelism (ILP)
plays an important role here. For Kepler architecture,
one must consider that in a clock cycle, two dispatch-
ers of a warp scheduler cannot dispatch instructions
from different warps. They can only execute inde-
pendent instruction from the same warp. In the ab-
sence of any independent instructions, it was observed
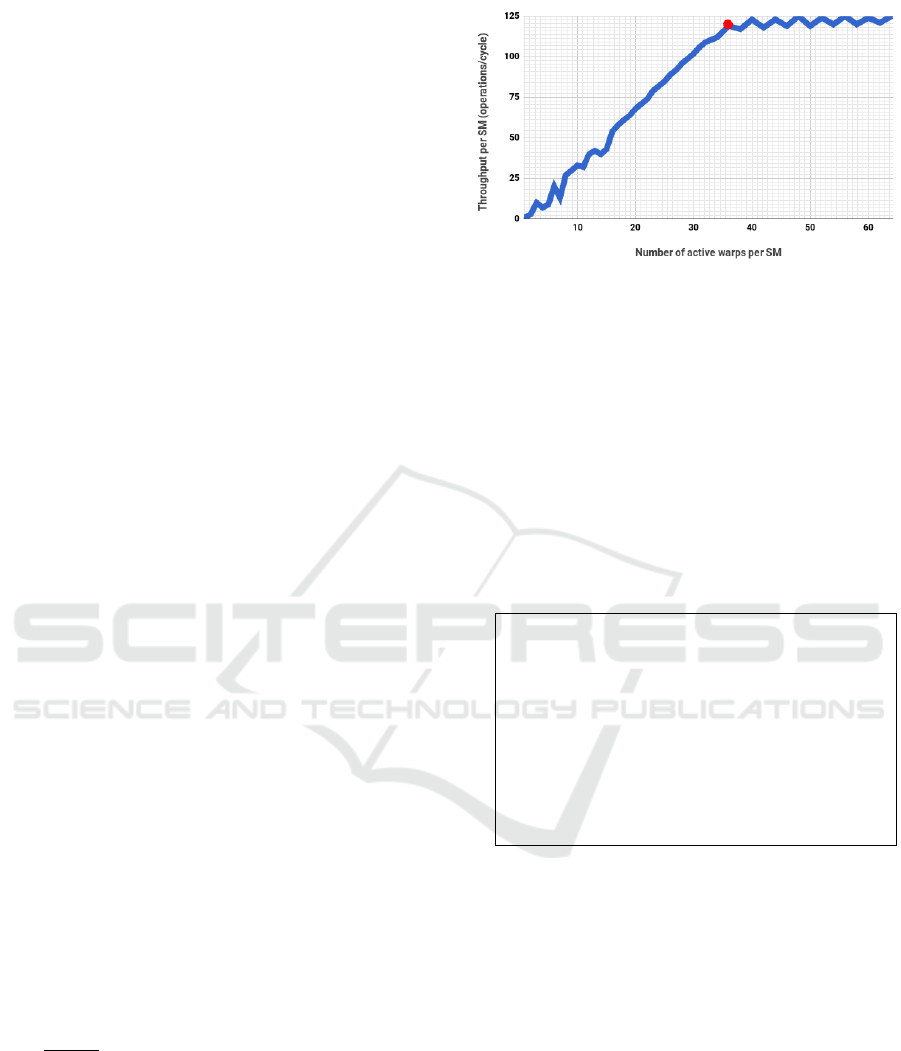
Figure 2: Throughput for fma with ILP=1.
that throughput saturates after a certain Thread Level
Parallelism(TLP) value. To get a further increase in
throughput, we need independent instructions inside
the CUDA kernel available to each scheduler. This
can be achieved by adding independent instructions
in the kernel; with every new independent instruction,
the ILP value is raised by 1. The set of instructions
for ILP 1, ILP 2, and ILP 3 shown below, explains
this approach.
ILP=1 Instructions: b+=a; a+=b;
ILP=2 Instructions: b+=a; a+=b; c+=d; d+=c;
ILP=3 Instructions: b+=a; a+=b; c+=d; d+=c; e+=f;
f+=e;
1 _ _ g l o b a l _ _ v o i d t h r o u g h p u t _ k e r n e l ( i n t
*
dummy )
{
2 / / i n i t i a l i z a t i o n o f p a r a m e t e r s
3 i n t j = b l o c k I d x . x
*
blockDim . x + t h r e a d I d x . x
+ blo ckDim . x
*
t h r e a d I d x . y ;
4 f o r ( i n t i =0; i < i n n e r L o o p I t e r ; i ++ ) {
5 r e p e a t 2 5 6 ( b+= a ; a+=b ; ) ;
6 }
7 dummy [ j ] = b+a ; / / s t o r e r e s u l t s t o a v o i d
c o m p i l e r o p t i m i z a t i o n
8 }
Listing 1: throughput_kernel.
For illustration, the CUDA kernel snippet for adds
instruction is shown in listing 1 for ILP 1. This ker-
nel is invoked from the main program shown in list-
ing 2 to compute throughput for this instruction. The
adds instruction is invoked multiple times in listing
1 (line 7). An important observation is that the peak
throughput and the number of active warps required to
achieve peak throughput differ for different ILP val-
ues. To characterize this phenomenon, Inspect-GPU
executes this benchmark with different ILP values.
For each ILP, Inspect-GPU creates a different version
of the kernel in listing 1 by altering line 6 with the
code for the corresponding ILP (shown above), keep-
ing the rest of the code in listing 1 and listing 2 the
same.
Inspect-GPU: A Software to Evaluate Performance Characteristics of CUDA Kernels Using Microbenchmarks and Regression Models
61

Table 1: Data collected for computing throughput for dif-
ferent ILP values.
Instruction ILP Data Points Throughput Standard Deviation
adds 1 20 120 4.17
adds 2 26 127 4.009
adds 3 28 136 6.5953
divf 1 24 1.066 0.1851
divf 2 24 1 0.1595
divf 3 23 1.02 0.1773
sqrt 1 26 3.48 0.6589
sqrt 2 26 3.19 0.5842
sqrt 3 26 3.2 0.6589
4.1 Generated Dataset
The throughput and peakwarp computation process
implemented in uBenchExecute(Compute) module
for different ILP values for each compute instruction
(such as adds). To compute these metrics the dataset
is generated as follows.
For each ILP, execute the corresponding version
of the kernel. The throughput_func code in Listing
2 is called by increasing the number of active warps
launched to generate a dataset D. A snapshot of the
dataset summary is shown in Table 1. For instance,
the first row of this table indicates that for 20 data
points after active warps>peakwarp for adds instruc-
tion with ILP=1, we observed the average throughput
to be 120 per cycle, with a standard deviation of 4.17.
Here standard deviation depicts no significant change
in throughput after reaching the peakwarp. 1.
The throughput and peakwarp computation proces
is summarized below:
1. Design multiple versions of a throughput compu-
tation kernel, for each ILP.
2. For each ILP, execute the corresponding version
of the kernel and collect the dataset D as described
above.
For a particular ILP and a compute instruction, let
D(w) be the throughput per cycle the active warp
w, obtained from the dataset D.
We define the peakwarp as
P W = min{w | | D(w) − D(w
′
) |> ε, ∀w
′
∈ W }
This metric is a minor modification of the stan-
dard argmax function where a small positive
threshold hyperparameter ε is used to ignore mi-
nor variations in throughput values from the max-
imum (using ε). As seen in Figure 2, P W (high-
lighted as a red dot) is the warp value present on
the x-axis of the red dot. Note that the throughput
value starts oscillating after this highlighted point.
This metric is computed by “PeakWarp Generator”
module from D that has a set of active warps W , and
for each w ∈ W , there is a corresponding throughput
per cycle t put = D(w).
In order to execute the benchmark programs for
measurement, Inspect-GPU takes the following steps
to avoid quantification errors.
• Compiler optimization has been disabled to zero
level to avoid undesirable optimizations done
even at zero level, results of GPU kernel execu-
tion were stored in dummy variables as shown in
listing 1. The use of dummy variables to avoid
compiler-level optimization is a common prac-
tice in designing microbenchmarks (Hristea et al.,
1997; Papadopoulou et al., 2009).
• Inspect-GPU ensured that only one single thread
is executed for measuring the latency values
to avoid latency hiding due to parallelism, by
launching the latency kernel with only one thread
per block in one grid.
• While computing throughput values, Inspect-
GPU assures that occupancy of SM is always
above 90%. This was ensured by launching 256
threads per block per SM.
1 i n t t h r o u g h p u t _ f u n c ( dim3 Db , dim3 Dg ) {
2 c u daEventRec o r d ( s t a r t , 0 ) ;
3 t h r o u g h p u t _ k e r n e l <<<Dg , Db> > >(d_dummy ) ;
4 c u daEventRec o r d ( s t o p , 0 ) ;
c u d a E v e n t S y n c h r o n i z e ( s t o p ) ;
5 c u d aEventElapsedT i m e (& elaps e d T i m e , s t a r t ,
s t o p ) ; / / g e t d i f f e r e n c e o f s t a r t an d
s t o p
6 /
*
r e t u r n p e r u n i t t h r o u g h p u t u s i n g time ,
c l o c k
7 s p e e d o f GPU and o t h e r h a r d w a r e p a r a m e t e r s
*
/
8 r e t u r n t h r o u g h p u t _ p e r _ c y c l e ; }
Listing 2: PeakWarps Calculation Code.
Table 2: Tesla K20 Compute Instruction Summary.
Instruction L
Throughput (T P ) PeakWarps (P W )
ILP=1 ILP=2 ILP=3 ILP=1 ILP=2 ILP=3
addf,subf,mulf 9 122 128 167 36 20 18
adds,subs,and 9 120 127 136 36 20 18
fma 10 119 95 143 36 20 16
mads 20 31 28 25 20 10 8
muls 9 28 32 32 8 8 8
divs 424 2.35 2.5 2.36 32 32 32
divf 894.5 1.066 1.0 1.02 32 32 32
sqrt 359 3.48 3.19 3.2 40 40 40
setp 22 50 50 50 36 28 28
cvt 10 31 31 31 12 12 12
mov 2 150 N/A N/A 32 N/A N/A
4.2 Computing Instruction Latency
Results
The latency values obtained by uBenchmarkExecu-
tor(Compute) component using microbenchmarks are
present in the second column of Table 2. As seen in
Table 2, a significant difference is observed in the re-
sults obtained by varying ILP values for each type
of instruction. In an ideal scenario, in Tesla K20
ICSOFT 2023 - 18th International Conference on Software Technologies
62

Table 3: Measured PTX instruction latencies L.
NVIDIA GPU -> Quadro K4200 Tesla K20 Tesla M60 GTX 1050 Tesla V100
Architecture -> Kepler Kepler Maxwell Pascal Volta
addf 10 9 15 15 15
adds 9 9 15 15 15
subf 10 9 15 15 15
subs 10 9 15 15 15
mulf 9 9 15 15 15
muls 9 9 86 86 15
and 9 9 15 15 15
fma 9 10 188 12 232
mads 18 20 100 15 30
divf 1252 894.5 1278 1398 977
divs 418 424 1026 503 815
cvt 33 10 195 195 218
sqrt 440 359 550 481 487
setp 22 22 30 30 30
mov 2 2 51 55 49
shared load & store 40 47 38 39 39
SM with four warp schedulers with two instruction
dispatchers, 256 instructions can be dispatched every
cycle. Observed throughput value without indepen-
dent instructions (e.g. 120 adds, subs instruction per
cycle for ILP=1) suggests that at least a few of the
dispatchers may remain underutilized due to the non-
availability of independent instruction from the same
warp. We also observed that incrementing ILP after
3 (for most of the instructions) does not significantly
affect throughput, which can be correlated to the fact
that both the dispatch units of the scheduler are get-
ting fully utilized if there are more than three inde-
pendent instructions available. We present the latency
of computing instructions across multiple GPU archi-
tectures calculated by Inspect-GPU in Table 3.
Our observed results for computing instructions
were validated against other existing studies (Arafa
et al., 2019; Cornelis and Lemeire, 2019). Through-
put values were found to be close to the theoretical
ones for compute capability 3.5, as mentioned
3
.
5 MEMORY INSTRUCTIONS
NVIDIA GPU offers multiple memory options, such
as global, shared, constant, and texture. Inspect-GPU
focuses on only global and shared memory instruc-
tions in the current work. We have developed mi-
crobenchmarks for quantifying latency and through-
put of global and shared memory instructions. We
will consider constant and texture memory as a future
extension in Inspect-GPU.
Latency for accessing global memory instructions
(global load and store) depends upon the amount of
data being accessed at a particular moment to account
for the additional waiting time due to resource con-
straints. Due to its high latency value, global mem-
ory access heavily influences the execution time of a
CUDA kernel. Therefore, it is crucial to accurately
3
https://docs.nvidia.com/cuda/cuda-c-programming-
guide/
estimate the latency value of global memory access
for a useful execution time prediction(Hong and Kim,
2009; Resios, 2011).
Among the wide variety of existing approaches,
pointer-chasing based microbenchmarking is consid-
ered an accurate and popular approach to measure
memory instruction latency.
5.1 Pointer Chasing
A pointer-chasing microbenchmark, first introduced
by Saavedra et al. (Saavedra-Barrera, 1992) for
CPUs, initializes a set of array elements with the in-
dex of the next memory access. The distance between
two consecutive memory accesses is called stride size.
The latency of memory access is the time difference
in clock cycles between the memory access issue and
the data availability in the processor register. In the
pointer-chasing experiment, the complete array is tra-
versed sequentially to record the average memory ac-
cess latency. This approach was adapted for GPUs as
well (Wong et al., 2010; R. Meltzer and Cecka, 2013).
We have modified the approach by (R. Meltzer and
Cecka, 2013) for latency computation of GPU mem-
ory instructions.
5.2 Global Memory Pointer Chasing
The pointer chasing algorithm for GPU is presented
in Algorithm 1 for the host (CPU) and Algorithm 2
for the device. In the host algorithm, the array is ini-
tialized with stride values then the kernel code is in-
voked. Inside kernel code in the device algorithm, the
start time and end time of the memory access instruc-
tion with the pointer chasing approach is recorded. In
line 5 of Algorithm 2, we ensure that the next memory
instruction is not executed until the previous instruc-
tion is complete. Hence, this approach can record
the number of cycles utilized for executing one sin-
gle memory instruction. An iterator is used to execute
the instruction a large number of times to ensure the
latency is not too small to be measurable. We store the
value of j in a dummy variable to avoid any compiler-
level optimization.
Algorithm 1: Memory Latency Host (CPU).
1: initialize stride
2: for k= 0 to N do
3: h_arr[k]=(k+stride) % N;
4: end for
5: Copy host array (h_array) to device ( d_arr)
6: memLatKernel«<Dg, Db»>(d_dummy, d_arr); ▷ Call
Latency Kernel
Inspect-GPU: A Software to Evaluate Performance Characteristics of CUDA Kernels Using Microbenchmarks and Regression Models
63
Algorithm 2: Memory Latency Device (GPU).
1: procedure GMMEMLATKER-
NEL(d_dummy, d_array)
2: start_time = clock();
3: initialise j=0;
4: for it=0 to iteration do
5: j=d_arr[j] ;
6: end for
7: end_time = clock();
8: d_dummy =j;
9: latency =
(end_time − start_time)
iteration
▷ average
memory latency
10: end procedure
5.3 Global Memory Latency Model
We observed that in existing studies, the reported la-
tency value for global memory instructions is above
400 cycles for a Kepler architecture (Kothapalli et al.,
2009; Mei and Chu, 2017). However, our pointer
chasing microbenchmark on Tesla K20 reported the
average reported latency 221! If we use the high
value reported in the literature (e.g. 580 as mentioned
in (Kothapalli et al., 2009)), the resultant prediction
model can be a gross overestimation. We further no-
ticed that the latency value is dependent on launch pa-
rameters, hence it is not fixed. This observation led to
the building of a regression model for global mem-
ory latency which computes observed latency based
on launch parameters. This will ensure that based on
the launch configuration, the latency value will vary
from the lowest to the maximum observed latency.
5.3.1 Data Collection
uBenchExector(Global Memory) module launches
the microbenchmark discussed earlier repeatedly to
record global load/store instruction latency by vary-
ing its launch parameters (nB, nT _b). Inspect-GPU
ensured that it measured the average time taken to ex-
ecute one instruction per thread by varying the num-
ber of threads scheduled. While recording the latency,
While executing Inspect-GPU, one needs to disable
the caching of data for memory instructions. Inspect-
GPU collected a significant number of data points to
represent the wide range of latency values observed.
Each data point was collected by taking an average
of recorded time. Each data point has the following
attributes : Stride of access and latency. We have pre-
sented few sample points in Table 4.
1. Recorded latency values were plotted against the
stride of access (nT _b ×nB). As seen in Figure 3,
the plot is non-linear. There are three breakpoints,
each delimiting two linear relationships.
Table 4: Sample data for global memory latency data.
Grid Size Block Size Stride (nT* nB) Latency
2 256 256 226
4 128 512 233
8 1024 8192 291
32 512 16,384 329
175 1024 1,79,200 339
Table 5: Global Memory load/store Latency Model for
Tesla K20 GPU.
Stride Interval Parameter Values
nT_b*nB <4096 a = 0.02828, b = 220
4096<nT_b*nB <24576 a = 0.00478, b = 251.7
24576<nT _b ∗ nB <991232 a = 0.000168, b = 307.8
991232<nT_b*nB <2203648 a = −0.0000253, b = 501.8
2. A piecewise linear regression model of the form
L = a ·nT _b·nB+b fits the best. Table 5, presents
the four equations for the linear regression model.
The Inspect-GPU latency model’s evaluation metrics
were MSE: 22.95, RMSE: 4.79, R-Square: 0.99,
RSS: 32801.69, and RSS: 4.80.
5.4 Shared Memory Access Latency
Shared memory is a non-cached memory shared
amongst threads within a block. Its latency is much
lower than global memory instructions because of its
chip location (each SM has a dedicated shared mem-
ory space). To avoid long latencies of global memory
access, application developers can move the data into
and out of shared memory from global memory be-
fore and after operation execution.
For shared memory, accesses are issued individu-
ally for each thread. We use the pointer chasing ap-
proach shown in Algorithm 3 for shared memory ac-
cess latency. The approach is similar to the global
memory pointer chasing method reported in Algo-
rithm 2. Here we declare a shared memory array
(shdata[]) which is first initialized with stride val-
ues. In line 8, pointer chasing is utilized to ensure
only one instruction per thread is executed.
Shared memory is divided into equally sized
memory modules called banks which are accessed si-
multaneously whereas global memory is accessed in
strides. The latency reported for global memory is
at least 100x higher than shared memory. The varia-
tions in the reported latency values for shared mem-
ory are very low compared to the variations in the
global memory. Therefore Inspect-GPU did not em-
ploy any regression model for shared memory. Re-
sults of shared memory latency recorded across ar-
chitectures are presented in the last row of Table 3.
The only case where shared memory latency can be
higher than normal is if there are bank conflicts (Mei
ICSOFT 2023 - 18th International Conference on Software Technologies
64

and Chu, 2017). Inspect-GPU will analyze the effect
of bank conflicts on shared memory in its future ex-
tension.
Algorithm 3: Shared Memory Kernel Algorithm.
1: procedure SMMEMLATKERNEL(d_dummy, d_array)
2: Declare shdata[] as shared memory array
3: for i=0 to N do
4: shdata[i] = d_array[i];
5: end for
6: start_time = clock(); initialise j=0;
7: for it=0 to iteration do
8: j=shdata[j] ;
9: end for
10: end_time = clock(); d_dummy =j;
11: latency =
(end_time − start_time)
iteration
▷ average
memory latency
12: end procedure
Figure 3: Piece-wise model for global instruction latency.
5.5 Global Memory Throughput Model
Memory throughput represents the number of mem-
ory instructions that perform data transfer within a
unit of time (represented in GB/s). If you use a static
value of memory throughput (vendor specification)
for performance modeling, the resultant model may
Figure 4: Kernel Launch Overhead.
Figure 5: Global Memory Throughput.
underestimate or overestimate the number of mem-
ory requests served in parallel. It is well known that
memory throughput cannot be quantified as a static
value for such applications. Its value is dependent on
the number of memory accesses, and CUDA kernel
launch parameters (Resios, 2011; Volkov, 2016). The
approach for throughput calculation differs from the
latency experiment since the strategy is to generate
a large number of memory requests in order to ob-
serve how many can be processed in parallel. Hence,
the microbenchmark is designed to generate a large
number of memory requests by varying the number
of threads launched.
1. Inspect-GPU collected the memory throughput
data (the rate at which data can be read or stored in
global memory) by running an application with global
load/store instructions. The kernel was launched with
different launch parameters (number of blocks and
number of threads per block) to ensure that through-
put is recorded by varying the number of global mem-
ory instructions(gm).
2. Inspect-GPU builds a model for the through-
put by attempting to fit linear, logarithmic, and ex-
ponential growth functions. R-square for each of
these models is tabulated in Table 6. From the re-
sult, PyCaret concluded that exponential growth func-
tion T P (gm) = a × (b − e
−c×ngM
) fits the best with
the highest R-square value and least RMSE value for
global memory transactions. This exponential growth
model is shown in Figure 5 for Tesla K20.
5.6 Shared Memory Throughput Model
Similar to global memory throughput behavior,
shared memory throughput grows by common fac-
tors over equal intervals. To model shared memory
throughput (T P (sm)) against the number of shared
memory load/store transactions (sm), Inspect-GPU’s
PyCaret tested with linear, logarithm, and exponential
growth models whose R-square values are provided
in Table 6. Amongst them, the exponential growth
Inspect-GPU: A Software to Evaluate Performance Characteristics of CUDA Kernels Using Microbenchmarks and Regression Models
65

Table 6: Goodness of fit of various statistical models.
Parameter
Linear Regression Logarithmic Growth Exponential Growth
R_square RMSE R_square RMSE R_square RMSE
Kernel Launch Overhead 0.9877 13.15 0.3240 97.5958 0.8398 47.95
Shared Memory Throughput 0.2472 181202.3 0.8360 83413.19 0.9782 41347.23
Global Memory Throughput 0.1896 23075.85 0.8798 8885.28 0.9528 5568.59
R_square RMSE
Cache Penalty 0.9045 3797.42
Table 7: Global & Shared Memory Throughput Models.
Architecture T P (gm) a, b,c values T P (sm) − a
′
, b
′
, c
′
Tesla K20 76363.8, 1.04,0.00021342 823761.8, 1,−0.000013830
Quadro K4200 68145.9, 1.03, −0.00027584 70628.9019, 1.03,−0.000301068
Tesla M60 71453.6, 1.22,−0.000033469 161899,1, −0.0000055295
GTX 1050 47244.33, 1,−0.001223 613743.6, 1.12, −0.00000694
model T P (sm) = a
′
× (b
′
− e
−c
′
×nsM
) produces the
maximum R-square value and the least RMSE value,
which ensures goodness of fit.
Inspect-GPU did not compute peakwarps for
global and shared memory instructions. Considering
the large latency of memory instructions, the peak-
warps value for these instructions will be very low
(<1) and may not be useful in performance prediction
as a performance cap (Volkov, 2016). The Inspect-
GPU throughput model based on runtime data is suf-
ficient to model memory instruction performance ac-
curately.
6 KERNEL LAUNCH OVERHEAD
A CUDA kernel execution time is impacted by the
time to launch a kernel in a GPU, defined here as
the kernel launch overhead. This is the time con-
sumed just before and after executing the kernel in-
structions. We have constructed an empirical model
to characterize this overhead. Inspect-GPU’s “Ker-
nelExecuter” module as shown in Figure 1, runs an
empty kernel (no instructions) with different configu-
rations(number of threads, threads per block) to col-
lect execution times of this empty kernel for differ-
ent launch parameters (number of threads, number of
blocks per thread).
1. Resios et al. (Resios, 2011) claimed that kernel
launch overhead could be modeled with constants
since its value does not change. However, from
empirical evidence, we discerned that the execu-
tion time of an empty kernel increases with an in-
crease in the number of threads being launched.
2. We built three statistical models to reproduce its
behavior and assessed them using the R-square
goodness of fit (shown in Table 6).
3. The plot of the linear regression model (for
Tesla K20 data), which gives maximum R-square
(0.9877), is depicted in Figure 4. Kernel Launch
Overhead ( l_overhead ) model for Tesla K20
GPU is 0.00002 · nB · nT _b + 1.4489. Similarly,
Inspect-GPU built the kernel launch overhead
model using linear regression for each GPU ar-
chitecture under study.
The code snippet is available in Listing 3.
1 /
*
empty , no i n s t r u c t i o n s
*
/ }
2 / / T h i s k e r n e l i s l a u n c h e d w i t h d i f f e r e n t
l a u n c h c o n f i g u r a t i o n s
3 em p tyKe rnel <<< b l o c k s P e r G r i d , t h r e a d s P e r B l o c k
> > >() ;
Listing 3: Kernel Launch Overhead.
7 EFFICACY OF GLOBAL
MEMORY THROUGHPUT
MODEL
The global memory throughput model presented in
this work is useful in understanding the performance
of GPU. Global memory instructions are one of the
most critical features in contributing to the perfor-
mance of a GPU. In order to prove the efficacy of the
Inspect-GPU’s throughput model, we undertake two
studies to analyze its efficacy, as discussed further.
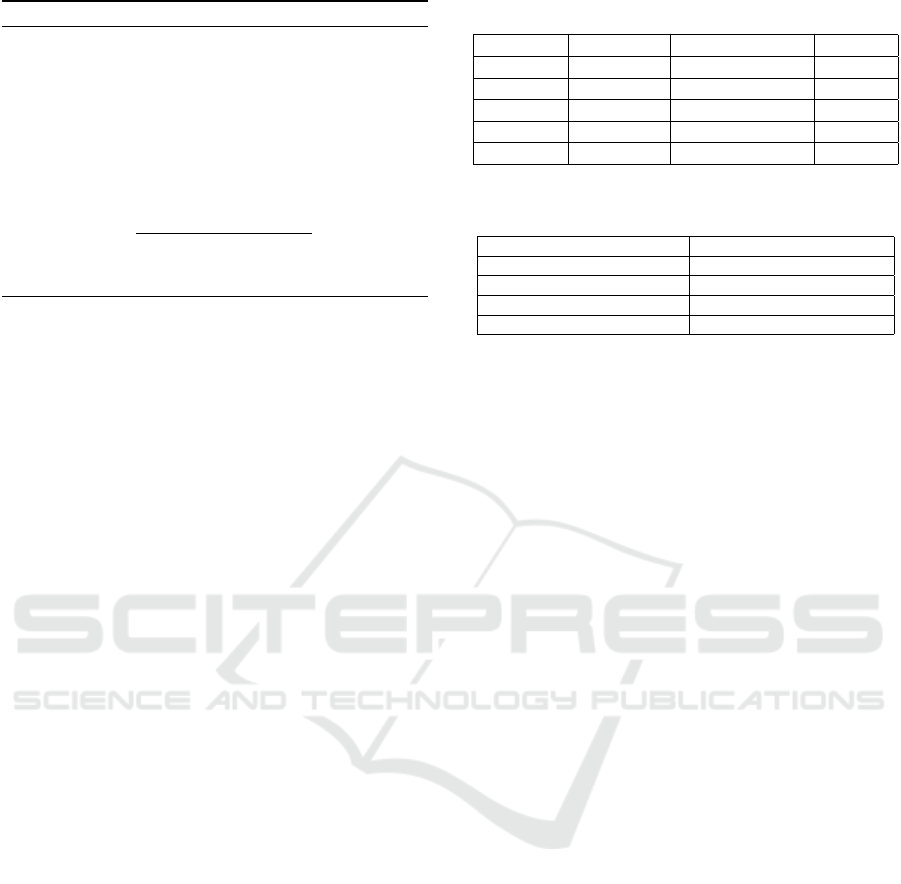
7.1 Comparison with the Throughput
Model by Volkov et al.
We compared Inspect-GPU’s global memory model
by comparing it against a popular model developed
by Volkov (Volkov, 2016; Volkov, 2018) which has
been used to predict performances against some other
existing approaches (Volkov, 2018). Volkov (Volkov,
2016)’s unit of throughput representation is IPC/SM,
where IPC is instruction per cycle. The following
steps were taken to compare our model with the
Volkov model:
1. We converted the actual throughput and through-
put computed using our model to IPC/SM. To do
so, we first convert the throughput in GB/s to B/s,
then divide this value by the number of bytes per
instruction (128 B) (Volkov, 2016) to get the num-
ber of instructions per second. To get the number
of instructions per cycle, we divide this value by
GPU clock frequency. Finally, to get IPC/SM, we
divide the number of instructions per Cycle by the
number of SMs on the GPU.
2. Volkov provides us per warp memory throughput
using an equation presented in their work (Volkov,
2016). We convert this throughput value to per
instruction by multiplying the number of threads
in a warp (32) to get IPC/SM. We plot the actual
throughput, throughput by our Inspect-GPU, and
the Volkov model in Fig. 6.
ICSOFT 2023 - 18th International Conference on Software Technologies
66
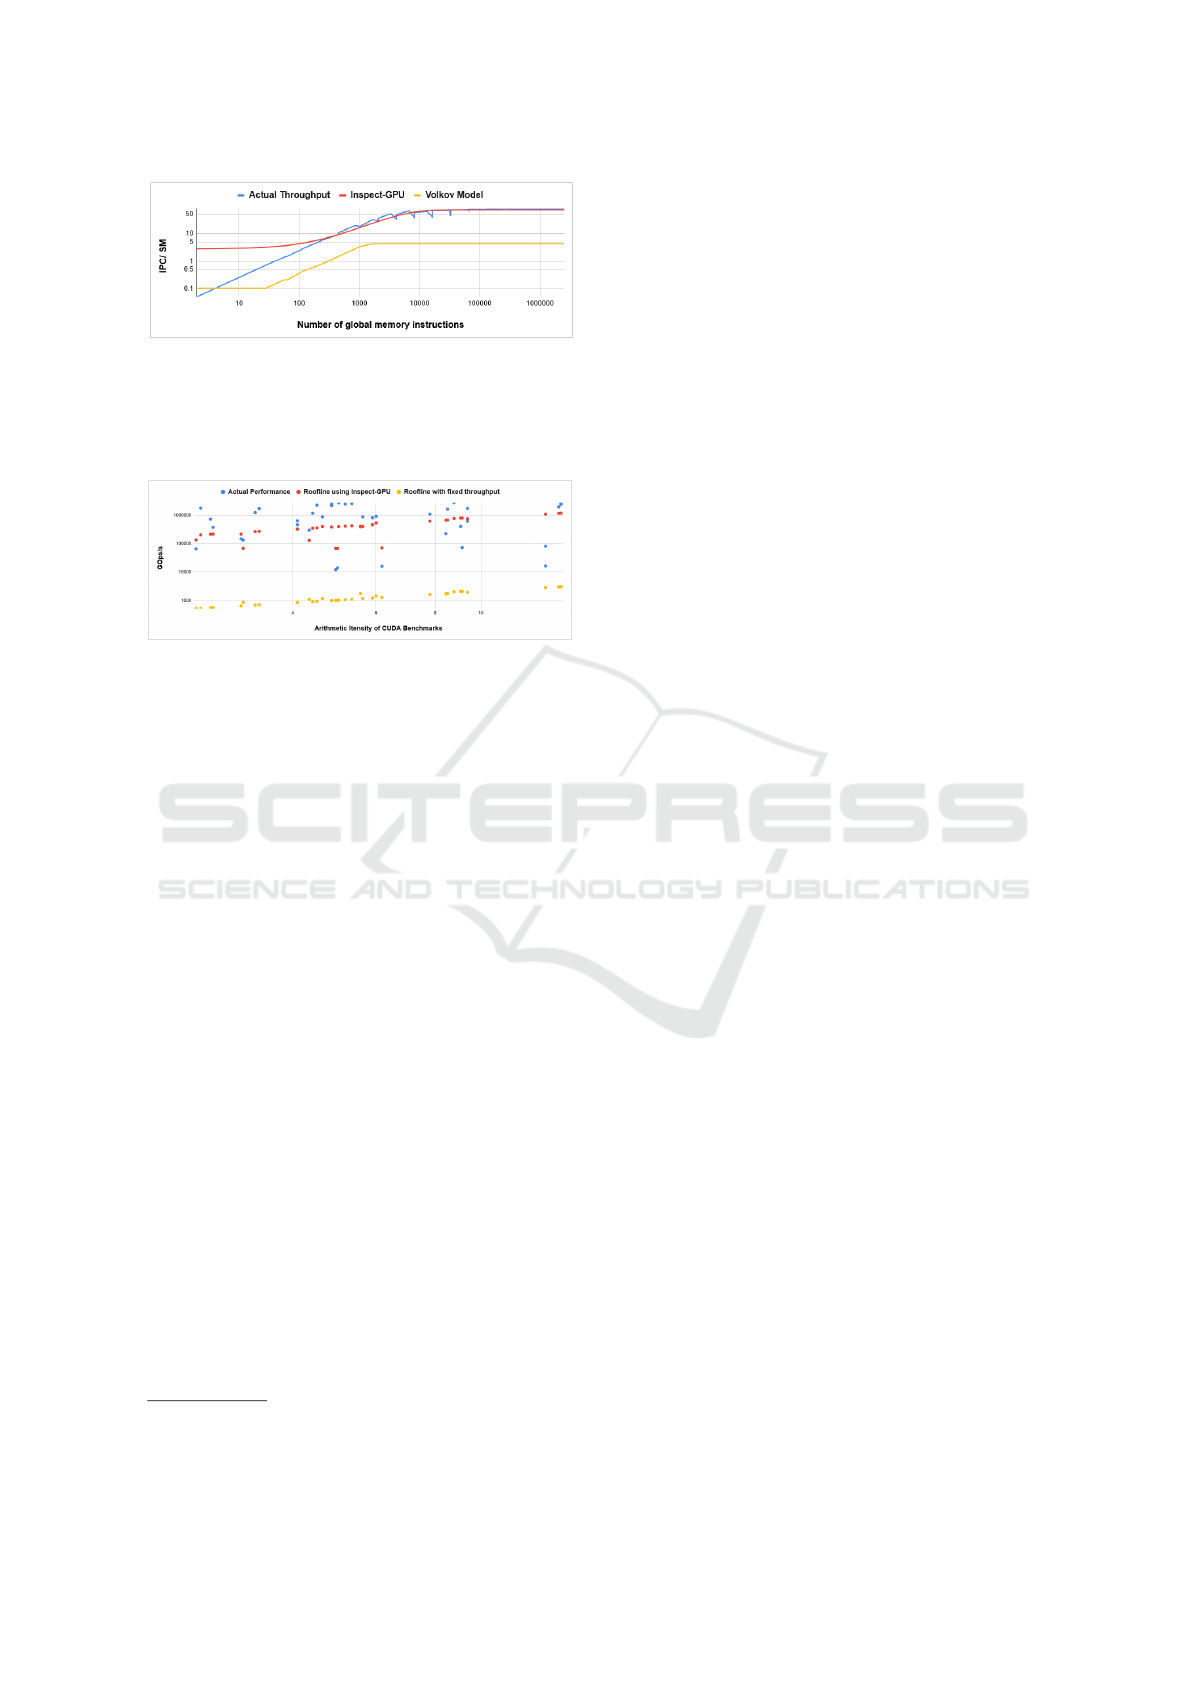
Figure 6: Inspect-GPU global memory throughput model
vs Volkov model.
7.2 Memory Throughput Model
Evaluation Using Roofline
Figure 7: Inspect-GPU based Roofline vs Fixed-throughput
based Roofline Comparison.
The Roofline model is used to relate applications
performance (P) and arithmetic intensity (I) to the
platform’s peak performance and memory bandwidth
(Konstantinidis and Cotronis, 2017). The Roofline
is a throughput-oriented performance model. Hence
we use the Roofline model to observe whether the
performance prediction using our memory through-
put model is close enough to actual performance. In
the Roofline model plot, the x-axis is the arithmetic
intensity, and the y-axis is performance. Both the
parameters are in log scale. The Roofline formula
P = min(π, I · β) is used to bound P (GOps/s) as a
function of machine peak performance (π), machine
peak bandwidth (β), and arithmetic intensity (I) of the
application.
We have used 39 CUDA kernels belonging
to NVIDIA CUDA Toolkit
4
and Rodinia Test-
bench(Che et al., 2009). For each benchmark, we
measure it’s actual performance, predicted perfor-
mance using the Roofline model, and predicted per-
formance using our approach. For each benchmark,
we first compute its arithmetic intensity I as the ra-
tio of the number of computing instructions and the
number of memory instructions. Next, we perform
the following for each benchmark:
• We use the throughput (bandwidth) (β) provided
in the vendor specification and compute perfor-
mance (P) using the Roofline formula for this
fixed throughput. Note that this performance us-
4
https://docs.nvidia.com/cuda/cuda-
samples/index.html
ing roofline is not the maximum roofline perfor-
mance since it is not based on actual observed
throughput.
• we compute β using Inspect-GPU global memory
throughput model, and calculate the predicted per-
formance using the Roofline formula.
• We calculate the benchmark’s actual performance
by dividing the total number of instructions by its
execution time (us) in GOps/s.
Each CUDA benchmark is represented by its arith-
metic intensity in Figure 7. Actual performance (blue
dot) and predicted performance for each benchmark
using our throughput model (red dot) and a theoretical
value (yellow dot) plotted against each benchmark’s
arithmetic intensity.
7.3 Key Takeaways
Let us consider the popular warp throughput model
proposed by Volkov et al. side by side with our ap-
proach. Since our model is an exponential one, we
notice that the predicted throughput (IPC/SM) of our
model is not close to the actual one when the number
of memory instructions accessed is small (Figure 6).
However, it is performing well as the number of in-
structions increases. Irrespective of the number of in-
structions accessed, the predicted throughput of our
model is closer to the actual one than the predicted
throughput by Volkov’s model. The main reason is
that the Inspect-GPU model is based on actual pro-
gram execution results. As the number of instruc-
tions increases, the number of instructions ready to
execute (whose data is fetched) increases, and hence
the throughput increases, which the Volkov model
couldn’t capture.
Next, let us consider another popular performance
prediction approach based on the Roofline model. As
shown in Figure 7, it is quite evident that the pre-
diction of performance using our memory through-
put model is closer to actual performance compared
to using theoretical throughput provided by Vendor.
The Roofline model is a simple performance predic-
tion model and may not capture all the complexities of
a multicore architecture like GPU. Many researchers
have modified this Roofline model to develop a ro-
bust model for performance prediction (Konstantini-
dis and Cotronis, 2017; Ding and Williams, 2019).
We use this Roofline model to demonstrate that using
the Inspect-GPU throughput, the performance predic-
tion is improved over using a fixed throughput pro-
vided in vendor specification ( Figure 7 ). It may be
noted that here we are using the Roofline formulation
as a mechanism to prove efficacy of our throughput
Inspect-GPU: A Software to Evaluate Performance Characteristics of CUDA Kernels Using Microbenchmarks and Regression Models
67

model; therefore this result should not be interpreted
as an critical evaluation of the roofline formulation
itself.
To develop a robust and accurate performance pre-
diction model, one requires more than one metric.
Additional metrics such as latency, throughput, con-
currency, launch overhead, latency hiding, resource
allocation, and so on, at various levels of granularity,
starting at the level of individual instruction up to the
entire application. To measure all these metrics, the
proposed approaches and results in Inspect-GPU will
effectively assist the researchers.
8 APPLICABILITY
Inspect GPU is a standalone tool today but it can be
used in multiple scenarios. We illustrate a few of the
usage possibilities.
8.1 Augmenting nvidia-smi
The NVIDIA System Management Interface (nvidia-
smi) is a command line utility which provides mon-
itoring and management capabilities for NVIDIA
GPUs. When a user executes nvidia-smi command, a
report is generated as XML or human readable plain
text to either standard output or a file. We can incor-
porate Inspect-GPU as a module of nvidia-smi where
once the command is run, it will execute the Inspect-
GPU to collect the microb-benchmarking details of
the GPU being analyzed. These microbenchmarking
results are exported by Inspect-GPU into a file gener-
ated in a folder .nvidiamicro in /usr/local/cuda/ loca-
tion.
8.2 Augmenting NVIDIA Nsight
NVIDIA Nsight
5
is another tool which can be used
by developers to analyze application’s performance
based on runtime data. Nsight also provides opti-
mization recommendations which help developers to
refactor their application and fix performance bottle-
necks. However, NVIDIA Nsight cannot execute in
absence of actual hardware. Since it is a eclipse based
tool, we can incorporate Inspect-GPU as a plugin in
NVIDIA Nsight, where it will be used as a one-time
analysis tool for collecting microbenchmarking data
for a particular GPU architecture. In our earlier pub-
lication (Alavani et al., 2021), we have created a plu-
gin for NVIDIA Nsight, where our tool predicts the
5
https://docs.nvidia.com/nsight-
compute/NsightCompute/index.html
power consumption of GPU application using static
analysis. Similarly, we can augment the capability
of NVIDIA Nsight with Inspect-GPU. Results of mi-
crobenchmarking will be generated and exported as a
file in a folder on the system. User and Nsight can
access these results for static as well as runtime appli-
cation analysis.
8.3 Execution Time Prediction
Performance prediction involves estimating the exe-
cution time of executable software or estimating val-
ues of other performance factors of a computing ma-
chine, such as instruction throughput, cache misses,
and so on. Using the microbenchmark results, one
can build an analytical model to predict the execution
time of a GPU kernel by analyzing the intermediate
PTX code of a CUDA kernel, without the need of ex-
ecuting it.
In our previous work on performance prediction
(Alavani and Sarkar, 2022), we used microbench-
marking data as a one time dynamic analysis for quan-
tifying instruction execution characteristics. These
instruction execution details collected using mi-
crobenchmarking is then utilized to schedule instruc-
tions based on hardware constraints. In future, re-
searchers can utilize Inspect-GPU as a module in
building such type of execution time prediction mod-
els.
9 RELATED WORK
Microbenchmarking is the key to peeping into the
GPU BlackBox, and it is an essential component
for building a good prediction model. Use of mi-
crobenchmarks to understand the nature of GPU in-
struction execution(Wong et al., 2010; Mei and Chu,
2017; Jia et al., 2018) has been well-recognized by
the research community for a long time. Researchers
have used microbenchmarking to gain insights into
modern Intel CPU architectures (Alappat et al., 2020).
We discuss here a few notable research endeavors that
use microbenchmarks extensively to analyze GPUs
performance (Lemeire et al., 2016), understanding
hardware characteristics (Wong et al., 2010) and ap-
plying it for assessing energy utilization (Lucas and
Juurlink, 2019).
Wong et al.(Wong et al., 2010) measured the la-
tency and throughput of different types of arithmetic
and logic operations performed in a kernel for Fermi
architecture GPU. They studied the functionality of
branch divergence and barrier synchronization, and
also measured the structure and performance of the
ICSOFT 2023 - 18th International Conference on Software Technologies
68

memory caching hierarchies. Lemeire et al. (Lemeire
et al., 2016) presented OpenCL microbenchmark
suite to gather performance characteristics of GPU.
The authors studied the influence of independent in-
structions within a kernel and thread divergence. An-
dersch et al. (Andersch et al., 2015) analyzed the
static and dynamic latency behavior of GPU microar-
chitectural components using the GPGPU-Sim GPU
timing simulator. They conclude that GPUs are not as
effective in latency hiding as believed to be, and sug-
gest that latency should be a significant GPU design
consideration besides throughput.
Abdelkhalik et al. (Abdelkhalik et al., 2022) pre-
sented an extensive microbenchmarking study for the
NVIDIA Ampere architecture. They measured the
latency for PTX ISA instructions and their SASS
ISA counterparts using microbenchmarks. While they
have covered many instructions in their study it is lim-
ited to Ampere architecture and latency computation.
They have not explored other aspects of instruction
performance such as throughput.
Arafa et al. (Arafa et al., 2019) introduced a
very low overhead and portable analysis for exposing
the latency of each instruction executing in the GPU
pipeline(s). They also presented the access overhead
of the various memory hierarchies found in GPUs
at the micro-architecture level for Kepler, Maxwell,
Pascal, Volta, and Turing. However, they have not
considered other performance characteristics such as
throughput and peakwarps. Recent studies have fo-
cused on profiling the tensor core in Volta and Turing
architectures (Markidis et al., 2018; Yan et al., 2020).
NVIDIA Nsight
6
is a tool that enables develop-
ers to build, debug, profile, and develop CUDA appli-
cations. Nsight’s application analysis report presents
metrics that address overall GPU utilization and per-
formance affected due to specific hardware charac-
teristics and recommends optimization actions to im-
prove application performance. We cannot perform a
one-to-one comparison of Inspect-GPU with NVIDIA
Nsight since:
• NVIDIA Nsight analyzes a benchmark appli-
cation, presents its bottlenecks, and suggests
optimization action. Inspect-GPU utilizes mi-
crobenchmarks that collect performance charac-
teristics for a particular instruction on a hardware.
• Inspect-GPU needs to be executed only once for a
particular GPU architecture. Captured results can
then be utilized to analyze multiple benchmarks
for the same GPU, for which the presence of the
GPU is not required. Nsight analyzes an appli-
6
https://docs.nvidia.com/nsight-
compute/NsightCompute/index.html
cation on the hardware every time one needs to
gather its performance results.
• Nsight provides the actual runtime analysis hence
the accuracy of measured metrics is high, and it
provides a detailed understanding of actual hard-
ware execution.
• Like Inspect-GPU, Nsight performs instruction
throughput analysis. However, Inspect-GPU uses
a prediction model for this purpose which can
be used anywhere without any requirement of a
GPU, unlike NSight.
Although there are existing microbenchmark
suites for NVIDIA GPUs (Wong et al., 2010), their re-
sults are based on an older Tesla architecture. Build-
ing a microbenchmark design that can be effectively
utilized across new architectures is crucial. We also
need a new set of microbenchmarks that can cap-
ture critical characteristics such as kernel launch over-
head, memory throughput, the effect of throughput for
different ILP values etc.
10 CONCLUSION
In this paper, we described Inspect-GPU, a toolchain
that uses a set of microbenchmarks to evaluate GPU
characteristics. We presented a deeper understanding
of the execution of computing instruction by quantify-
ing its performance in latency, throughput, and peak-
warps metrics. One of the novelties of this work is re-
porting the change in throughput and peakwarps with
different values of ILP for computing instructions.
We have also proposed a novel model for calculating
global memory latency, including microbenchmark-
ing and a piece-wise linear regression model, which
was not carried out in any other study to the best
of our knowledge. We also computed kernel launch
overhead and showed how it contributes to the GPU
application’s performance significantly. The memory
throughput prediction presented in this work is based
on an exponential model. We demonstrated the effi-
cacy of this model by comparing it with a well known
performance prediction model by Volkov and with an-
other well-known prediction based on the Roofline
model. The results of Inspect-GPU can be used for
optimization, simulation, modeling, and analysis of
GPU software and hardware
In the future, we would like to explore the mi-
crobenchmarking of all types of memory instructions
(texture, constant) in the GPU memory hierarchy, fo-
cusing on various access factors affecting memory in-
struction performance, such as uncoalesced access,
bank conflicts, and data races. We would also like
Inspect-GPU: A Software to Evaluate Performance Characteristics of CUDA Kernels Using Microbenchmarks and Regression Models
69

to perform an analysis of the GPU Cache hierarchy.
REFERENCES
Abdelkhalik, H., Arafa, Y., Santhi, N., and Badawy, A.-
H. A. (2022). Demystifying the nvidia ampere archi-
tecture through microbenchmarking and instruction-
level analysis. In IEEE High Performance Extreme
Computing Conference.
Alappat, C. L. et al. (2020). Understanding hpc benchmark
performance on intel broadwell and cascade lake pro-
cessors. In ISC High Performance Computing, pages
412–433. Springer International Publishing.
Alavani, G., Desai, J., and Sarkar, S. (2021). Gppt:
A power prediction tool for cuda applications. In
2021 36th IEEE/ACM International Conference on
Automated Software Engineering Workshops (ASEW),
pages 247–250. IEEE.
Alavani, G. and Sarkar, S. (2022). Performance modeling of
graphics processing unit application using static and
dynamic analysis. Concurrency and Computation:
Practice and Experience, 34(3):e6602.
Ali, M. (2020). PyCaret: An open source, low-code ma-
chine learning library in Python. PyCaret version 1.0.
Andersch, M., Lucas, J., LvLvarez-Mesa, M. A., and Ju-
urlink, B. (2015). On latency in gpu throughput mi-
croarchitectures. In International Symposium on Per-
formance Analysis of Systems and Software (ISPASS).
Arafa, Y., Badawy, A., Chennupati, G., Santhi, N., and Ei-
denbenz, S. (2019). Ppt-gpu: Scalable gpu perfor-
mance modeling. IEEE Computer Architecture Let-
ters, pages 55–58.
Che, S., Boyer, M., Meng, J., Tarjan, D., Sheaffer, J. W.,
Lee, S.-H., and Skadron, K. (2009). Rodinia: A
benchmark suite for heterogeneous computing. Inter-
national Symposium on Workload Characterization.
Cornelis, J. G. and Lemeire, J. (2019). The pipeline per-
formance model: a generic executable performance
model for gpus. In International Conference on Par-
allel, Distributed and Network-Based Processing.
Ding, N. and Williams, S. (2019). An instruction roofline
model for gpus. In IEEE/ACM Performance Mod-
eling, Benchmarking and Simulation of High Perfor-
mance Computer Systems (PMBS).
Hong, S. and Kim, H. (2009). An analytical model for a
gpu architecture with memory-level and thread-level
parallelism awareness. International Symposium on
Computer Architecture (ISCA).
Hristea, C.-A.-M. et al. (1997). Micro benchmarks for mul-
tiprocessor memory hierachy performance. PhD the-
sis, Massachusetts Institute of Technology.
Jia, Z., Maggioni, M., Staiger, B., and Scarpazza, D. P.
(2018). Dissecting the nvidia volta gpu architecture
via microbenchmarking. arXiv.
Kandiah, V., Peverelle, S., Khairy, M., Pan, J., Manjunath,
A., Rogers, T. G., Aamodt, T. M., and Hardavellas, N.
(2021). Accelwattch: A power modeling framework
for modern gpus. In International Symposium on Mi-
croarchitecture.
Konstantinidis, E. and Cotronis, Y. (2017). A quantitative
roofline model for gpu kernel performance estimation
using micro-benchmarks and hardware metric profil-
ing. J. Parallel Distrib. Comput., 107:37–56.
Kothapalli, K., Mukherjee, R., Rehman, M. S., Patidar, S.,
Narayanan, P., and Srinathan, K. (2009). A perfor-
mance prediction model for the cuda gpgpu platform.
International Conference on High Performance Com-
puting (HiPC).
Lemeire, J., Cornelis, J. G., and Segers, L. (2016). Mi-
crobenchmarks for gpu characteristics: The occu-
pancy roofline and the pipeline model. Euromicro
International Conference on Parallel, Distributed, and
Network-Based Processing (PDP).
Lucas, J. and Juurlink, B. (2019). Mempower: Data-
aware gpu memory power model. In Schoeberl, M.,
Hochberger, C., Uhrig, S., Brehm, J., and Pionteck,
T., editors, Architecture of Computing Systems, pages
195–207. Springer.
Markidis, S., Chien, S., Laure, E., Peng, I., and Vetter, J. S.
(2018). Nvidia tensor core programmability, perfor-
mance & precision. In International Parallel and Dis-
tributed Processing Symposium Workshops.
Mei, X. and Chu, X. (2017). Dissecting gpu memory hierar-
chy through microbenchmarking. IEEE Transactions
on Parallel and Distributed Systems, 28:72–86.
Papadopoulou, M.-M., Sadooghi-Alvandi, M., and Wong,
H. (2009). Micro-benchmarking the gt200 gpu. Com-
puter Group, ECE, University of Toronto, Tech. Rep.
R. Meltzer, C. Z. and Cecka, C. (2013). Micro-
benchmarking the c2070,. poster presented at GPU
Technology Conference.
Resios, A. (2011). GPU Performance Prediction using Pa-
rameterized Models. Master’s thesis, Utrecht Univer-
sity.
Saavedra-Barrera, R. H. (1992). CPU Performance Eval-
uation and Execution Time Prediction Using Narrow
Spectrum Benchmarking. PhD thesis, EECS Depart-
ment, University of California, Berkeley.
Volkov, V. (2016). Understanding Latency Hiding on
GPUs.
Volkov, V. (2018). A microbenchmark to study gpu per-
formance models. 23rd ACM SIGPLAN Symposium
on Principles and Practice of Parallel Programming,
53(1):421–422.
Wong, H., Papadopoulou, M.-M., Sadooghi-Alvandi, M.,
and Moshovos, A. (2010). Demystifying gpu microar-
chitecture through microbenchmarking. IEEE Inter-
national Symposium on Performance Analysis of Sys-
tems & Software (ISPASS).
Yan, D., Wang, W., and Chu, X. (2020). Demystifying ten-
sor cores to optimize half-precision matrix multiply.
In IEEE International Parallel and Distributed Pro-
cessing Symposium (IPDPS), pages 634–643.
ICSOFT 2023 - 18th International Conference on Software Technologies
70
