
Automatic Classification of Quantitative Data from DNS Cache Servers
into Stationary and Non-Stationary States Based on Clustering
Hikofumi Suzuki
1
and Katsumi Wasaki
2
1
Integrated Intelligence Center, Shinshu University, 4–17–1, Wakasato, Nagano City, Nagano 380–8553, Japan
2
Faculty of Engineering Electrical and Computer, Engineering, Shinshu University, 4–17–1, Wakasato, Nagano City,
Nagano 380–8553, Japan
Keywords:
DoS/DDoS Attack Detection, DNS Traffic, Unsupervised Machine Learning, Density-Based Spatial
Clustering of Applications with Noise (DBSCAN), Mean Shift, Variational Bayesian Gaussian Mixture
Model (VBGMM).
Abstract:
In this study, quantitative traffic data from DNS cache servers are classified as stationary or non-stationary.
Then, unsupervised machine learning is performed using the classified traffic data. Among the 17 types of
DNS traffic data subject to revision, A Record, MX, SOA Record, and AD Flag are considered. The correlation
between A Record and AD Flag is difficult to detect using conventional clustering methods because they form
zonal clusters under stationary-state conditions. Therefore, the number of clusters is calculated using the
clustering algorithms Density-Based Spatial Clustering of Applications with Noise (DBSCAN), Mean Shift,
and variational Bayesian Gaussian mixture model (VBGMM). The possibility of automatic classification is
investigated.
1 INTRODUCTION
Denial-of-service (DoS) attacks disrupt the service
of a target computer by overloading it with a large
number of requests. Distributed denial-of-service
(DDoS) attacks involve multiple remotely controlled
computers, which have had malicious programs in-
stalled in advance, attacking all at the same time.
Kupreev and Gutnikov (OLEG KUPREEV, 2022) re-
ported that Kaspersky’s DDoS Intelligence system
detected 57,116 DDoS attacks in the third quarter of
2022. Gooding (Gooding, 2022) reported that Japan’s
e-Gov system was affected by DDoS attacks in 2022.
Thus, it is important to develop a method for defend-
ing against DDoS attacks.
In particular, the Domain Name System (DNS) is
a target of DoS/DDoS attacks due to its mechanism
that amplifies the data volume of response packets.
As of 2019, 5.46 million DNS servers were used to
attack DNS (OpenResolverProject, 2022). Kondo et
al. (Kondo et al., 2021) found that more than 15,000
servers in more than 1000 autonomous systems are
used for DoS/DDoS reflective amplification attacks.
Therefore, we analyzed DNS traffic to detect
DoS/DDoS attacks against DNS and obtained quan-
titative data on DNS traffic generated on DNS cache
servers from May 2021 to August 2022. We studied
17 types of DNS traffic data in detail, focusing on A,
MX, SOA Record, and AD Flag, and obtained corre-
lations between these four types of data. These corre-
lations confirmed that communication changed from
a stationary state to a non-stationary state.
However, the clusters formed by A, MX, SOA
Record, and AD Flag using distance-based clustering
methods such as the k-means method are not expected
to be accurate. For example, the clusters formed by
A Record and AD Flag appear as multiple adjacent
zonal clusters. Therefore, we calculated the change
in the number of clusters using the clustering algo-
rithms Density-Based Spatial Clustering of Applica-
tions with Noise (DBSCAN), Mean Shift, and varia-
tional Bayesian Gaussian mixture model (VBGMM).
The changes in the number of clusters obtained us-
ing these clustering methods were calculated. These
clustering methods, which are unsupervised learning
methods, are effective when the number of clusters
is unknown. Here, we focus on clusters formed by
A Record and AD Flag and perform clustering us-
ing DBSCAN, Mean Shift, and VBGMM. Then, we
discuss and evaluate a method for distinguishing be-
tween stationary and non-stationary states based on
the number of clusters obtained with DBSCAN, Mean
Suzuki, H. and Wasaki, K.
Automatic Classification of Quantitative Data from DNS Cache Servers into Stationary and Non-Stationary States Based on Clustering.
DOI: 10.5220/0012082000003541
In Proceedings of the 12th International Conference on Data Science, Technology and Applications (DATA 2023), pages 319-326
ISBN: 978-989-758-664-4; ISSN: 2184-285X
Copyright
c
2023 by SCITEPRESS – Science and Technology Publications, Lda. Under CC license (CC BY-NC-ND 4.0)
319

Shift, and VBGMM. The ultimate goal of this re-
search is to implement and evaluate a DoS/DDoS at-
tack detection system using ensemble learning based
on various clustering methods in a real environment.
2 RELATED WORKS
DBSCAN, the clustering method used in this study,
has been used for clustering various types of data, and
Zhang (Yan, 2022) discusses the possibility of realiz-
ing network security using DBSCAN. However, the
target dataset is not clear. Our work differs in that
we deal with quantitative data of real-world DNS traf-
fic; Sabottke et al.(Sabottke et al., 2019) discuss how
DBSCAN can be used to detect a wide range of cy-
bercrimes. In this study, we partially leverage their
results to discover changes in the aspect of clusters
generated based on time series for the purpose of DNS
attack detection. Najafimehr et al.(Najafimehr et al.,
2022) proposed hybrid machine learning for DDoS
detection and verified its effectiveness. The differ-
ence is that these results are based on dataset analysis,
while this study uses actual network traffic for verifi-
cation. Rongfeng et al. (Zheng et al., 2020) analyzed
benign traffic using DBSCAN. In this study, the target
is limited to DNS traffic and time-series data is con-
verted to quantitative data and processed to discover
stationary-state and non-stationary-state changes. Yu
et al.(Yu et al., 2015) and An et al.(An et al., 2014) re-
searched using Mean Shift to track image changes as
sequences. In this study, we apply this result and use
Mean Shift to detect changes in the shape of clusters
in the correlation diagram of traffic data.
3 PROPOSED METHODOLOGY
In this study, we investigated 17 types of quantita-
tive DNS traffic data over 15 months. The cluster-
ing shapes in the correlation diagrams were investi-
gated and four types of communication were focused
on. This section describes the DNS communication
data used in the analysis and the proposed clustering
method.
3.1 DNS Communication Data Used in
Analysis and Labeling
In this study, we focused on DNS server data.
There are more than 200 types of data avail-
able(DOCUMENTATION, 2023b). We focused on
17 types of data and obtained correlations (Table.1).
Especially, from the 17 types of data, we focused on
4 types of DNS traffic data (⃝ in the leftmost col-
umn of Table.1). The 4 types of traffic data were
selected because the shape of the clusters changed
in the time-series-generated correlation charts. A,
MX, SOA Record, and AD Flag traffic are aggre-
gated on a DNS cache server using the Type shown
in Table.1. The cache server used in this study is
unbound(DOCUMENTATION, 2023a). The data is
quantitative traffic data, aggregated hourly using the
statistics function of unbound. Here, quantitative data
means that each traffic data is cumulative data. For
example, in the case of A Record data, it is the ac-
cumulated number of times The DNS cache server
processed a Record traffic. Such data were collected
hourly for about one and a half years.
The correlation graphs in Figures 1 and 2 were
created from 15 months of data with a one-week
window. For example, for the correlation graph
for March 16, 2022, the data from March 10 to
March 16, 2022, were aggregated. A total of
485 correlation graphs were created. The shapes
of the num.query.type.A and num.query.flags.AD
clusters were checked. num.query.type.A and
num.query.flags.AD clusters form zonal clusters in
the stationary state, as shown in Figure 1. In contrast,
they form clumped clusters in the non-stationary state,
as shown in Figure 2. The cluster formation state was
checked and labeled as 0 for the stationary state and 1
for the non-stationary state.
3.2 Stationary State and
Non-Stationary State Taxonomy
For the quantitative data of DNS traffic analyzed in
this study, it is difficult to detect changes from corre-
lations. As mentioned, we calculated the correlation
of the time series quantitative data with a one-week
window. In the stationary state, banded clusters are
obtained, as shown in the left plot of Figure 3. In the
non-stationary state, clumped clusters are obtained,
as shown in the right plot of Figure 3. In this study,
we hypothesized that unsupervised machine learning
could calculate the number of clusters to discover the
change in aspect. For this task, it is necessary to make
judgments based on cluster shape. Here, we attempt
to detect cluster shape change based on the change in
the number of clusters.
Since the number of clusters to be formed is un-
known for the present data, clustering using unsuper-
vised machine learning is required. In addition, it is
necessary to adjust the hyperparameters of each clus-
tering method to achieve good clustering. DBSCAN,
Mean Shift, and VBGMM were selected as the clus-
DATA 2023 - 12th International Conference on Data Science, Technology and Applications
320
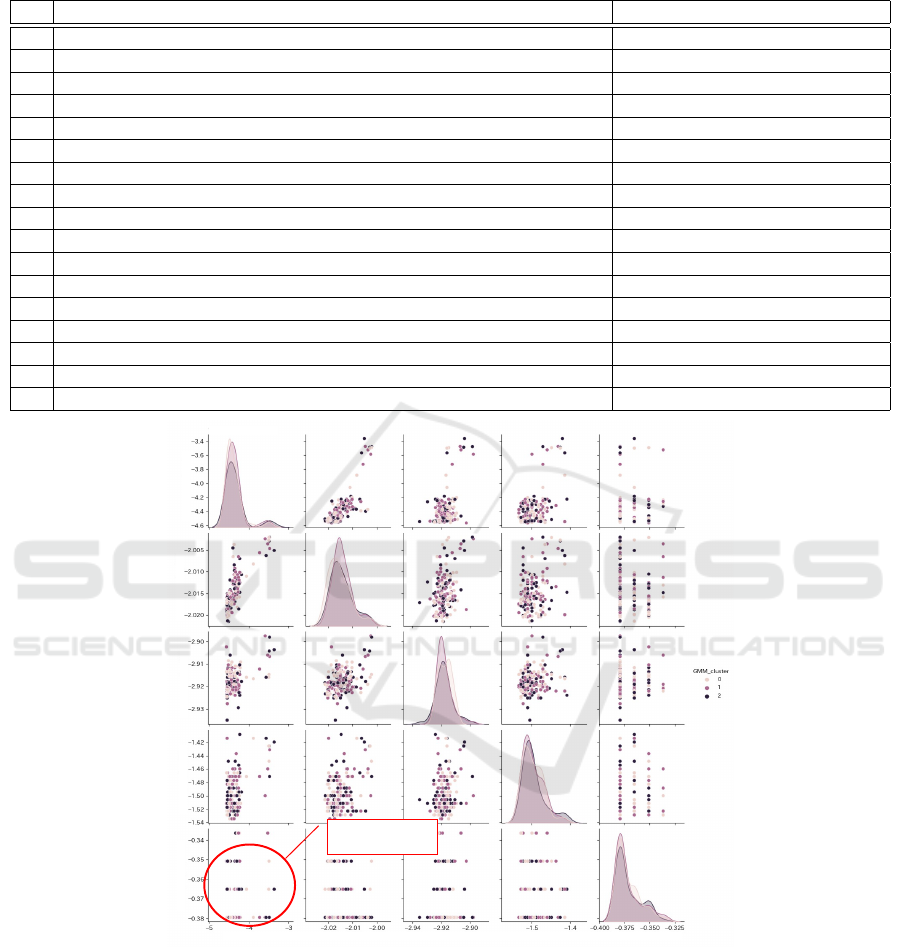
Table 1: List of types of DNS traffic analyzed in this study and items recorded on DNS cache servers (Unbound). Traffic for
A Record, MX, SOA Record, and AD Flag was analyzed in detail.
DNS traffic type Type in Unbound
Total number of queries total.num.queries
⃝ Total A Record (IPv4 forward lookup) num.query.type.A
Total AAAA Record (IPv6 forward lookup) num.query.type.AAAA
Total ANY Record num.query.type.ANY
Total Name Server Record num.query.type.NS
Total Canonical NAME Record num.query.type.CNAME
⃝ Total MX (for e-Mail) Record num.query.type.MX
⃝ Total Start of a zone of authority Record num.query.type.SOA
Total Text record num.query.type.TXT
Total RD Flag (requesting name resolution) num.query.flags.RD
Total RA Flag (indicates that name resolution is possible) num.query.flags.RA
Total Z Flag (reserved for future use) num.query.flags.Z
⃝ Total AD Flag (successful DNSSEC) num.query.flags.AD
Total CD Flag (prohibits DNSSEC verification) num.query.flags.CD
Total NODATA (no record exists, but other possibilities exist) record num.answer.rcode.nodata
Total NXDOMAIN (no record exists) record num.answer.rcode.NXDOMAIN
Number of cache misses total.num.cachemiss
num.query.type.A num.query.type.ANY num.query.type.SOA num.query.type.MX num.query.flags.AD
num.query.type.A
num.query.type.ANYnum.query.type.SOAnum.query.type.MX
num.query.flags.AD
Banded clusters
(Stationary state)
Figure 1: DNS num.query.type.A-num.query.flags.AD correlation diagrams showing stationary state (0) in data for May 5,
2021.
tering algorithms. Their characteristics are briefly
summarized below.
DBSCAN. Closely spaced data are combined into
the same group. Data in low-density regions are
considered to be noise (outliers). A data point is
judged to be a cluster based on the number of sur-
rounding data points.
Mean Shift. Multiple Gaussian distributions are as-
sumed. Each data point is assigned to a Gaus-
sian distribution. k-means clustering is used as the
base method and data points that are close to each
other are assigned to the same cluster.
VBGMM. Multiple Gaussian distributions are as-
sumed. Each data point is assigned to a Gaussian
Automatic Classification of Quantitative Data from DNS Cache Servers into Stationary and Non-Stationary States Based on Clustering
321

num.query.type.A num.query.type.ANY num.query.type.SOA num.query.type.MX num.query.flags.AD
num.query.type.A
num.query.type.ANYnum.query.type.SOAnum.query.type.MX
num.query.flags.AD
Clumped clusters
(Non-stationary state)
Figure 2: DNS num.query.type.A-num.query.flags.AD correlation diagrams showing non-stationary state (1) in data for March
16, 2022.
Banded clusters
(Stationary state)
Clumped clusters
(Non-stationary state)
num.query.type.A
num.query.flags.AD
num.query.type.A
num.query.flags.AD
Figure 3: Change from stationary state, banded cluster (left), to non-stationary state, clumped cluster.
distribution. The difference from Mean Shift is
that the number of clusters is calculated and used
to determine the cluster shape of the distribution.
This paper describes how the number of clusters
changes for each clustering method. Then, the accu-
racy of each clustering method is evaluated using ac-
curacy, recall, and the false positive rate (FPR). The
balance between recall and precision is checked.
4 CHANGE IN NUMBER OF
CLUSTERS
4.1 Change in Number of Clusters for
DBSCAN
For num.query.type.A-num.query.flags.AD data,
clustering was performed using DBSCAN to obtain
the number of clusters, which can be used as an
evaluation index. By setting the epsilon parameter
(eps) appropriately, it is possible to separate banded
DATA 2023 - 12th International Conference on Data Science, Technology and Applications
322

and clumped clusters. Based on trial and error, eps
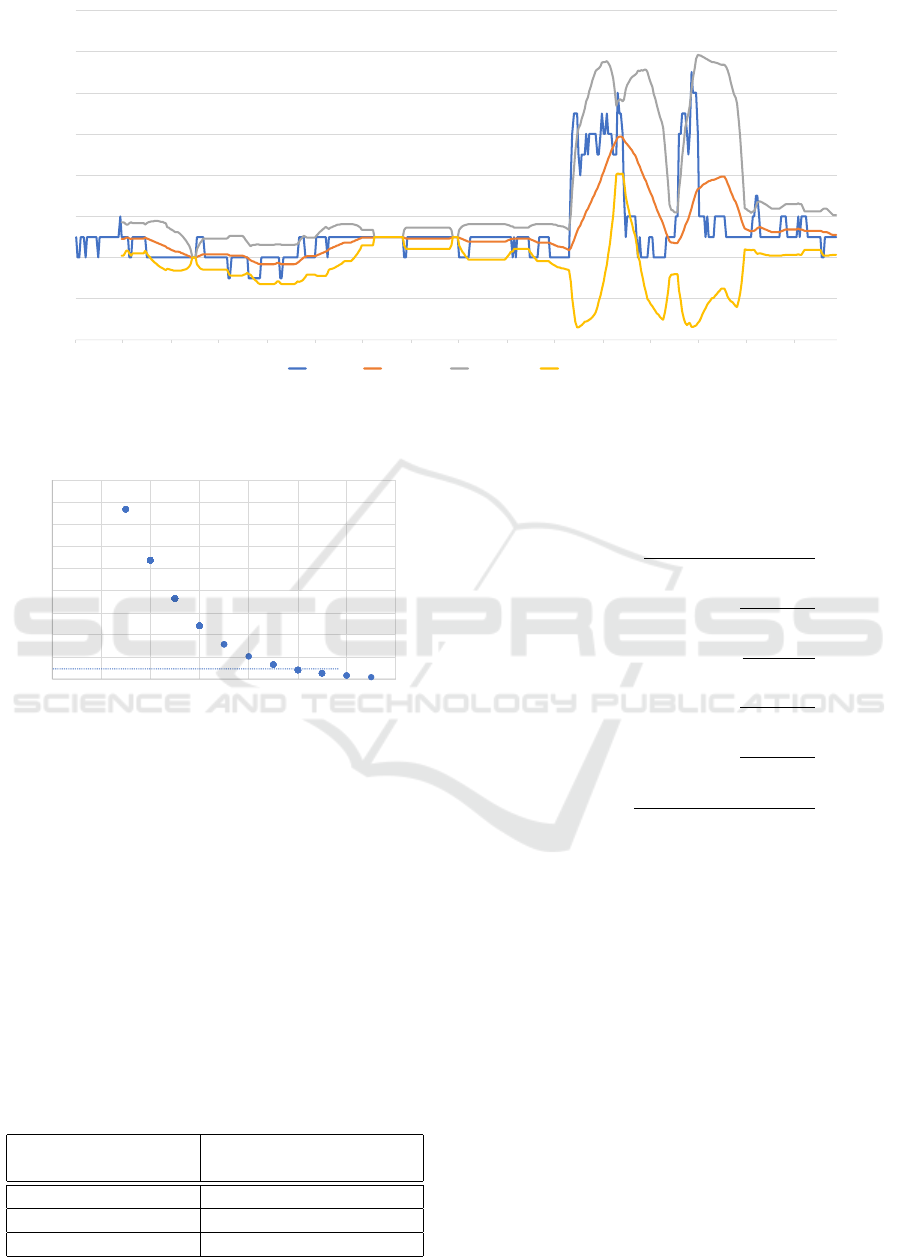
was set to 0.0025. Figure 4 shows the change in the
number of clusters at eps = 0.0025. The meaning of
each curve in Figure 4 is as follows:
Blue Line: Number of DBSCAN clusters for eps =
0.0025
Orange Line: 30-day moving average
Gray Line: upper Bollinger Band (+2σ)
Yellow Line: lower Bollinger Band (−2σ)
From Figure 4, the number of clusters is small un-
til March 9, 2022, after which there are two large
peaks. These two peaks are mostly consistent with
the labeled DNS data. There are a small number of
non-stationary data for a short period up to March 9,
2022; however, these are not detected as clusters in
DBSCAN.
The chi-squared test obtains the number of clus-
ters for calculating the evaluation index. The con-
fusion matrices for true positive (TP), false positive
(FP), true negative (TN), and false negative (FN) were
calculated based on the obtained number of clusters.
As shown in Figure 5, the number of clusters around
Probability (p = 0.01) is 10 for the degrees of free-
dom of the chi-squared test (k = 3). We compared
the number of clusters plotted in Figure 4 with the
obtained number of clusters (i.e., 10) for judgment.
The confusion matrix was obtained by comparing the
number of clusters with the labels described above.
4.2 Change in Number of Clusters for
Mean Shift
As with DBSCAN, clustering using Mean
Shift was performed on the num.query.type.A-
num.query.flags.AD data to obtain the number of
clusters as an evaluation index. Mean Shift has a
smoothing parameter (distance) and a hyperparameter
(bandwidth). By appropriately setting the bandwidth
(h), it is possible to separate banded and clumped
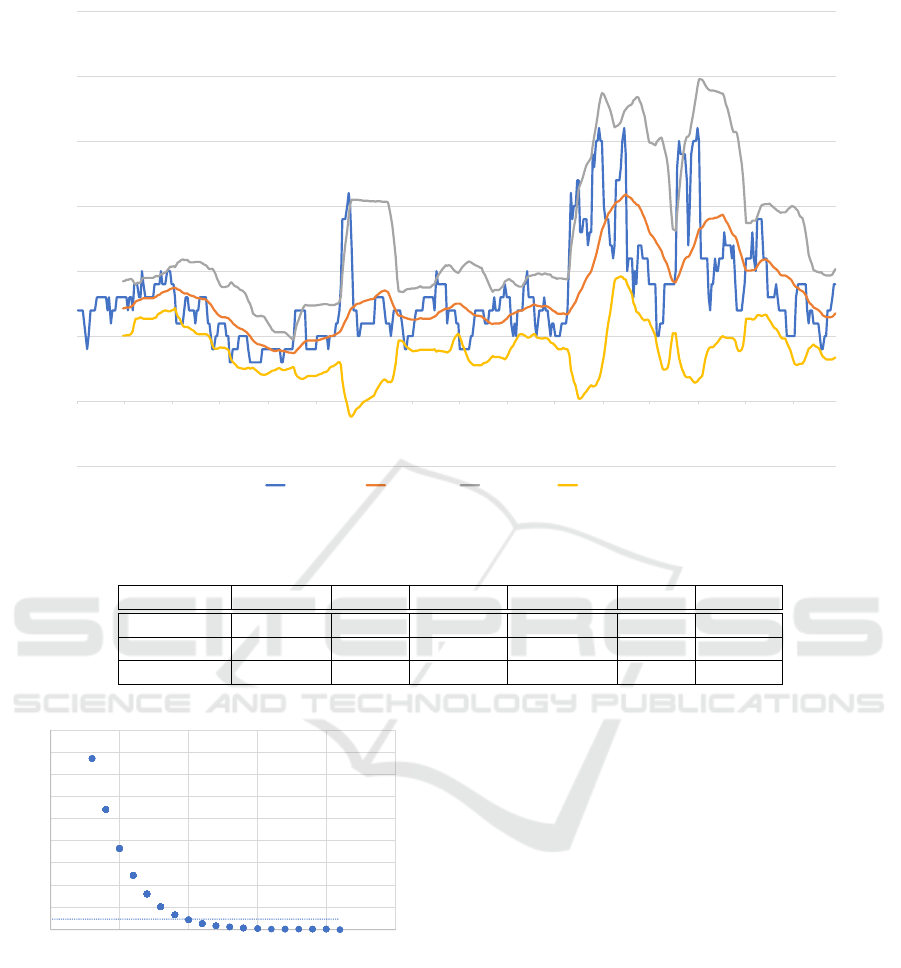
clusters. Based on trial and error, h was set to 0.0001.
Figure 6 shows the change in the number of clusters
for h = 0.0001. The meaning of each curve in Figure
6 is as follows:
Blue Line: Number of Mean Shift clusters in band-
width (h = 0.0001)
Orange Line: 30-day moving average
Gray Line: upper Bollinger Band (+2σ)
Yellow Line: lower Bollinger Band (−2σ)
A comparison of Figure 6 with the DBSCAN
graph (Figure 4) shows similar trends for the data
after March 9, 2022. However, for the data before
March 9, 2022, clustering is possible for a small num-
ber of non-stationary data for a short time.
As with DBSCAN, a chi-squared test was used to
obtain the number of clusters for calculating the eval-
uation index. The confusion matrices for TP, FP, FN,
and TN were calculated based on the obtained num-
ber of clusters. As shown in Figure 7, the number of
clusters around Probability (p = 0.01) is 10 for the
degrees of freedom (k = 3) of the chi-squared test.
We compared the number of clusters plotted in Figure
6 with the obtained number of clusters (i.e., 10) for
judgment. As with DBSCAN, the confusion matrix
was obtained by comparing with the labels described
earlier.
4.3 Change in Number of Clusters for
VBGMM
As with DBSCAN, clustering using VBGMM
was performed on the num.query.type.A-
num.query.flags.AD data to obtain the number
of clusters as an evaluation index. convariance type,
a covariance parameter, is a highly influential hy-
perparameter for VBGMM. It was set to the default
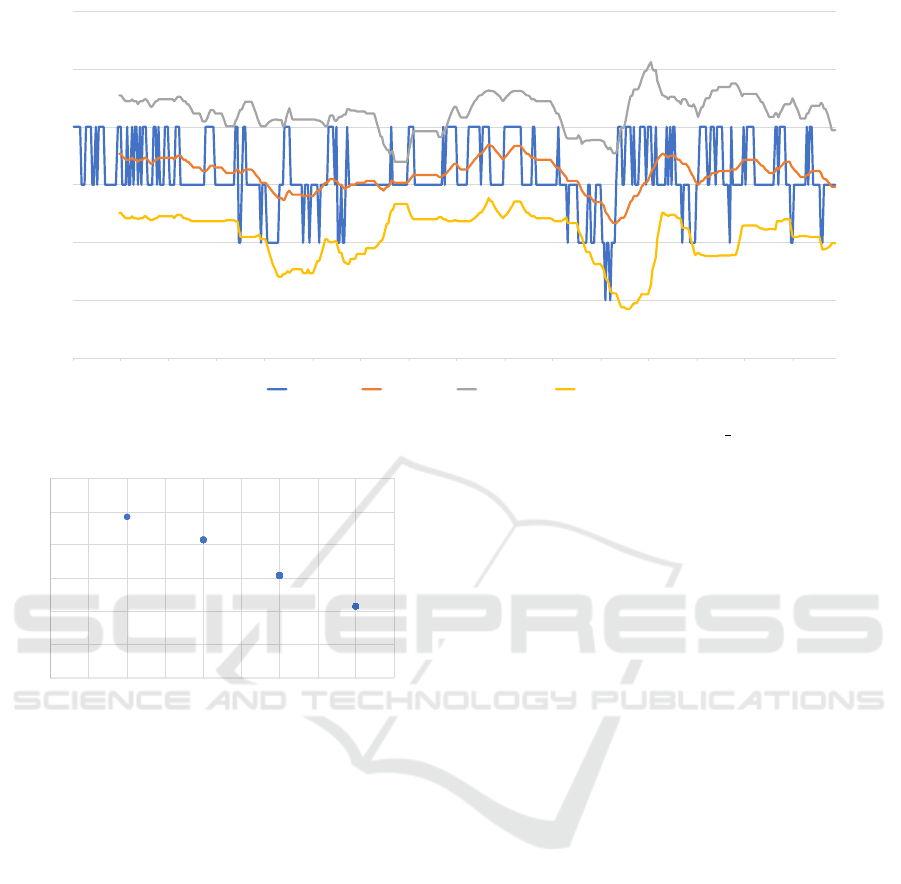
value (i.e., full) in this case. The results are shown in
Figure 8. The meaning of each curve in Figure 8 is as
follows:
Blue Line: Number of VBGMM clusters for conva-
riance type = full
Orange Line: 30-day moving average
Gray Line: upper Bollinger Band (+2σ)
Yellow Line: lower Bollinger Band (−2σ)
A comparison of the DBSCAN graph (Figure 4)
with the Mean Shift graph (Figure 6) indicates that the
data are not consistent with the data labeled as station-
ary and non-stationary throughout the entire period.
As with DBSCAN, a chi-squared test was used to
obtain the number of clusters for calculating the eval-
uation index. The confusion matrices for TP, FP, FN,
and TN were calculated based on the obtained number
of clusters. As shown in Figure 9, there are no data
around Probability (p = 0.01) in the degrees of free-
dom (k = 3) of the chi-squared test. We thus selected
four clusters, which is the closest to p = 0.01. This
selected number of clusters was compared with the
number of clusters plotted in Figure 8. As with DB-
SCAN, the confusion matrix was obtained by com-
paring with the labels described earlier.
Automatic Classification of Quantitative Data from DNS Cache Servers into Stationary and Non-Stationary States Based on Clustering
323
0
2
4
6
8
10
12
14
16
2021/4/29 2021/5/29 2021/6/29 2021/7/29 2021/8/29 2021/9/29 2021/10/29 2021/11/29 2021/12/29 2022/1/29 2022/2/28 2022/3/31 2022/4/30 2022/5/31 2022/6/30 2022/7/31
DBSCAN
Cluster
eps = 0 .0025
Mov ing Average
(30 days)
Upper Band(+2σ) Lower Band(-2σ)
Figure 4: Number of clusters and Bollinger Bands obtained using DBSCAN (±2σ).
0
0.02
0.04
0.06
0.08
0.1
0.12
0.14
0.16
0.18
0 2 4 6 8 10 12 14
Number of clusters
Probability
k = 3
Figure 5: Number of clusters calculated using DBSCAN
with chi-squared test.
5 EVALUATION
The results of clustering for the num.query.type.A-
num.query.flags.AD data used in this paper were eval-
uated using accuracy, recall, precision, specificity, F-
score, and FPR as evaluation indices. Each cluster-
ing method was evaluated using accuracy, recall, and
FPR. The method for obtaining the mixing matrices
(TP, FP, FN, TN), which form the basis for the evalu-
ation indices, is based on the results of the chi-squared
test for each clustering method (Table 2).
Table 2: Number of clusters used for obtaining confusion
matrix for various clustering methods.
Cluster Method Number of clusters used
to obtain mixing matrix
DBSCAN 10
Mean Shift 10
VBGMM 4
Accuracy, recall, precision, specificity, FPR, and
F-score were respectively calculated using the follow-
ing equations.
Accuracy =
T P + T N
T P + FP + FN + T N
(1)
Recall =
T P
T P + FN
(2)
Precision =
T P
T P + FP
(3)
Speci f icity =
T N
FP + T N
(4)
FalsePositiveRate(FPR) =
FP
T N + FP
(5)
F − Score =
2 × Recall × Precision
Recall + Precision
(6)
Accuracy refers to the accuracy of both the zonal
clusters (stationary clusters) and the clumped clusters
(non-stationary clusters). Mean Shift has the highest
accuracy before March 9, 2022, and DBSCAN has
the highest accuracy after March 9, 2022. For the en-
tire period, they have the same accuracy. In contrast,
VBGMM has very low accuracy.
Recall indicates whether the data labeled as
clumped clusters (non-stationary clusters) were
judged correctly. Mean Shift has the highest re-
call (0.5963), followed by DBSCAN (0.2569) and
VBGMM (0.1250). However, in this study, it was
sufficient to reliably detect non-stationary states, so
a low recall is not a problem.
FPR indicates whether the data labeled as zonal
clusters (stationary clusters) were incorrectly judged.
DBSCAN has the lowest FPR (0.0160), followed by
Mean Shift (0.1223) and VBGMM (0.3300).
DATA 2023 - 12th International Conference on Data Science, Technology and Applications
324
-5
0
5
10
15
20
25
30
2021/4/29 2021/5/29 2021/6/29 2021/7/29 2021/8/29 2021/9/29 2021/10/29 2021/11/29 2021/12/29 2022/1/29 2022/2/28 2022/3/31 2022/4/30 2022/5/31 2022/6/30 2022/7/31
MeanShift Cluster
bandwith = 0.001
Mov ing Average
(30 days)
Upper Band(+2σ) Lower Band(-2σ)
Figure 6: Number of clusters and Bollinger Bands obtained using Mean Shift (±2σ).
Table 3: Evaluation indices for various clustering methods.
Accuracy Recall Precision Specificity FPR F-Score
DBSCAN 0.8206 0.2569 0.8235 0.9840 0.0160 0.3916
Mean Shift 0.8144 0.5963 0.5856 0.8777 0.1223 0.5909
VBGMM 0.5711 0.1250 0.0775 0.6700 0.3300 0.0957
0
0.02
0.04
0.06
0.08
0.1
0.12
0.14
0.16
0.18
0 5 10 15 20 25
Number of clusters
Probability
k = 3
Figure 7: Number of clusters calculated using Mean Shift
with chi-squared test.
In this study, we investigated whether it is possi-
ble to detect non-stationary states from changes in the
number of clusters using DBSCAN, Mean Shift, and
VBGMM. The results show that DBSCAN performed
very well in terms of FRP. Therefore, DBSCAN was
the best method for detecting changes in A Record
and AD Flag. DBSCAN is effective for detecting
shape changes from banded clusters to clumped clus-
ters. The performance of Mean Shift is almost equal
to that of DBSCAN. In contrast, VBGMM is unsuit-
able for detecting shape changes in banded clusters
because of its poor performance for all evaluation in-
dices. Note that for DBSCAN, recall must be bal-
anced with precision.
6 CONCLUSIONS
In this study, we obtained quantitative data on DNS
cache servers from May 2021 to August 2022. Sev-
enteen types of DNS traffic data were studied, four of
which (A, MX, SOA Record, and AD Flag) were se-
lected for analysis. The correlation plots for A Record
and AD Flag showed that the shape of the clusters
changed overtime. Using these correlation plots, we
labeled the clusters as stationary when they formed
banded clusters and non-stationary when they formed
clumped clusters. Based on these data, a clustering
method that can calculate the number of clusters was
used to detect non-stationary states.
DBSCAN was found to be suitable for clustering
data for which the number of clusters is unknown in
the zonal clusters. In this study, we extended this
method and incorporated it into a system for auto-
Automatic Classification of Quantitative Data from DNS Cache Servers into Stationary and Non-Stationary States Based on Clustering
325
0
1
2
3
4
5
6
2021/4/29 2021/5/29 2021/6/29 2021/7/29 2021/8/29 2021/9/29 2021/10/29 2021/11/29 2021/12/29 2022/1/29 2022/2/28 2022/3/31 2022/4/30 2022/5/31 2022/6/30 2022/7/31
VBGMM Cluster Mov ing Average
(30 days)
Upper Band(+2σ) Lower Band(-2σ)
Figure 8: Number of clusters and Bollinger Bands obtained using VBGMM (convariance type = full).
0
0.05
0.1
0.15
0.2
0.25
0.3
0 0.5 1 1.5 2 2.5 3 3.5 4 4.5
Number of clusters
Probability
k = 3
Figure 9: Number of clusters calculated using VBGMM
with chi-squared test.
matic detection. In future studies, we will develop an
ensemble learning system based on DBSCAN, Mean
Shift, and VBGMM in parallel. We will also con-
sider t-distributed stochastic neighbor embedding and
other methods that take data continuity into account
to improve the accuracy of ensemble learning. In
addition, it is necessary to adjust the hyperparame-
ters to balance recall and precision for each clustering
method. The effectiveness of this method for detect-
ing DoS/DDoS and other attacks in existing networks
will be confirmed.
REFERENCES
An, X., Kim, J., and Han, Y. (2014). Optimal colour-based
mean shift algorithm for tracking objects. IET Com-
puter Vision, 8(3):235–244.
DOCUMENTATION, N. (2023a). Unbound.
DOCUMENTATION, N. (2023b). unbound-control(8) un-
bound 1.17.1.
Gooding, M. (2022). Russian hackers killnet claim ddos
attack on japanese government websites.
Kondo, M., Shintani, N., Makita, D., Yoshioka, K., and
Matsumoto, T. (2021). Study on analyzing mem-
cached drdos attacks and their infrastructures. IEICE
Technical Report; IEICE Tech. Rep., 120(384):114–
119.
Najafimehr, M., Zarifzadeh, S., and Mostafavi, S. (2022).
A hybrid machine learning approach for detecting un-
precedented ddos attacks. The Journal of Supercom-
puting, 78(6):8106–8136.
OLEG KUPREEV, ALEXANDER GUTNIKOV, Y. S.
(2022). Ddos attacks in q3 2022, kaspersky, securelist.
OpenResolverProject (2022). Open dns resolver project.
Sabottke, C., Chen, D., Layman, L., and Dumitras¸, T.
(2019). How to trick the borg: threat models against
manual and automated techniques for detecting net-
work attacks. Computers & Security, 81:25–40.
Yan, Z. (2022). Dbscan clustering algorithm based on big
data is applied in network information security detec-
tion. Security and Communication Networks, 2022.
Yu, W., Tian, X., Hou, Z., Zha, Y., and Yang, Y. (2015).
Multi-scale mean shift tracking. IET Computer Vision,
9(1):110–123.
Zheng, R., Liu, J., Niu, W., Liu, L., Li, K., and Liao,
S. (2020). Preprocessing method for encrypted traf-
fic based on semisupervised clustering. Security and
Communication Networks, 2020:1–13.
DATA 2023 - 12th International Conference on Data Science, Technology and Applications
326
