
DataFITR: An Open, Guided Input Modeling Tool for Creating
Simulation-Based Digital Twins
Lekshmi P.
a
, Tushar Lone
b
and Neha Karanjkar
c
Indian Institute of Technology Goa, India
Keywords:
Input Modeling, Simulation, Digital Twins, Open Source, Graphical User Interface.
Abstract:
Input Modeling (IM) is a critical step in the process of building simulation-based digital twins. It involves
selecting a family of distributions to model the observed data and finding the distribution parameter values that
best fit the data. Subsequently, random variates adhering to the selected distribution can be generated to create
a simulation-based digital twin of the system. For complex systems, IM can be a nuanced process involving
a series of decisions that require visual feedback at each step. There is currently a dearth of open, GUI-based
tools for aiding the non-expert user in the process of IM. This paper presents DataFITR, a GUI-based, open
Input Modeling tool we have developed for guiding the non-expert user through the steps of input modeling
and automating several intermediate tasks. DataFITR is cloud-hosted with a web-based user interface. The
user can upload data as a file and the tool guides the user through the IM process by suggesting types and
suitable distributions for each observed variable. It generates multiple goodness-of-fit measures for a large set
of standard discrete and continuous distributions and can also support arbitrary (non-standard) distributions
using a Kernel Density Estimation approach. DataFITR also assists in exploratory data analysis by providing
various statistical properties of the observed data and in finding correlations between output measures. Once
a matching distribution is found, the tool generates Python code for producing random variates from the
matching distribution, which can be directly inserted into a simulation model. In this paper, we describe the
DataFITR tool and its features, and compare it with existing open libraries and tools for assisting IM. We
present a simulation case study of a bottling plant to demonstrate the utility of the DataFITR tool in building
simulation-based digital twins.
1 INTRODUCTION
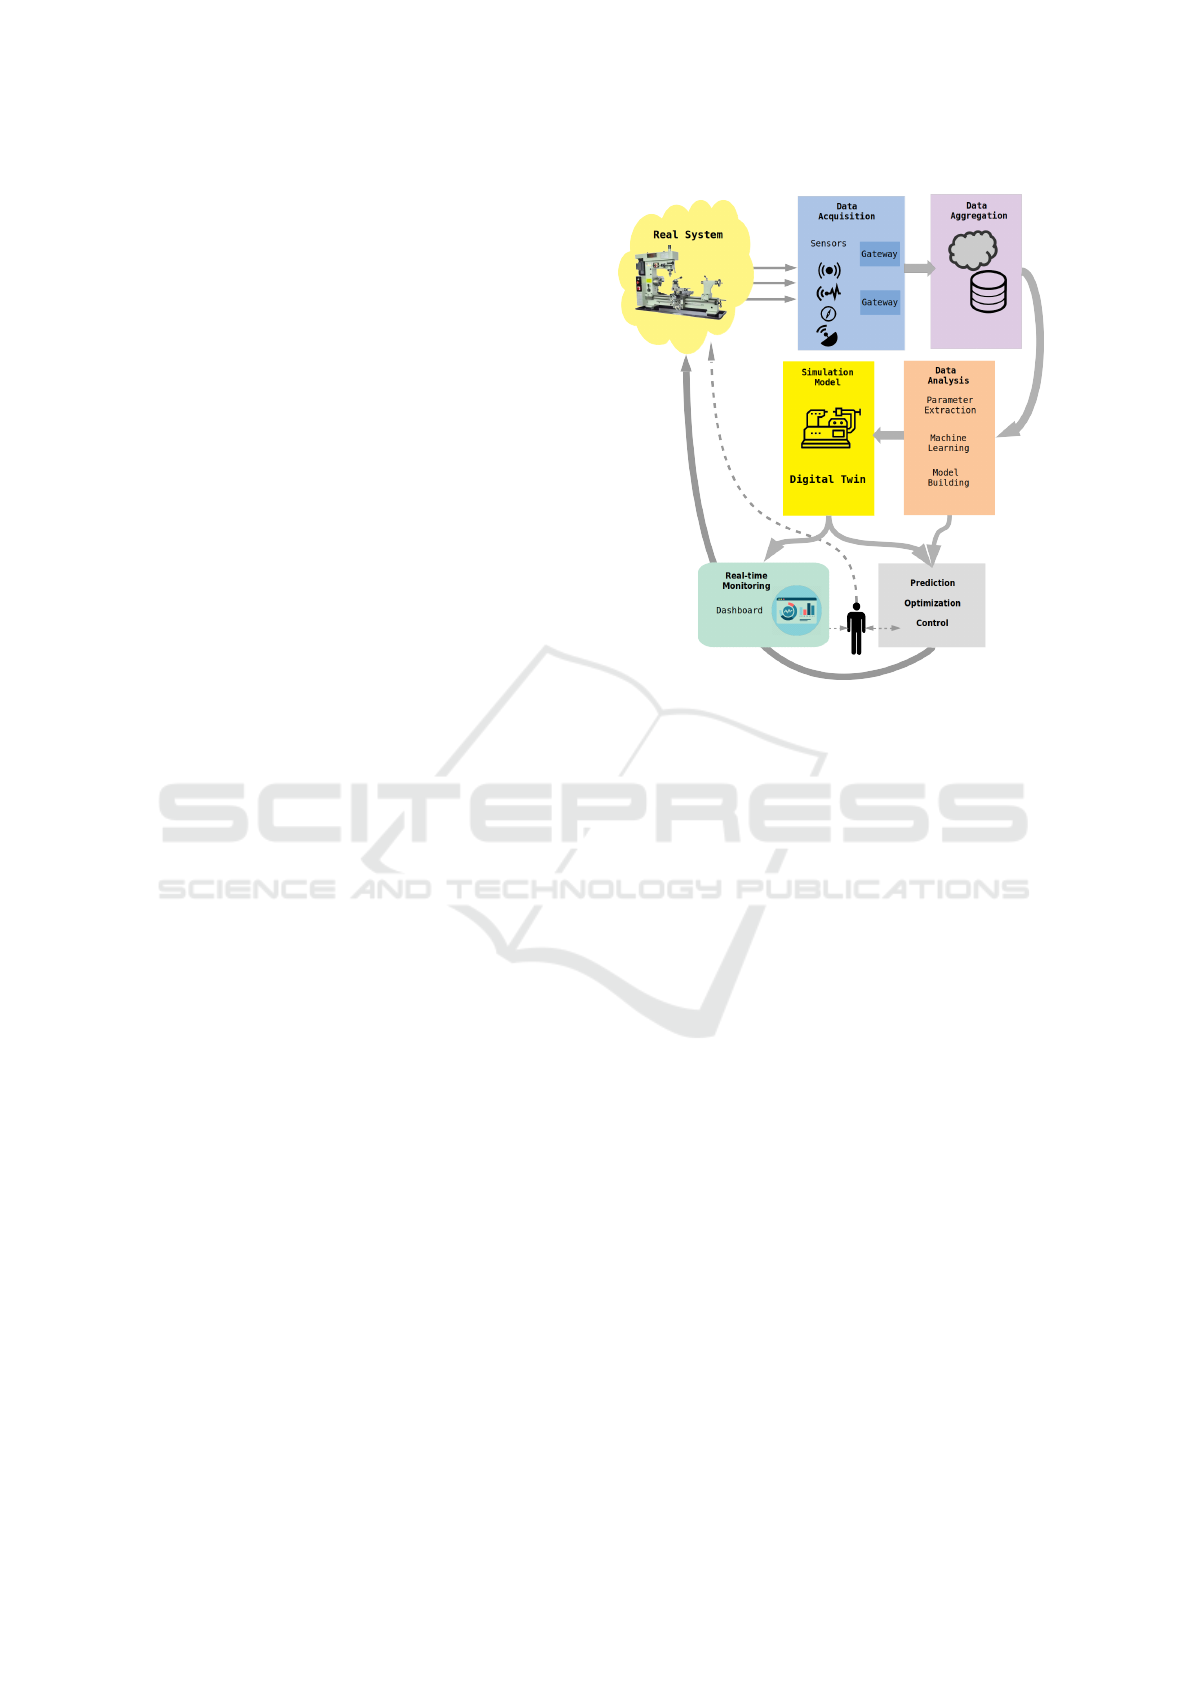
A Digital Twin refers to a virtual replica or model
of a physical system whose state is kept in sync with
the real system via a continuous stream of observa-
tions or data from the real system. A digital twin may
also be used to control the real system via feedback
paths. Figure 1 illustrates the main components (such
as sensing and actuation, data aggregation, simula-
tion and dashboarding) that make up a digital twin.
The use of digital twins has the potential to revo-
lutionize sectors such as manufacturing, healthcare,
urban planning, and transportation by enabling real-
time decision-making using Internet of Things (IoT)
technology and real-time analytics (Kritzinger et al.,
2018).
A digital twin can either be purely data-driven or
a
https://orcid.org/0000-0001-5464-6032
b
https://orcid.org/0000-0003-0008-0429
c
https://orcid.org/0000-0003-3111-1435
simulation-based. In a purely data-driven digital twin,
the behavior of the system and future predictions are
derived solely from data. In contrast, a simulation-
based digital twin can be used when the modeler has
prior knowledge or can make reasonable assumptions
about the behavior of the system. The system behav-
ior, structural components and/or state transitions in
the system are described by the modeler to create a
parameterized simulation model and the exact values
of these parameters are derived from observed data.
Depending on the type of real system under consid-
eration, simulation models can either be deterministic
or stochastic, and are typically implemented using ei-
ther a discrete-event simulation approach or continu-
ous simulation paradigms.
Input Modeling (IM) is a critical step in the cre-
ation of digital twins. When performed incorrectly or
without due care, the resulting model is prone to suf-
fer from the Garbage-In-Garbage-Out problem and
may yield incorrect insights or predictions. For a dig-
P., L., Lone, T. and Karanjkar, N.
DataFITR: An Open, Guided Input Modeling Tool for Creating Simulation-Based Digital Twins.
DOI: 10.5220/0012082600003546
In Proceedings of the 13th International Conference on Simulation and Modeling Methodologies, Technologies and Applications (SIMULTECH 2023), pages 279-286
ISBN: 978-989-758-668-2; ISSN: 2184-2841
Copyright
c
2023 by SCITEPRESS – Science and Technology Publications, Lda. Under CC license (CC BY-NC-ND 4.0)
279
ital twin the process of IM needs to be automated
as the model needs to remain continuously in sync
with incoming data. Traditionally, IM involves deriv-
ing simulation parameters (which can either be con-
stants or parameters of an appropriate probability dis-
tribution) from data corresponding to multiple mea-
sured entities. For example, in a manufacturing plant,
one might have a continuous stream of data corre-
sponding to attributes such as time taken by a ma-
chine to perform certain kinds of tasks, the periodi-
cally monitored levels of inventory or raw material,
energy consumption of a machine per-task etc. If a
quantity (such as the time taken per-task) is assumed
to be random, it can be modeled by generating ran-
dom variates inside a stochastic simulation model,
where the parent distribution of this random vari-
able can be obtained from observed data. IM refers
to the systematic process of selecting the appropri-
ate distributions for each physical quantity and fitting
their parameters to best match the observed data. For
time-independent data, this process involves select-
ing the right distribution and finding the maximum
likelihood estimators for the distribution using data.
Several Goodness of fit measures can be used to de-
scribe the extent of match between the selected distri-
bution and the observed data. These steps need to be
repeated until a reasonable fit is achieved. For time-
dependent data, this involves selecting the appropri-
ate models (stationary/non-stationary) and mimicking
the time-dependence using mathematical models such
as Markov Chains or Moving-Average (MA) models
(Banks et al., 2010). In a real system, it is often the
case that some of the measured quantities are corre-
lated. For example, the energy consumption of a ma-
chine for performing a certain task and the time taken
to perform that task may be positively correlated. This
correlation needs to be identified right at the outset,
and modeled using multivariate distributions for gen-
erating random variates in the simulation model.
Thus the task of IM is nuanced and may require
time and effort. However, with increasing ubiquity of
digital twins and their creation or use by non-expert
users, it becomes necessary to have tools that as-
sist and guide the user in IM or automate some as-
pects of this task. Recently, deep-learning based ap-
proaches such as generative neural architectures have
been proposed to automate IM (Cen et al., 2020).
Such methods may require a large amount of train-
ing data. For cases where a modeler has some prior
knowledge about the system behavior, traditional ap-
proaches may be better suited and efficient as stan-
dard distributions often end up mimicking the ob-
served data really well. While there exist commer-
cial tools such as ExpertFit (Law, 2020) and Stat::Fit
Figure 1: Components of a digital twin.
(Software, 2022) and libraries in programming lan-
guages (summarized in the next section) which can
assist the user in IM by fitting distributions to data,
there is currently a dearth of free/open IM tools tar-
geted for the non-expert user. Desirable properties for
an IM tool include a GUI interface, assistive features,
support for a variety of goodness of fit tests, and the
ability to fit correlated data and generate random vari-
ates. While some commercial tools provide some of
these features, there is a lack of open/free tools for
IM that offer a GUI-front-end and are targeted for the
non-expert user.
This paper describes DataFITR - an open, GUI-
based, cloud-hosted tool we have developed for as-
sisting the non-expert user in input modeling. The
tool is freely accessible via a browser at the URL:
https://datafitr.streamlit.app. The user can upload
their data as a csv (comma-separated-value) file. The
tool then guides the user through the input model-
ing process in a step-wise manner while providing vi-
sual aids (such as data plots, histograms and color-
coded correlation matrices) at each step. It automati-
cally generates plots of the marginal distributions and
a statistical summary of the data. The user can do ex-
ploratory data analysis of the columns in the data set
and then proceed to find the distributions that best fit
the data. The tool supports a large set of standard con-
tinuous and discrete distributions. It also implements
and reports multiple goodness of fit measures such as
Kolmogorov-Smirnov (KS) test metric, Chi-squared
(χ
2
) test measure, and Sum of Squares Error (SSE).
SIMULTECH 2023 - 13th International Conference on Simulation and Modeling Methodologies, Technologies and Applications
280

For data that does not match any standard distribution,
the DataFITR tool can generate arbitrary uni-variate
distributions to match the histogram using the Kernel
Density Estimation (KDE) approach (Parzen, 1962).
Most importantly, once a desired distribution is found,
the tool automatically produces Python code for ran-
dom variate generation corresponding to the selected
distribution. This code can be directly copied into a
stochastic simulation model to generate the random
variates. DataFITR has been written in Python, and
a GUI front-end is created using the Streamlit library
(Streamlit, 2022). The tool is currently cloud-hosted
on the Streamlit community cloud. DataFITR cur-
rently supports time-independent models (with a large
set of standard distributions or arbitrary distribution),
and for correlated data multi-variate Gaussian distri-
butions are currently supported. We plan to add sup-
port for time-dependent models and arbitrary multi-
variate distributions in future versions.
The rest of this paper is organised as follows: In
Section 2 we provide a brief overview of open li-
braries and existing tools available for building digital
twins with a focus on IM. In Section 3, we describe
the features, usage flow and details of the DataFITR
tool. In Section 4 we present a simulation case study
of a bottling plant which serves to highlight the util-
ity of the tool. In this case study, we generate data
using a known reference model (a discrete-event sim-
ulation model) of a bottling plant, and use this data
and some knowledge about the real system to create
a matched model automatically using the DataFITR
tool. We present results showing the extent of match
between the original reference model and the matched
model in terms of the system parameters and out-
put/performance measures. Finally, we present con-
clusions and future plans in the last section.
2 RELATED WORK
A broad survey of tools and processes in creating dig-
ital twins is presented in (Fuller et al., 2020). In-
put Modeling (IM) is a critical step and historically
IM techniques have focused on offline system mod-
els (Cheng, 2017). An overview of IM techniques
for various problem domains is described in (Nelson
and Yamnitsky, 1998). Commercial software tools
such as ExpertFit (Law, 2020) and Stat::Fit (Soft-
ware, 2022) support in IM by identifying probabil-
ity distributions to fit observed data. These tools also
assist the user in selecting a distribution when data
is unavailable based on system knowledge, for as-
pects such as task times and equipment failures. XL-
STAT (Lumivero, 2022) is a commercial Excel-based
tool that can be used for IM. Aside from commer-
cial tools, a few libraries in popular programming lan-
guages such as Python and R exist for fitting proba-
bility distributions to data. Distfit (Taskesen, 2020)
and fitter (Cokelaer, 2020) are two examples of open
Python-based libraries. Both can be used to fit stan-
dard uni-variate distributions. fitteR (Boenn, 2022) is
an R-based version for fitting distributions to empir-
ical data. Distribution fitter (Distributionfitter, 2022)
is a python based GUI application which is built using
the fitter package. It can be used to fit univariate dis-
tributions. Distribution Analyser (DistributionAnal-
yser, 2022) is another Python-based application that
helps users analyze univariate distributions. It also
allows the users to fit the data into univariate distri-
butions. While these are libraries that can be used via
interface routines, the DataFITR tool described in this
paper is a GUI-based tool that does not require any
programming for its use. Table 1 summarizes the dif-
ferent features and scope of these libraries along with
the DataFITR tool proposed in this paper.
3 DataFITR: FEATURES AND
USAGE
DataFITR is open-source (released as a public repos-
itory on GitHub at (Lekshmi P, 2023)). It is currently
hosted on Streamlit public cloud and freely accessi-
ble via a browser at https://datafitr.streamlit.app. The
user can upload the data in a csv (comma separated
value) format where each column corresponds to a
single measured quantity and the first row is assumed
to contain the names of each quantity. For categori-
cal type of data, it is assumed that the data is integer-
valued.
DataFITR currently supports modeling time-
independent, Independent and Identically Distributed
(IID) data where each measured quantity (column in
the data file) is independent. It also supports mod-
eling the case where some of the columns are corre-
lated. For the multivariate case the tool currently sup-
ports only Gaussian distributions, and the ability to
fit arbitrary multivariate distributions is planned to be
implemented in future. The side panel in the tool can
be used for selecting one of these cases for the IM
flow. To fit time-independent IID data, user can up-
load the file on the on the page corresponding to the
time-independent data. Once the user uploads a file,
the tool automatically identifies the column headings
and whether each column corresponds to real-valued
(continuous) or integer-valued (categorical) data, cre-
ates histograms showing the marginal distributions of
each columns. It also generates a statistical summary
DataFITR: An Open, Guided Input Modeling Tool for Creating Simulation-Based Digital Twins
281
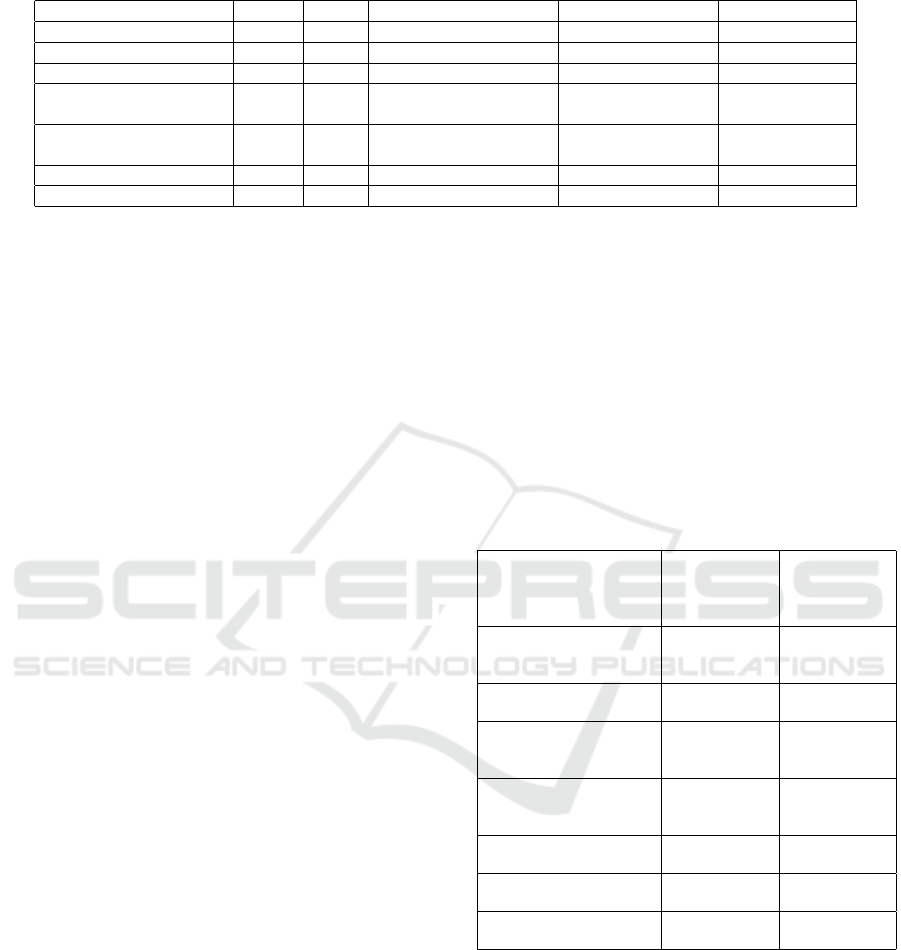
Table 1: Comparison of tools and libraries for IM.
Features Distfit fitter Distribution Analyser Distribution fitter DataFITR
GUI , Visualization × × ✓ ✓ ✓
Random Variable Gen × × ✓ × ✓
Arbitrary distributions × × × × ✓
Support for Multivariate × × × × ✓
Gaussian distribution
Num Goodness of fit 3 1 1 1 3
measures used
Std distributions 89 80 97 80 100
Dependencies Scipy Scipy Scipy, Streamlit Scipy, Streamlit Scipy, Streamlit
of each column. The tool then produces a correla-
tion matrix between every pair of columns and points
out the columns with high correlation. This indicates
to the user whether some quantities need to be mod-
eled using the multivariate case. The user can then
proceed with one column at a time to find the best-
fitting distributions by confirming the details entered
by the tool based on the data (as shown in Figure 2)
and obtain Python code for generating random vari-
ates from that distribution. The user can also edit the
options entered by the tool. The tool then generates
histograms and plots for visualizing the extent of fit
for a selected set of standard distributions ( as shown
in Figure 3) and also generates a distribution match-
ing the histogram using the KDE approach for data
that does not resemble any standard distribution.
DataFITR supports 97 standard continuous dis-
tributions and 3 discrete distributions (Poisson, Bi-
nomial and Geometric ). For continuous distributions,
users can either select the set of popular/common
continuous distributions (such as Normal, Triangu-
lar, Uniform, Exponential, Lognormal, Weibull, and
Gamma) or all of the 97 standard continuous distri-
butions for performing a best fit with the data. For
the selected set of standard distributions, the tool first
finds the distribution parameters (maximum likeli-
hood estimators) to best fit the data, and then for each
distribution it reports three goodness of fit measures
in a table. The Kolmogorov–Smirnov (KS) statistic
quantifies the distance between the empirical distribu-
tion function of the sample and the cumulative distri-
bution function of the reference distribution. The Chi-
squared (χ
2
) test measures the distance between the
normalized data histogram and the probability den-
sity function of the reference distribution. The Sum of
Squared Errors (SSE) metric is the sum of squares of
the differences between the probability density func-
tion (pdf) of the reference distribution and the data
histogram, with a specific bin size selected for the
data. Once a matching distribution is found, the user
can select the desired distribution and the tool gen-
erates Python code that can be directly copied to the
simulation model as shown in Figure 4. Further, the
tool also has a feature for generating Python code for
random variate generation for selected standard distri-
butions. For this the user has to supply the distribution
name and the parameters. Finally, the summary of the
matched distributions can be seen by the user in the
View Output Summary tab.
4 CASE STUDY
Table 2: Model parameters and their values used in the ref-
erence model and estimated values of the model parameters
in the matched model.
Parameter
(unit)
Reference
model
(distribution,
parameter)
Matched
model
(distribution,
parameter)
per job delay of
cap unit (mins)
uniform
a=1.25
b=2.00
uniform
a=1.250
b=1.999
per job delay of
bottle unit(mins)
exponential
λ=0.50
exponential
λ=0.500
per job delay of filling
capping unit(mins)
normal
µ=2.75
σ=0.05
normal
µ=2.7500
σ=0.0505
interval of refill
raw materials(mins)
uniform
a=60
b=90
uniform
a=60.52
b=88.99
amount of plastic
for cap unit(numbers)
constant
1
constant
1
amount of plastic
for bottle unit(numbers)
constant
3
constant
3
amount of drink
for filling (millilitres)
constant
200
constant
200
We present a case study that illustrates the use of the
DataFITR tool for creating simulation-based digital
twins. In this case study we assume that the real sys-
tem is represented by a reference model of a bottling
plant containing various processes and components
as illustrated in Figure 5. We have built a detailed
Discrete-Event simulation model of this system using
the SimPy library (Klaus G. M
¨
uller, 2020) in Python.
Simulating this reference model generates data mim-
icking the data stream that would have been generated
by a manufacturing IoT infrastructure in a real man-
SIMULTECH 2023 - 13th International Conference on Simulation and Modeling Methodologies, Technologies and Applications
282
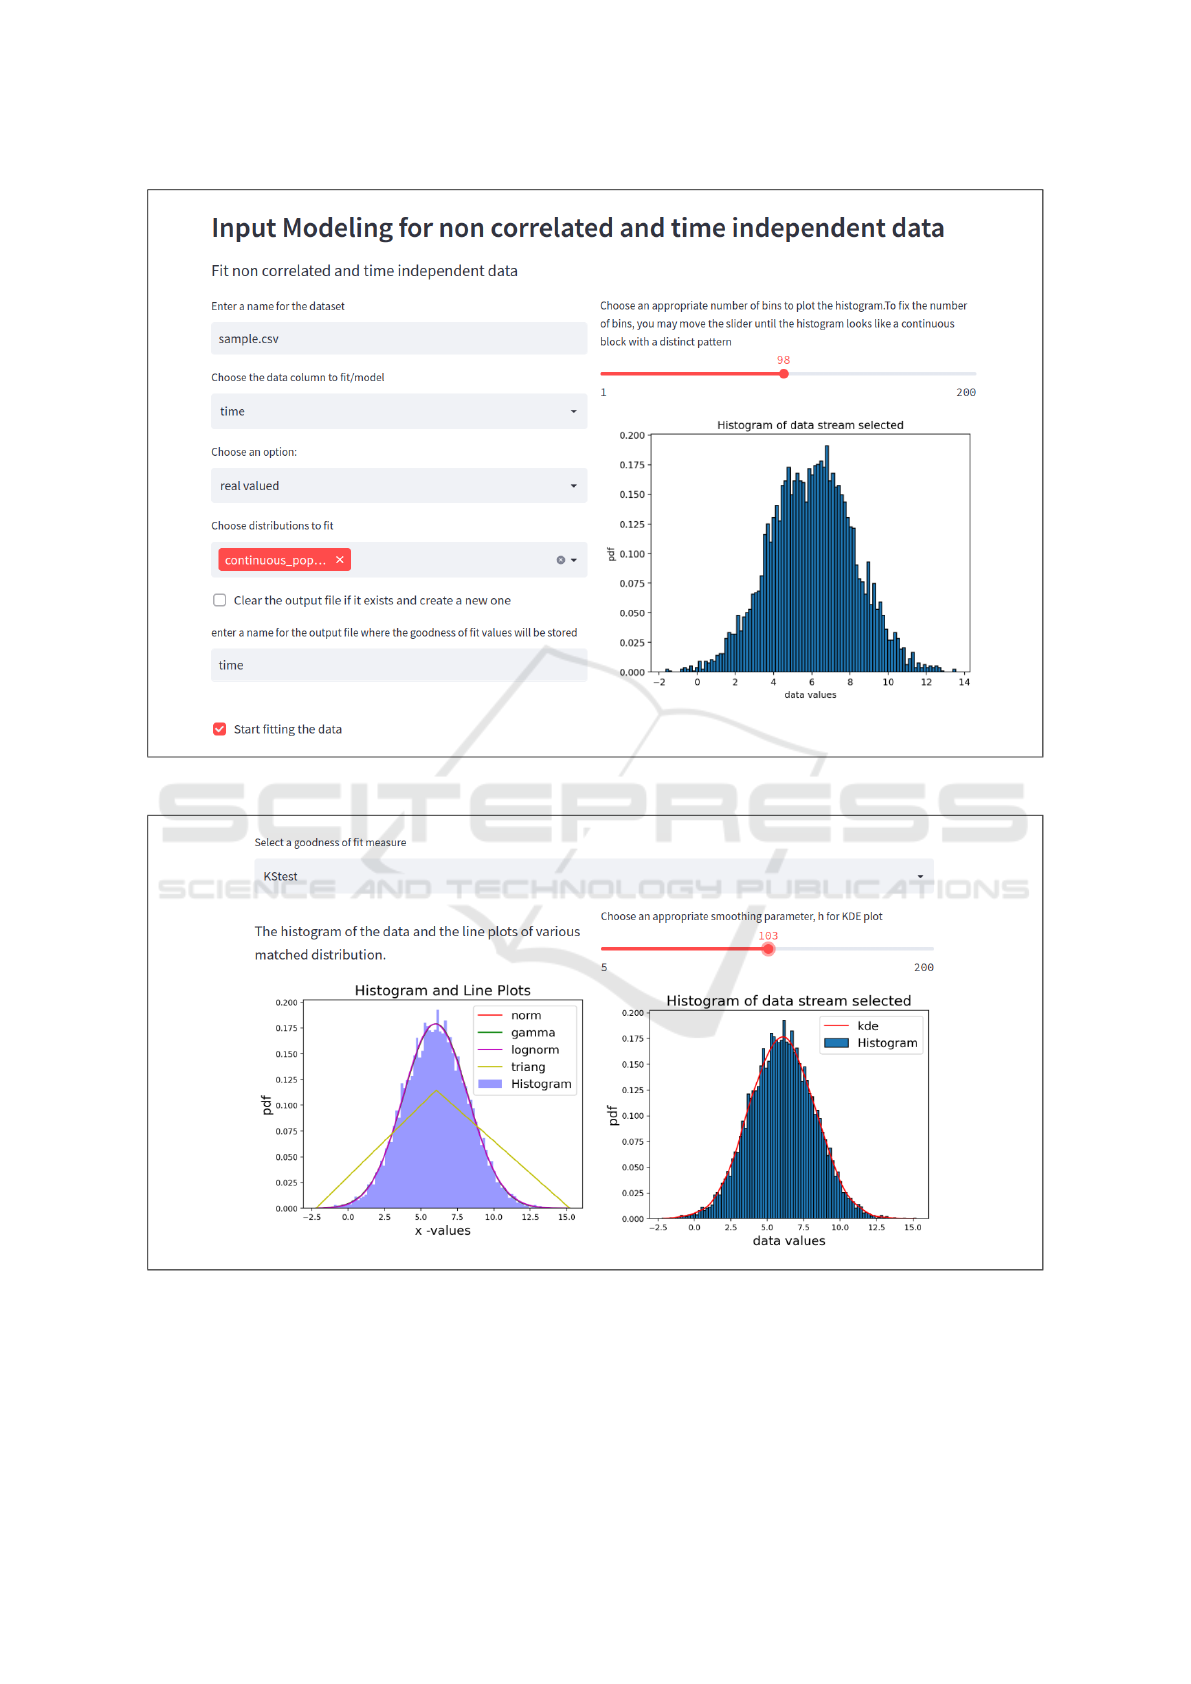
Figure 2: DataFITR: Choosing the datatype, the number of bins and the set of distributions to fit.
Figure 3: DataFITR: Results of IM for the selected column.
ufacturing system. This data is automatically saved
into a csv file and serves as an input to the DataFITR
tool. We then use the generated data along with the
DataFITR tool to build another model (a matched
model) of the system which would serve as the under-
lying model in a simulation-based digital twin. Be-
cause the reference model is known, we can then re-
port the extent of match between the reference model
and the matched model, serving as a validation exer-
cise and an illustration of the utility for the DataFITR
DataFITR: An Open, Guided Input Modeling Tool for Creating Simulation-Based Digital Twins
283
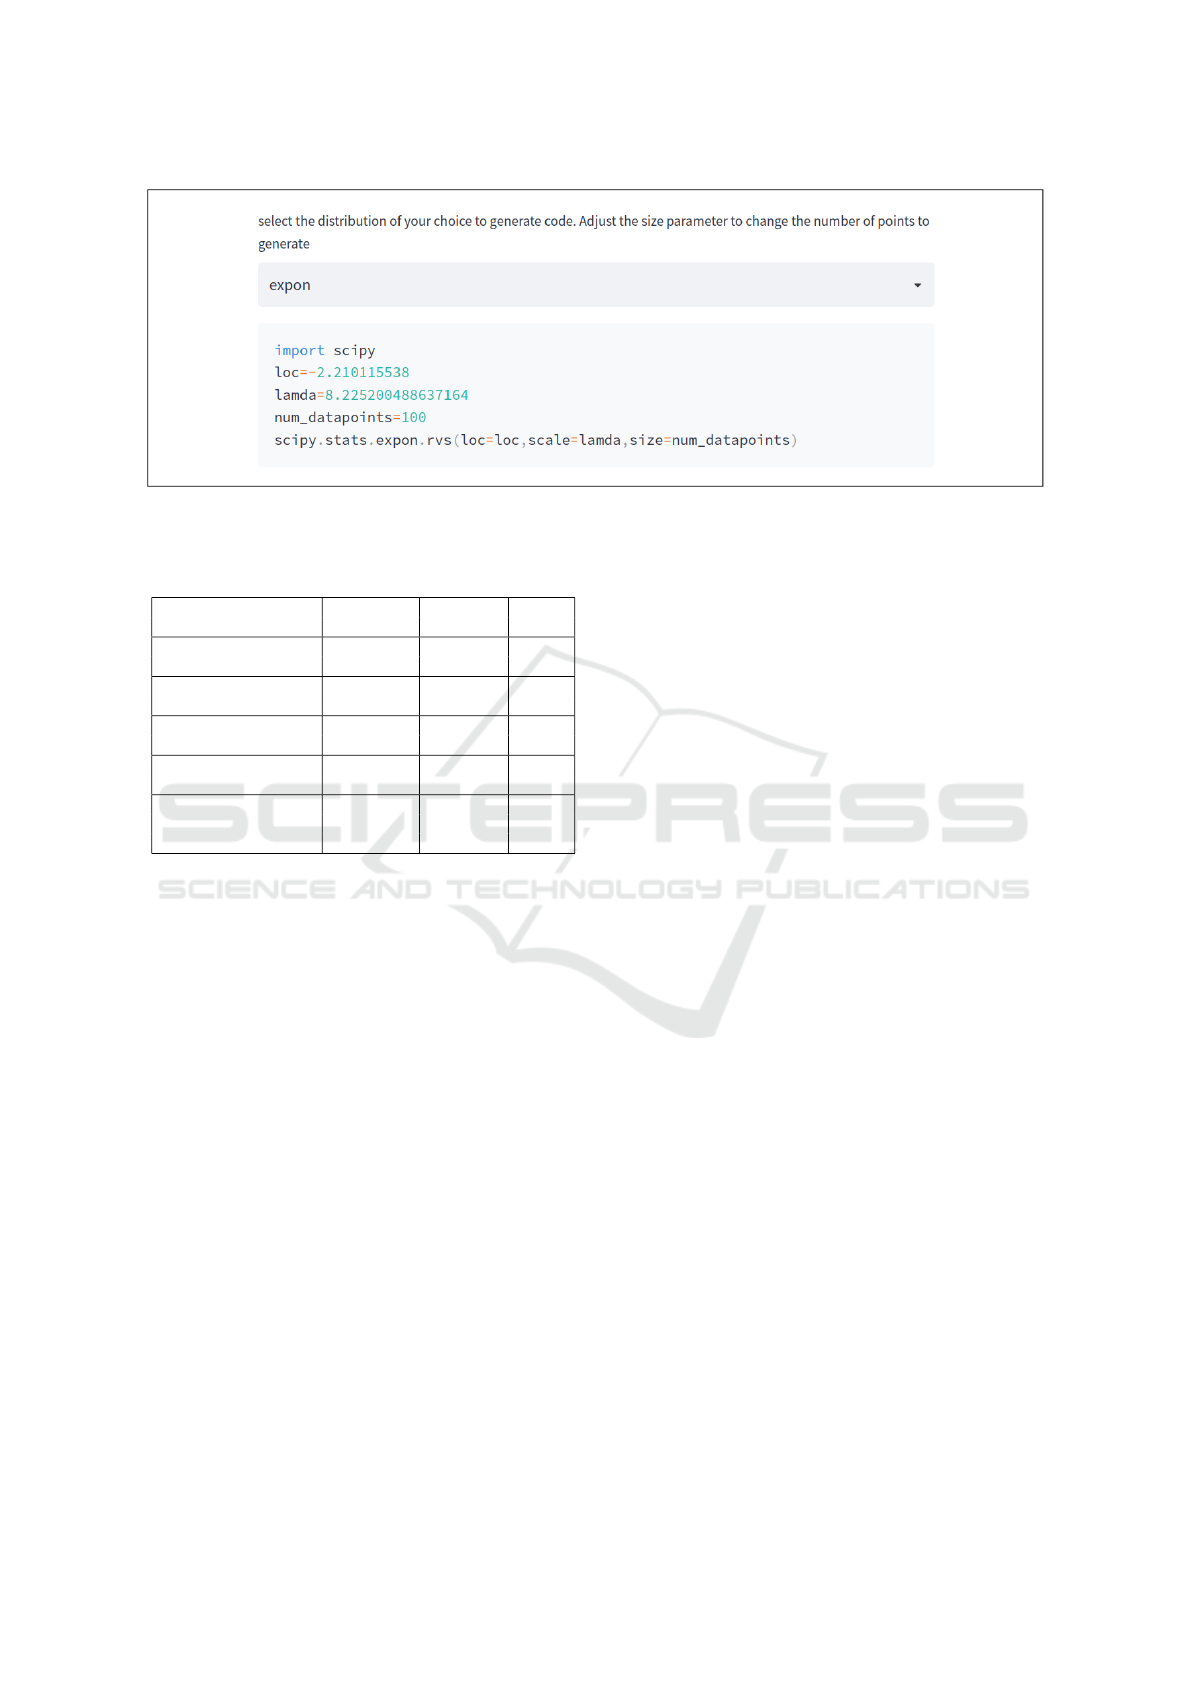
Figure 4: DataFITR: Random variate generation for the fit distribution.
Table 3: Comparison of output performance measures aver-
aged across 750 simulation runs.
Parameter Reference Matched Error
(unit) model model in %
Throughput 18.92000 18.91000 0.035
(Num products/hour)
Average cycletime 6.48700 6.48800 0.006
(mins)
Resource utilisation 0.86970 0.86950 0.004
of cap unit(%)
Resource utilisation 0.86863 0.86861 0.002
of Bottle unit(%)
Resource utilisation 0.86720 0.86710 0.005
of filling-capping
unit (%)
tool.
Figure 5 shows a bottling plant with four stages
connected in an assembly line fashion. The four
stages are cap-making, bottle-making, bottle-filling,
capping, and refilling. The green blocks supply the
raw materials and are real-valued components and the
red blocks are the integer-valued components. The
yellow blocks are the machines where the active man-
ufacturing process takes place. The model’s parame-
ters are the per-job delays at each unit, the amount of
plastic required to make a cap, a bottle and the amount
of drink required to fill a bottle. These are shown in
blue blocks. The raw materials are stored separately
and their levels are monitored continuously. A re-
fill process replenishes the raw materials periodically.
There is downtime for all machines while the refilling
process takes place. The caps and bottle bodies are
manufactured and stored separately. The drink mix
is filled into bottles and capped at the next stage. Fi-
nally, these bottles are moved to a store and can be
supplied to various distribution units.
The process delays are modeled as random vari-
ables with parameters summarized in Table 2. The
reference model generates timestamped data which is
similar to what an IoT framework in a manufacturing
unit would have generated. This data becomes the in-
put to the DataFITR and the generated code from the
DataFITR is used for generating random variables in
the matched model. After this, both the simulation
models are run and a comparison of the output per-
formances is presented to evaluate the extent of the
match of both models.
4.1 Model Parameters and
Implementation
The simulation model parameters identified from the
reference model are listed in Table 2. The first four
parameters are variable and the remaining three are
constant. This reference model is implemented in a
python package called SimPy. It is a framework for
developing Discrete Event Simulation. It is based on
processes which are simple python generator func-
tions. In the reference model, separate processes are
developed to simulate a cap-making unit, a bottle-
making unit, a filling and capping unit, and a refilling
unit. Units that are used to store the raw materials are
modeled as containers which is a shared resource. In
the reference model, plastic and drink mix are stored
in a shared resource called a container with a capacity
of 1000 no.s and 25 L, respectively. The manufac-
tured caps, bottle bodies, and the filled and capped
bottles are stored in another type of resource called
a Store. In one simulation, the plant is run for 1000
hours. 750 such simulations are run, and the parame-
ters listed in Table 3 are estimated from the simulation
runs.
4.2 Performance Estimation and
Results
The output performance measures (such as system
throughput, average cycle time and resource utiliza-
SIMULTECH 2023 - 13th International Conference on Simulation and Modeling Methodologies, Technologies and Applications
284
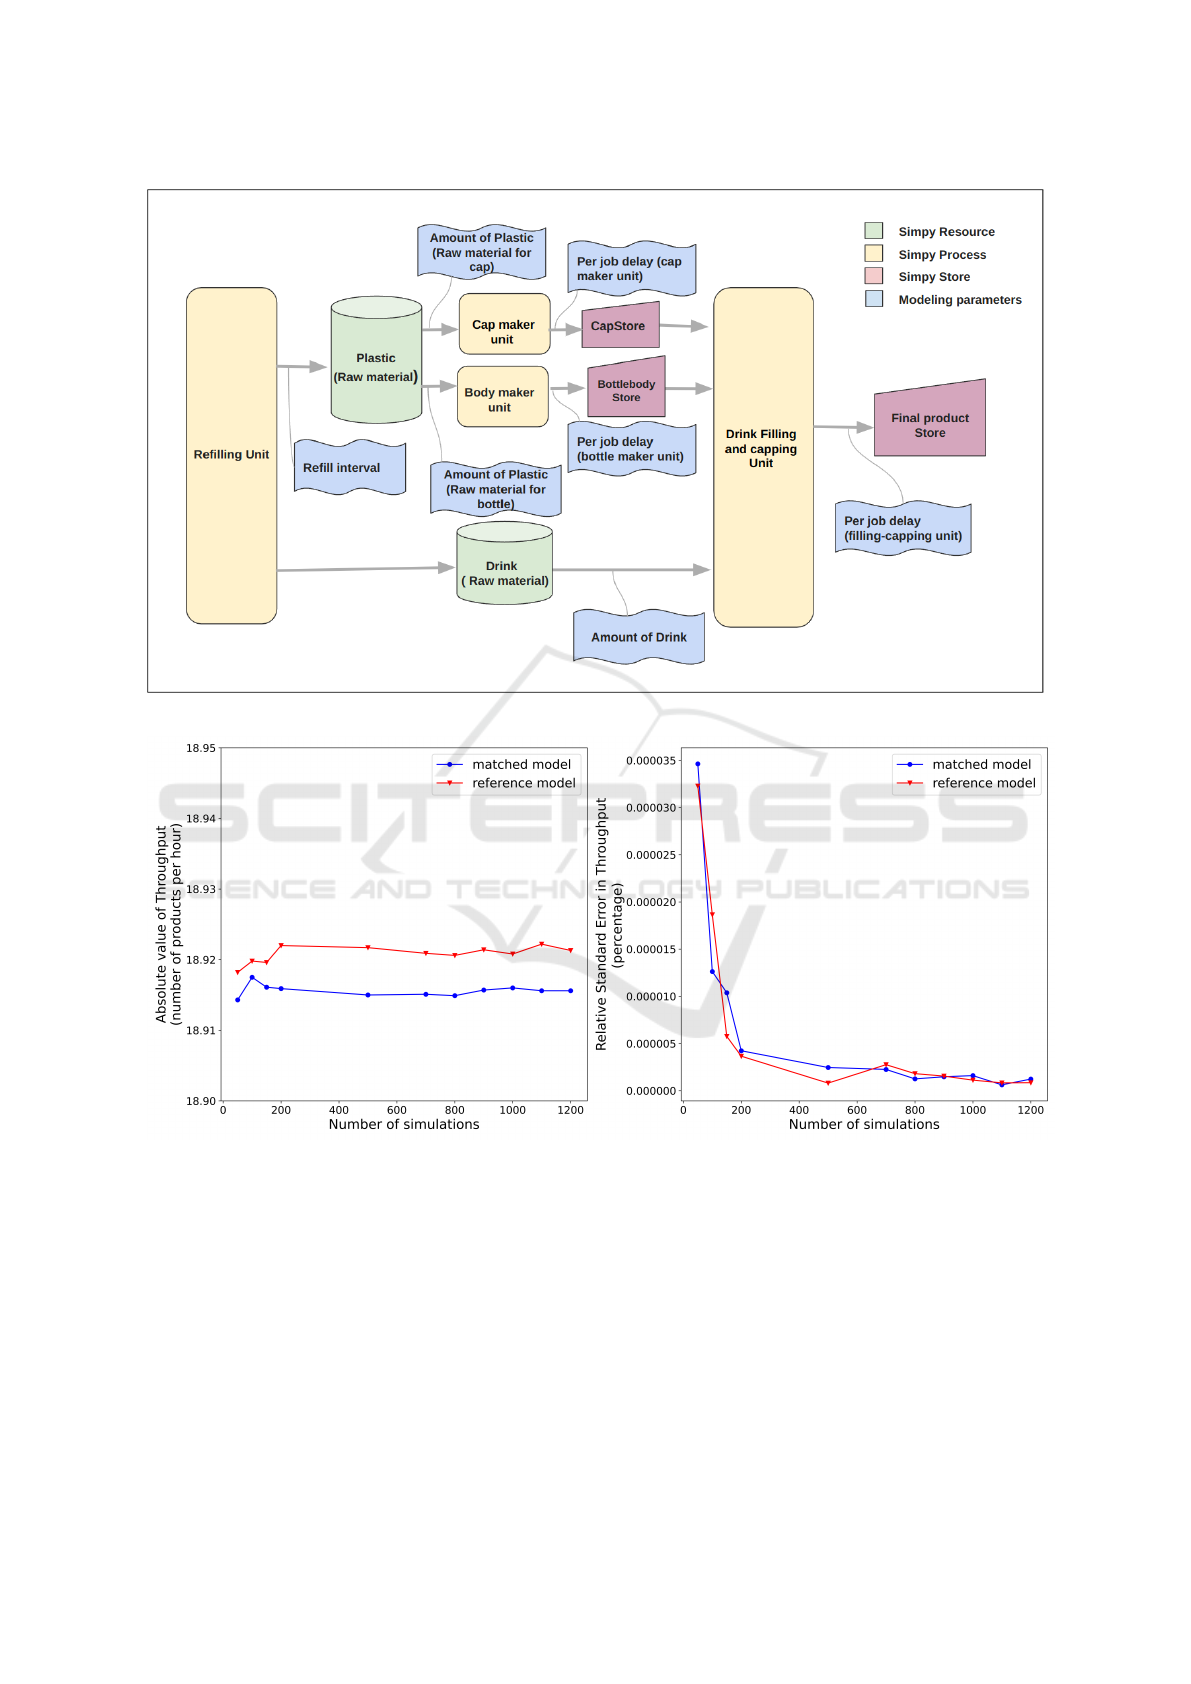
Figure 5: Schematic of a bottling plant.
Figure 6: Plot showing the extent of match between the reference model and matched model. Plot on the left shows the
variation of absolute value of throughput with respect to the number of simulation runs and the plot on the right shows the
variation of the relative standard error in throughput with respect to the number of simulation runs.
tion of each of the processing machines) are estimated
after averaging the results from multiple stochastic
simulation runs. The number of simulation runs re-
quired to get an estimate with reasonable accuracy is
determined after calculating the relative standard er-
ror. Figure 6 shows the extent of match between the
reference model and matched model. The x-axis is
the number of simulation runs, and y-axis are abso-
lute value of throughput and relative standard error in
throughput. The result from the reference model are
compared with the results from the matched model
and summarized in tables 2 and 3. We observe that
the percentage error between the two models is small.
In this exercise, we assumed that a modeler has prior
knowledge about the structure and components in the
model and the DataFITR tool was simply used to
match the parameter values of one model to another.
Inferring the model structure/behavior itself from data
DataFITR: An Open, Guided Input Modeling Tool for Creating Simulation-Based Digital Twins
285

is an interesting problem relevant to rapid deployment
of digital twins. The case study highlights the ease of
use of the DataFITR tool.
5 CONCLUSIONS
This paper presented DataFITR, an open, cloud-based
tool for assisted input modeling. The tool has features
to perform automatic exploratory data analysis, find
correlations between measured quantities, and iden-
tify distributions and their parameters to best match
the observed data using multiple goodness of fit mea-
sures. At each step the tool generates visual aids (such
as histograms and plots) to help the user select an ap-
propriate model and the tool also takes input from the
user such as prior knowledge about the possible set
of distributions likely to mimic observed data. For
data that cannot be modeled using standard distri-
butions, the tool supports generating arbitrary den-
sity functions using the KDE approach. Most im-
portantly, DataFITR automatically generates Python
code for producing random variates of the matching
distribution which the user may directly copy into a
simulation model of the system. We have also pre-
sented a comparison of our tool with other open-
source packages. A case study of a bottling plant
was presented to illustrate the utility of the tool. Cur-
rently, the tool implements models for iid data. Fit-
ting arbitrary multi-variate distributions and modeling
time-dependent data are features planned to be imple-
mented in future versions.
REFERENCES
Banks, J., II, J. S. C., Nelson, B. L., and Nicol, D. M.
(2010). Discrete-Event System Simulation, 5th New
Internatinal Edition. Pearson Education.
Boenn, M. (2022). fitteR: Systematic fit of hundreds
of theoretical univariate distributions to empirical
data. https://cran.r-project.org/web/packages/fitteR/
index.html.
Cen, W., Herbert, E. A., and Haas, P. J. (2020). Nim: Mod-
eling and generation of simulation inputs via genera-
tive neural networks. In 2020 Winter Simulation Con-
ference (WSC), pages 584–595.
Cheng, R. (2017). History of input modeling. In 2017 Win-
ter Simulation Conference (WSC), pages 181–201.
Cokelaer, T. (2020). fitter: A Python library for fitting prob-
ability distributions to data. https://fitter.readthedocs.
io/en/latest/index.html.
DistributionAnalyser (2022). Distribution Anal-
yser:An app to interactively explore and fit
continuous distribution functions. https:
//rdzudzar-distributionanalyser-main-45cc69.
streamlit.app/.
Distributionfitter (2022). Distribution fitter: An app to
compare multiple distributions and find the best one
that fits your data. https://github.com/rahul-raoniar/
distribution
fitter streamlit app.
Fuller, A., Fan, Z., Day, C., and Barlow, C. (2020). Digi-
tal twin: Enabling technologies, challenges and open
research. IEEE Access, 8:108952–108971.
Klaus G. M
¨
uller, T. V. (2020). SimPy:Discrete-event
simulation framework for Python. https://simpy.
readthedocs.io/en/latest/.
Kritzinger, W., Karner, M., Traar, G., Henjes, J., and Sihn,
W. (2018). Digital twin in manufacturing: A cat-
egorical literature review and classification. IFAC-
PapersOnLine, 51(11):1016–1022. 16th IFAC Sym-
posium on Information Control Problems in Manufac-
turing INCOM 2018.
Law, A. M. (2020). ExpertFIT. http://www.averill-law.com/
distribution-fitting/.
Lekshmi P, Neha Karanjkar, T. L. (2023). DataFITR:
public repository. https://github.com/NehaKaranjkar/
DataFITR.
Lumivero (2022). XLSTAT: DISTRIBUTION FITTING.
https://www.xlstat.com/en/.
Nelson, B. and Yamnitsky, M. (1998). Input modeling tools
for complex problems. In 1998 Winter Simulation
Conference. Proceedings (Cat. No.98CH36274), vol-
ume 1, pages 105–112 vol.1.
Parzen, E. (1962). On estimation of a probability den-
sity function and mode. The Annals of Mathematical
Statistics, 33(3):1065–1076.
Software, G. M. (2022). Stat::Fit Distribution Fitting Soft-
ware. https://www.geerms.com.
Streamlit (2022). Streamlit:A open-source app framework
for Machine Learning and Data Science. https://docs.
streamlit.io/.
Taskesen, E. (2020). Distfit: A python package for proba-
bility density fitting of univariate distributions. https:
//erdogant.github.io/distfit/pages/html/index.html.
SIMULTECH 2023 - 13th International Conference on Simulation and Modeling Methodologies, Technologies and Applications
286
