
A Method for Robust and Explainable Image-Based Network Traffic
Classification with Deep Learning
Amine Hattak
1
, Giacomo Iadarola
1
, Fabio Martinelli
1
, Francesco Mercaldo
2,1 a
and Antonella Santone
1
1
Institute for Informatics and Telematics, National Research Council of Italy (CNR), Pisa, Italy
2
University of Molise, Campobasso, Italy
Keywords:
Network Traffic Classification, Deep Learning, Network Intrusion Detection, Explainable AI, Cybersecurity.
Abstract:
In light of the growing reliance on digital technology, the security of digital devices and networks has become
a critical concern in the information technology industry. Network analysis can be helpful for identifying
and mitigating network-based attacks, as it enables the monitoring of network behavior and the detection of
anomalous activity. Through the use of network analysis, organizations can better defend against potential
security threats and protect their interconnected digital systems. In this paper, we investigate the use of deep
learning techniques for network traffic classification. A robust and explainable deep learning-based approach
for traffic classification is proposed starting from raw traffic data represented in PCAP format. This latter
will be transformed into visualized images, which are then used as input for deep-learning models in order
to discriminate malicious activities. We evaluate the effectiveness of the proposed method, by evaluating
two datasets composed of 34389 network traces belonging to 35 categories: 25 related to different malware
families and the remaining 10 categories belonging to trusted applications, reaching an accuracy equal to
96.8%. Moreover, we provide reasoning about model evaluation and the correctness of the models by taking
into account a prediction explainability based on the visualization of the images generated from the network
trace, of the areas symptomatic of a certain prediction.
1 INTRODUCTION AND
RELATED WORK
An intrusion detection system (IDS) is a component
used to detect and prevent unauthorized access to
computer systems and networks. Many approaches to
network traffic analysis have been introduced such as
rule-based which relies on pre-defined signatures to
identify malware and DPI-based which leverages the
inherent properties of network traffic to detect mali-
cious activity (Finsterbusch et al., 2013) which does
not meet the requirements of the network analysis
malware detection anymore. The challenge of classi-
fying encrypted traffic presents a new issue for these
approaches, as it requires proper feature design. This
is particularly challenging due to the high computa-
tional cost of these algorithms, making it difficult to
accurately classify encrypted traffic as benign or ma-
licious.
Although machine learning algorithms have
a
https://orcid.org/0000-0002-9425-1657
shown promising results in network analysis mal-
ware detection, they are not without their limitations
(Dhote et al., 2015) which can be summarized in the
need for feature engineering. This requires domain
expertise and a good understanding of the dataset,
which can be time-consuming and labor-intensive.
Furthermore, these algorithms may not always be able
to capture complex relationships in the data, leading
to limitations in their performance (Casolare et al.,
2021).
In recent years, image analysis has emerged as a
powerful tool for intrusion detection, especially with
the advent of deep learning models. Different deep
learning models, such as Convolutional Neural Net-
works (CNNs) have been used in the literature for
intrusion detection using image analysis (Li et al.,
2017). These models have been trained on image
datasets to identify patterns and anomalies that indi-
cate a potential intrusion.
Deep learning models, particularly those that uti-
lize complex architectures such as CNNs, have be-
Hattak, A., Iadarola, G., Martinelli, F., Mercaldo, F. and Santone, A.
A Method for Robust and Explainable Image-Based Network Traffic Classification with Deep Learning.
DOI: 10.5220/0012083200003555
In Proceedings of the 20th International Conference on Security and Cryptography (SECRYPT 2023), pages 385-393
ISBN: 978-989-758-666-8; ISSN: 2184-7711
Copyright
c
2023 by SCITEPRESS – Science and Technology Publications, Lda. Under CC license (CC BY-NC-ND 4.0)
385

come increasingly popular in recent years for a
wide range of tasks, including intrusion detection
(Vinayakumar et al., 2017). However, the nature of
these models, which are highly non-linear and data-
driven, has led to them being considered black boxes.
This lack of transparency in the decision-making pro-
cess can make it difficult to understand how the model
is making its predictions and why it is making cer-
tain decisions. This is particularly problematic in the
context of intrusion detection, as it is important to un-
derstand why a model is identifying a certain image
as potentially malicious and to be able to explain this
decision to other interested parties.
To address this issue, in this paper, we propose
the use of visualization techniques such as Grad-
CAM (Gradient-weighted Class Activation Mapping)
to make deep learning models more interpretable
(Selvaraju et al., 2016). Grad-CAM works by com-
puting the gradient of the class score with respect to
the feature maps of the last convolutional layer in the
model and generating a heatmap that highlights the
regions of the image that are most important for the
model’s prediction. This allows researchers to un-
derstand how the model is making its predictions and
identify the regions of the image that are most indica-
tive of a potential intrusion. Moreover, the use of im-
age comparison techniques such as SSIM (Structural
Similarity Index) (Sara et al., 2019) can be employed
to compare the heatmap images generated by differ-
ent deep learning models for Network traffic classifi-
cation based on image analysis. In recent studies, two
novel metrics, IM-SSIM and IF-SSIM,(Iadarola et al.,
2022) have been used to evaluate the performance of
deep learning models in image-based malware detec-
tion. The IM-SSIM metric was used to compare the
heatmaps generated by different models for the same
malware family, providing information on how much
the models differ in classifying the same samples.
The IF-SSIM metric, on the other hand, focused on
a single model and provided information on the vari-
ability of heatmaps generated for the same malware
family. These two metrics, when used in conjunction
with the traditional performance metrics, such as ac-
curacy and precision, provide a more comprehensive
analysis of the deep learning models and their robust-
ness in detecting unknown malware patterns.
In general, the goal and the novelty of this step is
to understand the difference in decision-making be-
tween the models, and if they agree on the same re-
gions as important for the prediction. By comparing
the heatmaps of two images generated by different
models, we can identify any discrepancies and un-
derstand if there are any patterns or regions that the
models consistently disagree on.
For these reasons, we consider the proposed
method robust and explainable: as a matter of fact
is explainable because we provide a kind of (visual)
explanation behind the prediction through the adop-
tion of Grad-CAM aimed to highlight the areas of
interest in the image. Moreover, with the introduc-
tion of the two novel metrics (i.e., IM-SSIM and IF-
SSIM) we provide also robustness: in fact, the met-
rics help to understand whether the area highlighted
by the grad-cam is the same (for the same images) for
different models, therefore allowing to increase the
confidence in the use of deep learning. The main con-
tribution regards the adoption of such novel metrics
within image-based network traffic.
The paper proceeds as follows: in the next section,
the proposed method is introduced; in Section 3 the
experimental analysis is presented; and, finally, in the
last section conclusion and future research directions
are drawn.
2 THE METHOD
In this work, we propose a method for image-
based network traffic classification using deep learn-
ing models. The proposed method is aimed to evi-
dence the accuracy and robustness of intrusion detec-
tion systems by using image analysis techniques. It
is centered on the explanations of individual input-
output pairs and therefore employs local explanation
techniques. However, we also suggest aggregating
the input-output pairs into sets of output classes to
provide explanations for decisions made by entire
classes. This method can be applied to any deep learn-
ing (DL) model that has the capability to use Grad-
CAM, as long as the model has convolutional layers.
The majority of the steps, excluding data preprocess-
ing, can be automated and do not require expertise or
solid knowledge.
Figure 1: Overall schema of the method.
For a clearer comprehension of the proposed
method, it can be broken down into several steps, as
depicted in Figure 1. This figure illustrates the pro-
posed approach for assessing the prediction of net-
SECRYPT 2023 - 20th International Conference on Security and Cryptography
386

(a) Avzhan. (b) Bunito. (c) FTP. (d) Geodo.
(e) Gmail. (f) Htbot. (g) Miuref. (h) Shifu.
Figure 2: A visualization analysis of some traffic classes.
work intrusion detection deep learning-based models.
The initial step involves collecting samples including
both ”trusted” and ”malware” network traffic to build
the dataset. The latter shall encompass a wide range
of network traffic, but it is crucial to label each sam-
ple and categorize them into families. This dataset
will be used to train and test the deep learning mod-
els. In order to make the data usable for the deep
learning models, we propose a transformation from
RAW files which are presented in PCAP format to
visualized images which represents the second step
of the proposed method. This allows us to use the
data as input for training and testing tasks. There are
two modes for image generation either on grayscale
or color (RGB). As a subsequent step, the deep learn-
ing (DL) models carry out resizing on the input im-
ages, which entails using images of similar size, but
if the dimensions vary greatly, the loss of information
can negatively impact the accuracy of the DL models.
They will be also trained and tested on the dataset, and
their performance will be evaluated based on the clas-
sification task. In the final phase of our method, for
the purpose of gaining a comprehensive understand-
ing of the decision-making process of these models,
and identifying the regions of the image that are cru-
cial for the models’ decisions, we apply Grad-CAM
to generate heatmaps. We also compute similarities
between the heatmaps generated by different models.
By using this method, we aim to manifest the perfor-
mance and robustness of network intrusion detection
systems based on image analysis techniques. On the
other hand, we aim to understand the decision-making
process of the models and identify the highlighted re-
gions of the image that are important for the model’s
decision. Additionally, comparing the heatmaps gen-
erated by different models will help us identify any
discrepancies between them and understand if they
agree on the same regions as substantial, which is cru-
cial for a robust network traffic classification.
Different network traffic will generate different
images, based on this assumption we perform an
(a) BitTorrent.
(b) Facetime.
(c) Kelihos. (d) Wannacry.
Figure 3: Similarities in the same traffic class.
examination of the visual representation of gener-
ated images shown in Figure 2 highlights the dis-
tinct differences between the various classes. These
classes possess unique features that are easily notice-
able through visual observation. A deeper under-
standing of this characteristic of samples within the
same class possessing similar features while differing
from those in other classes can help to correctly clas-
sify samples. This is because the model can leverage
the similarities within each class to effectively learn
and recognize the unique features associated with that
class. For example, if we consider the visual repre-
sentation of network traffic in Figure 3, it can be seen
that samples within the same class tend to have simi-
lar textures and compositions, making it easier for the
model to identify and distinguish that particular class.
Conversely, the differences between classes can also
provide crucial information to the model during the
classification process, allowing it to accurately distin-
guish between classes and make informed decisions.
Observing the heatmaps generated by various
deep-learning models in Figure 4 can reveal differ-
ences in the decision-making process of each model
and highlight different areas within the same sample.
By visualizing the regions where the model focuses
its attention, we can gain insights into the features
that are deemed most relevant for the model to make
its prediction. This information can be used to better
understand the strengths and weaknesses of different
models and to refine them accordingly.
In general, when evaluating the performance of
deep learning models for image classification tasks,
it is important to ensure that the models are able to
identify and agree on the key distinguishing features
of the images. For example, when classifying images
of dogs and cats, both models should be able to cor-
rectly identify the presence of a dog or a cat in the
image and highlight the relevant features for classifi-
cation. However, suppose one model is highlighting
features that are not relevant to the task, such as high-
lighting the background of the image instead of the
animal. In that case, it may indicate that the model
is not properly trained or that there are issues with
A Method for Robust and Explainable Image-Based Network Traffic Classification with Deep Learning
387
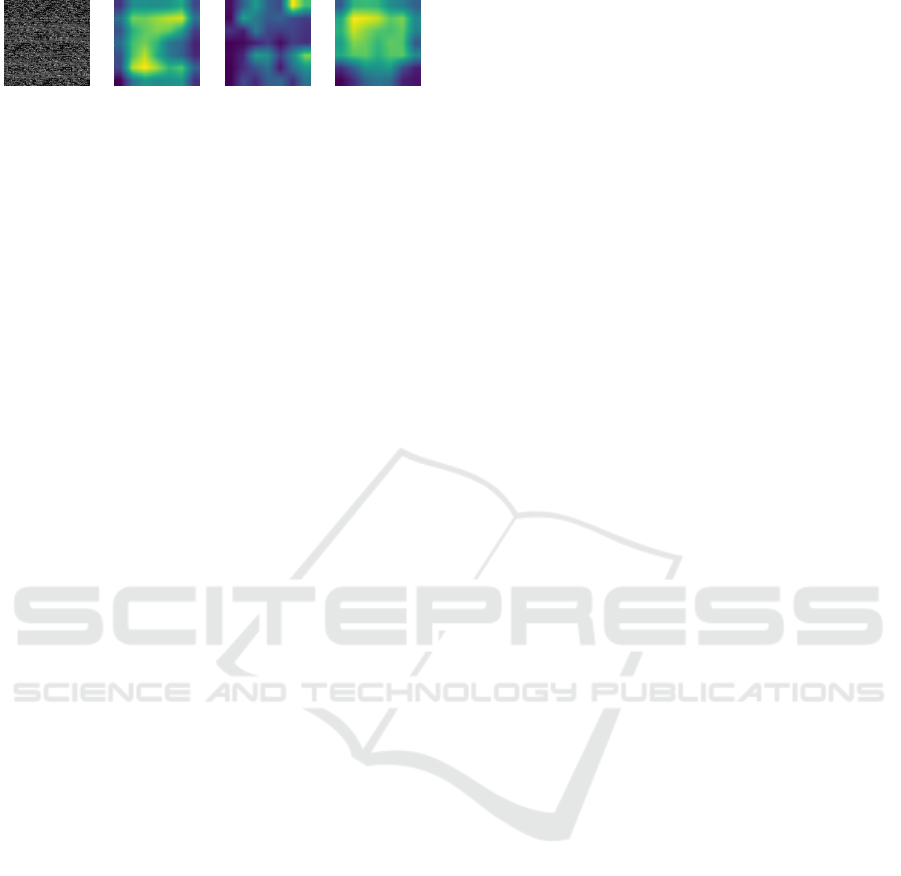
(a) Zeus. (b) Dense. (c) ResNet. (d) MobNet.
Figure 4: A plot of a malware sample which classified cor-
rectly belonging to Zeus including the heatmap of 3 models.
the dataset. In such cases, it may be necessary to re-
evaluate the dataset and fine-tune the model’s archi-
tecture or training parameters to improve its perfor-
mance. Additionally, using visualization techniques
such as grad-CAM can help to understand the model’s
decision and compare the important region generated
by different models. This will help to check if the
models agree on the same areas and if they are high-
lighting the important features. Furthermore, image
similarity metrics like SSIM will be used to compare
the heatmaps generated by different models. By cal-
culating the similarity between the heatmaps. This
can provide valuable insights into the performance of
the models and help to identify any issues that may
need to be addressed.
3 EXPERIMENTAL ANALYSIS
In this section, we describe the experiment we con-
ducted in order to demonstrate the effectiveness of the
proposed method. We first describe the (real-world)
datasets we considered and then we present the ex-
perimental results.
3.1 Dataset
Having a decent dataset is of utmost importance in
any machine learning research, especially in the field
of network traffic classification. The quality and di-
versity of the dataset play a crucial role in the perfor-
mance of the models and the results of the research.
Finding a suitable dataset can be a challenging task, as
network traffic samples are hard to come by, and it is
not always possible to obtain real-world samples. Ad-
ditionally, using self-made samples in a laboratory or
private traffic of security companies can lead to bias
and compromise the credibility of the results, which
is why it is not recommended.
For these reasons, we employed a combination
of two datasets to train and evaluate our proposed
method. The first dataset is known in the state-of-the-
art literature as the USTC-TFC2016 dataset and it is
publicly available on a GitHub repository (Wei Wang,
2016). This dataset consists of a diverse set of net-
work traffic samples, including a variety of proto-
cols such as (FTP, P2P) used by several applications.
The second dataset is a set of additional samples
from The Stratosphere Laboratory at the CTU Uni-
versity of Prague in the Czech Republic (University,
2016) which includes only malware traffic belong-
ing to other families. The combined datasets con-
tain a total of 34,389 samples, belonging to 35 differ-
ent classes: 25 to different malware families and the
remaining 10 belonging to trusted applications. The
samples are classified and presented in Tables 1 and
2, which present information regarding trusted and
malware samples, specifying their families for bet-
ter categorization. The samples are divided into three
sets: training, validation, and test, with a split ratio of
80:10:10 respectively. There are 2,873 samples in the
test set, while the training set consists of 25,589 sam-
ples, which are further split into 22,757 specifically
for training and the remaining 2,832 for validation.
The samples from each family are evenly distributed
among the sets to ensure a balanced distribution.
3.1.1 Malware Traffic
The following provides a brief explanation of some
malicious behavior per malware/family:
Avzhan: is a type of malware that encrypts the vic-
tim’s files and demands payment in exchange for the
decryption key. It typically spreads through phishing
emails, malicious websites, and software vulnerabil-
ities. Upon infection, the ransomware will scan the
device for files to encrypt and display a ransom note
with payment instructions.
Cridex: is a Trojan-Banker that is designed to steal
financial information from the infected device. It
typically spreads through phishing emails, malicious
websites, or software vulnerabilities. Once installed,
Cridex will monitor the victim’s online activity and
steal sensitive information, such as login credentials
and credit card numbers.
Virut: is a type of worm that spreads by infecting
executable files on the victim’s device. It can also
infect the Master Boot Record, making it difficult to
remove. Virut spreads through phishing emails, mali-
cious websites, and software vulnerabilities.
Htbot: is a type of backdoor that allows an at-
tacker to remotely control the infected device. It
spreads through phishing emails, malicious websites,
and software vulnerabilities. Once installed, Htbot
listens for commands from the attacker and can be
used to steal sensitive information, install additional
malware, or participate in a botnet.
SECRYPT 2023 - 20th International Conference on Security and Cryptography
388

3.1.2 Trusted Traffic
The following provides a brief explanation of the pro-
tocols used in three trusted traffic samples:
BitTorrent: is a popular peer-to-peer (P2P) file-
sharing protocol that allows users to share large files
by dividing them into smaller pieces and distributing
them across multiple devices. BitTorrent relies on a
decentralized network of users to share and distribute
the data, reducing the load on a single server.
Facetime: is a voice and video calling application
that is commonly used on Apple devices. It uses
the Internet Protocol (IP) to transmit voice and video
data, allowing for real-time communication between
devices. Facetime also supports screen sharing and
group video calls.
SMB: also known as Server Message Block, is a
file and print sharing protocol that is commonly used
on Microsoft Windows-based networks. SMB allows
clients to access shared resources on a server, such as
files, and printers, and provides a secure and reliable
communication channel for transferring data. SMB
supports various data transfer operations, including
read, write, and execute operations.
3.2 Image Generation
The process of converting captured network data in
PCAP format to an image is a method of visualizing
network traffic data in a more intuitive and human-
readable format, while also providing valuable input
for training deep learning models. This approach al-
lows for the analysis and interpretation of network
traffic patterns in a more efficient and effective way
by identifying trends and anomalies in network traffic
that may not be immediately apparent in the raw data.
The process typically involves first reading the binary
data of the PCAP file, then calculating the size of the
image, reshaping the data to create a 2D array, and fi-
nally, converting the data to an image using an image
processing library. Depending on the requirement,
the image can be in grayscale or RGB mode. The
grayscale image is created by using the same data for
all three channels (red, green, and blue) and reshaping
it according to the image size. The RGB image is cre-
ated by creating three separate arrays for red, green,
and blue channels, and then stacking them together to
create the final data array. This final data array is then
used to create the RGB image.
The images generated through this process will
be used as input for training various deep-learning
models. The ability of deep learning models to au-
tomatically extract features and patterns from images
makes them well-suited for analyzing network traffic
data. Furthermore, the ability to create a large dataset
of network traffic images will be used to train and
evaluate different deep learning architectures, such as
models that are known in the literature (DenseNet,
AlexNet, MobileNet, etc.), to find the most suitable
model for a specific task. Overall, the main idea be-
hind the conversion of network traffic data to images
is to provide valuable input for training deep learning
models, which in turn can help to investigate which
model will be the best for this task.
3.3 Deep Learning Models
In this work, various deep learning (DL) models were
utilized to assess their performance on Network Traf-
fic represented as images. Well-known models in the
literature used in this research, such as AlexNet, In-
ception, DenseNet, ResNet50, MobileNet, VGG16,
and VGG19 are well-established models that have
been widely reported in the literature and proven to be
effective in different tasks such as image classification
(Sharma et al., 2018), face recognition (Goel et al.,
2021), etc. These models have been highly optimized
and fine-tuned over the years, which has led to their
widespread adoption in the field of DL. Our custom
models, such as CNN (we refer to with the name Our-
CNN), were designed and implemented with the spe-
cific requirements of the problem in mind. The results
obtained from the experiments conducted with these
different models were compared, and the most suit-
able model was selected based on their performance.
This approach allowed us to leverage the advantages
of pre-trained and custom-designed models to arrive
at an optimal solution. The results obtained from
these models will be compared with other predefined
models to determine their performance and effective-
ness. The goal of this comparison is to evaluate the
proposed models against other state-of-the-art models
and to gain a better understanding of their strengths
and limitations. The table 3 shows the main hyper-
parameters employed for training the deep learning
models.
3.3.1 Our CNN
The CNN model used in this work is a feedforward
deep neural network designed for image classifica-
tion tasks. It consists of multiple layers of convolu-
tion, max-pooling, and fully-connected dense layers.
The first three layers are Conv2D with 32, 64, and
128 filters respectively and each layer uses a 3x3 ker-
nel size with ReLU activation. These are followed
by MaxPooling2D layers with a 2x2 pool size, to re-
duce the spatial dimensions of the feature maps and
retain the most important information. The feature
A Method for Robust and Explainable Image-Based Network Traffic Classification with Deep Learning
389

Table 1: The list of trusted network traffic and their appropriate class.
Name Class Name Class
BitTorrent P2P Outlook Email/WebMail
Facetime Voice/Video Skype Chat/IM
FTP Data Transfer SMB Data Transfer
Gmail Email/WebMail Weibo Social Network
MySQL Database WorldOfWarcraft Game
Total trusted classes 10
Table 2: Malware network traffic and their corresponding families.
Name Family Name Family Name Family
Andromeda Botnet Avzhan Ransomware Bunitu Trojan
Caphaw Banking trojan Cedar Trojan CerberRansomeware Ransomware
Cridex Trojan-Banker Dridex Banking trojan Emotet Trojan
Geodo Trojan-Banker Htbot Backdoor Kazy Trojan
Kelihos Botnet Miuref Trojan-Downloader Neris Trojan-Banker
NjRat RAT Nsis-ay Trojan Shifu Trojan-Banker
Stlrat Trojan Tinba Trojan-Banker Upatre Downloader
Virut Worm Wannacry Ransomware Yakes Trojan
Total malware families 25 Zeus Trojan-Banker
maps are then flattened in the Flatten layer and regu-
larized using Dropout layers with a rate of 0.5. The
model also has three dense layers with 512, 256, and
num classes neurons, respectively, each followed by
a dropout layer. The final layer has num classes neu-
rons and uses softmax activation to produce the final
probabilities for each class.
3.3.2 WangCNN
The WangCNN model was designed in a previous
work (Wang et al., 2017) for Malware traffic classifi-
cation using a Convolutional Neural Network (CNN)
for representation learning. It is similar to the LeNet-
5 model (LeCun et al., 1995). It has a two-layer con-
volution with 32 and 64 filters and two max pooling
layers. It also has two fully connected layers with
1024 and 10 neurons. A softmax function is used for
class probability output and dropout is applied to pre-
vent overfitting. It was designed to perform well on
the task of Malware traffic classification and has been
named in this work as WangCNN. The model will be
trained and evaluated on our proposed dataset, and
its performance will be compared with other models
based on metrics such as accuracy, precision, recall,
and AUC. The goal is to determine the effectiveness
of the WangCNN model for this particular task.
3.4 Results and Discussion
3.4.1 Results
The results in the table 5 present the perfor-
mance comparison of various deep learning mod-
els on the test sets of Grayscale and RGB datasets.
The models evaluated are OurCNN, WangCNN,
AlexNet, DenseNet, MobileNet, ResNet50, VGG16,
and VGG19. The metrics used to evaluate the models
are Accuracy (Acc), Precision (Prec), Recall (Rec),
F1-score (F1), and Area Under the Curve (AUC). This
table is useful to evaluate the generalization of the
models and it gives an idea of how well the models
will perform on unseen data.
Upon analyzing the provided results, the top 4
models exhibiting strong performance across both
Grayscale and RGB datasets can be identified.
DenseNet consistently demonstrates exceptional per-
formance in terms of accuracy, precision, recall, F1-
score, and AUC for both datasets, making it the top
performer with an accuracy equal to 0.982. Mo-
bileNet, the second strongest model, showcases com-
mendable results in the Grayscale dataset and excels
in the RGB dataset with high accuracy at 0.972 and
outstanding precision, recall, F1-score, and AUC val-
ues. ResNet50, ranking third, delivers solid perfor-
mance in both Grayscale and RGB datasets, featur-
ing high accuracy equal to 0.982 in Grayscale im-
ages and competitive precision, recall, F1-score, and
AUC values for both datasets. Finally, OurCNN holds
the fourth position, displaying good performance in
both Grayscale and RGB datasets with relatively high
accuracy values. Although the performance metrics
of OurCNN, such as precision, recall, F1-score, and
AUC, are competitive, they are not as high as the top
3 models mentioned. These four models demonstrate
superior overall performance in the classification task
for Grayscale and RGB images compared to the other
models listed in the tables. In contrast, VGG16
SECRYPT 2023 - 20th International Conference on Security and Cryptography
390

Table 3: The hyperparameters of different DL models.
Model OurCNN WangCNN Alex Dense Mobile ResNet VGG16 VGG19
Input image/vector size 224x224x3
Epochs and Batch size 30 and 32
Number of layers 6 4 20 121 29 50 16 19
and VGG19 show relatively lower performance in
Grayscale images, particularly in terms of Recall and
F1-score. In the RGB mode, VGG16 demonstrates
a considerable drop in performance, with the lowest
Recall and F1 score among all the models. Addition-
ally, it can be observed that some models perform bet-
ter on one type of dataset than the other, highlighting
the importance of choosing the appropriate model for
the data at hand. Overall, the table provides a com-
prehensive evaluation of the deep learning models’
performance on the given classification task, reveal-
ing the effectiveness of each architecture in handling
Grayscale and RGB datasets.
Table 4: Performance results on a subset of the dataset
(Grayscale images).
Class Model IF-SSIM IM-SSIM
Cedar DenseNet 0.901
0.416
ResNet50 0.592
MobileNet 0.810
0.232
OurCNN 0.387
Gmail DenseNet 0.617
0.501
ResNet50 0.514
MobileNet 0.497
0.271
OurCNN 0.226
NjRat DenseNet 0.834
0.629
ResNet50 0.646
MobileNet 0.894
0.200
OurCNN 0.234
SMB DenseNet 0.644
0.461
ResNet50 0.482
MobileNet 0.648
0.258
OurCNN 0.305
Wannacry DenseNet 0.787
0.549
ResNet50 0.499
MobileNet 0.605
0.265
OurCNN 0.205
Weibu DenseNet 0.630
0.457
ResNet50 0.498
MpbileNet 0.633
0.289
OurCNN 0.285
Table 4 shows the results of two performance
metrics (IF-SSIM and IM-SSIM) applied to a sub-
set of trusted (Gmail and SMB) and malware families
(Cedar, NjRat, Wannacry, and Weibu) represented as
grayscale. The grayscale images were chosen in this
experiment due to their superior performance com-
pared to RGB images. The metrics were computed
for four different deep-learning models (DenseNet,
ResNet, MobileNet, and OurCNN). Two performance
metrics, IF-SSIM and IM-SSIM, were applied to eval-
uate the similarity of the heatmaps generated by the
models for each sample. The IF-SSIM metric fo-
cuses on a single model and measures the difference
in heatmaps generated for the same class using the
same model. On the other hand, IM-SSIM compares
heatmaps generated by a subset of models for a spe-
cific class. The results in the table show the average
SSIM value for each combination of class and DL
model.
A comprehensive analysis of the results in table
4 indicates that DenseNet consistently achieves the
highest IF-SSIM values across all six classes, sug-
gesting that it is the most effective model in captur-
ing the relevant features in the heatmaps, moreover
the model relies on a single, specific region of the in-
put samples for accurate image classification. It uti-
lizes the information contained within this restricted
input area to perform the classification, as evidenced
by the IF-SSIM values being close to 1, indicat-
ing high similarity among the heatmaps. MobileNet
and ResNet50 exhibit competitive performance, with
MobileNet slightly outperforming ResNet50 in most
cases. However, OurCNN demonstrates the lowest
IF-SSIM values among the four models for all classes,
indicating room for improvement in its heatmap sim-
ilarity capabilities.
The IM-SSIM values represent the overall similar-
ity between heatmaps generated by the models, and
the observed differences across classes indicate vary-
ing levels of heatmap similarity across the tested mod-
els. Regarding the IM-SSIM metric, the results show
that NjRat class has the highest value, followed by
Wannacry and Gmail, which means that the models
do agree: the input area used by one model is similar
to the area of the other one. while the Cedar class has
the lowest value of 0232, this implies that the mod-
els (MobileNet and OurCNN) do not concur: the in-
put region utilized by one model differs from the area
employed by the other.
The image 5 reported the confusion matrix nor-
malized. The confusion matrix serves as a visual rep-
resentation of a classification model’s performance,
with predicted labels on the x-axis and true labels on
the y-axis. This layout allows for a clear compari-
A Method for Robust and Explainable Image-Based Network Traffic Classification with Deep Learning
391
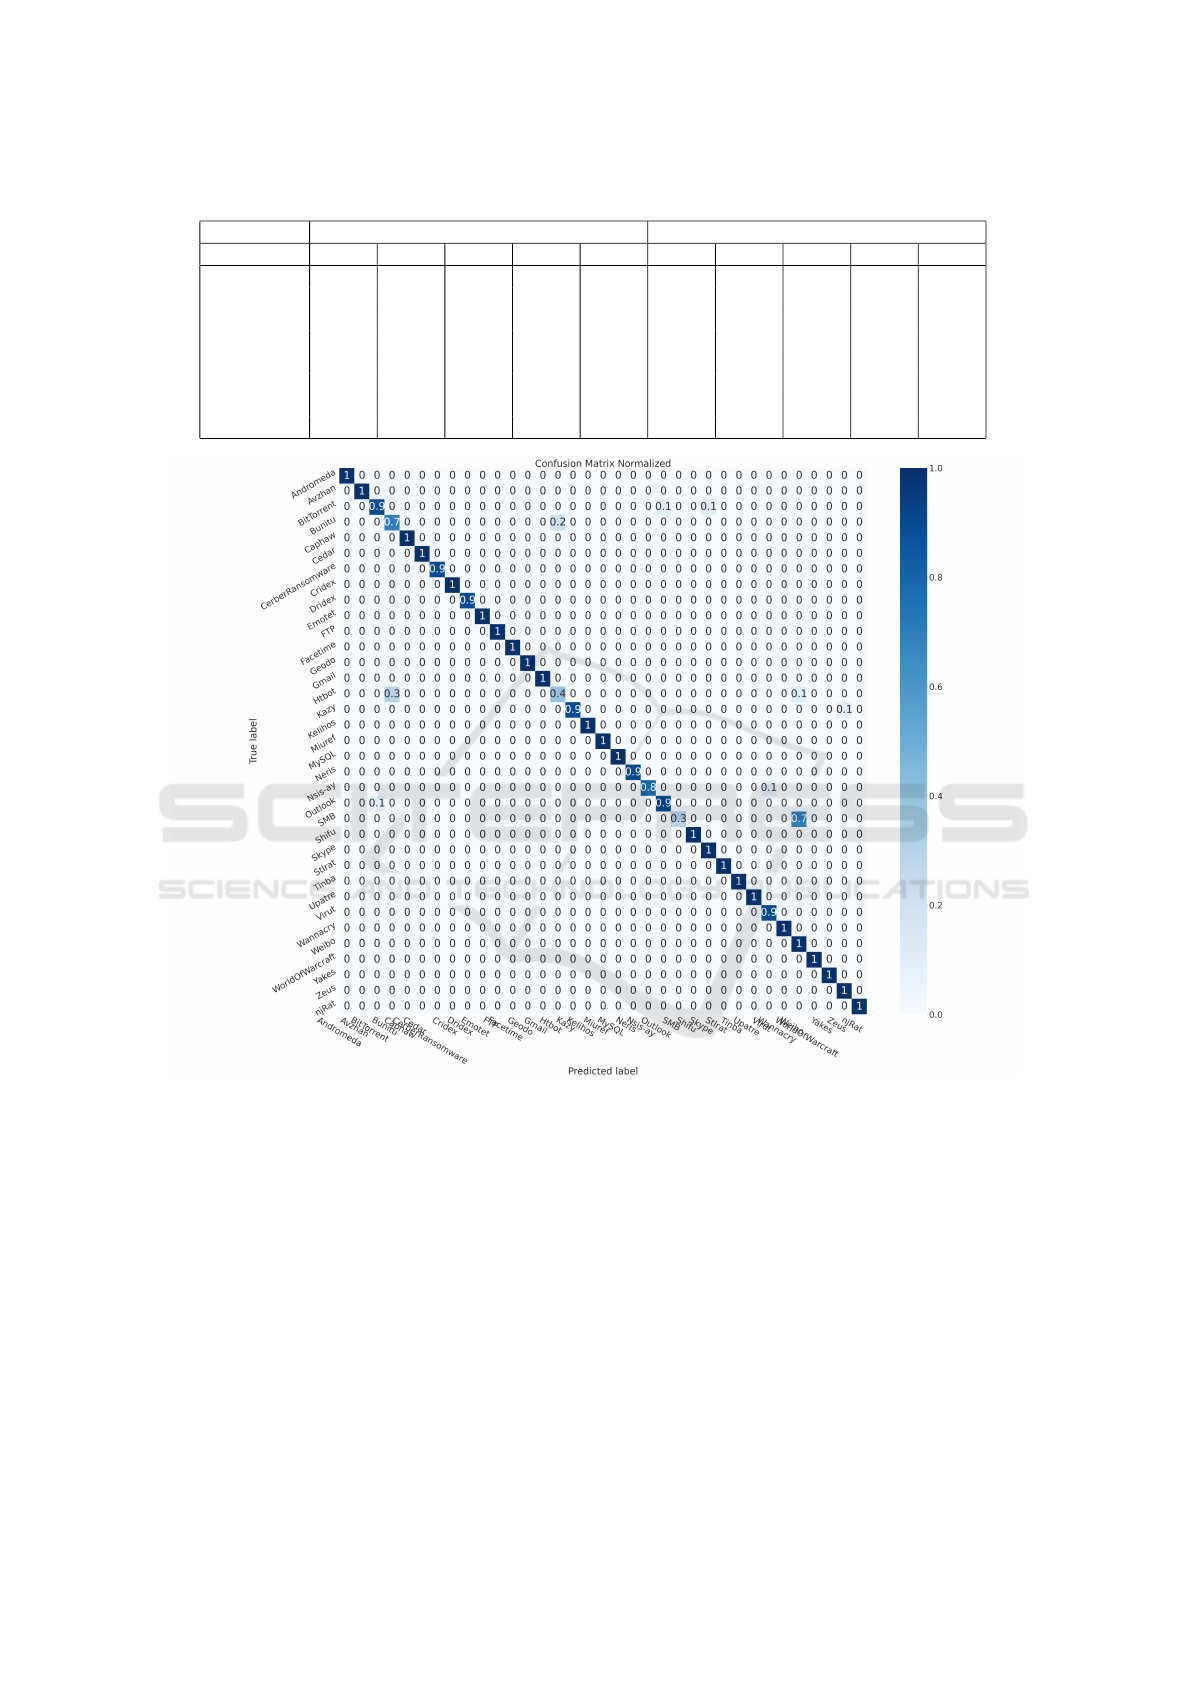
Table 5: Comparison between the results of different models on the test sets of Grayscale and RGB datasets.
Mode Gray RGB
Model Acc Prec Rec F1 Auc Acc Prec Rec F1 Auc
OurCNN 0.928 0.944 0.917 0.930 0.992 0.903 0.923 0.893 0.908 0.988
WangCNN 0.869 0.886 0.864 0.875 0.976 0.884 0.818 0.774 0.795 0.962
AlexNet 0.904 0.913 0.903 0.908 0.973 0.899 0.902 0.895 0.898 0.973
DenseNet 0.982 0.983 0.982 0.983 0.998 0.967 0.969 0.967 0.968 0.996
MobileNet 0.956 0.957 0.956 0.957 0.985 0.972 0.973 0.972 0.973 0.993
ResNet50 0.982 0.982 0.981 0.981 0.996 0.940 0.941 0.939 0.940 0.985
VGG16 0.978 0.738 0.452 0.561 0.941 0.976 0.952 0.230 0.371 0.747
VGG19 0.947 0.812 0.605 0.693 0.993 0.975 0.918 0.323 0.478 0.986
Figure 5: Plot of the confusion matrix normalized of the best-performing model (DenseNet) on the Grayscale dataset.
son between the model’s predictions and the actual
ground truth, highlighting areas of success and mis-
classification
In conclusion, DenseNet outperforms the other
models in terms of heatmap similarity, as evidenced
by its consistently high IF-SSIM values. MobileNet
and ResNet50 show competitive performance, while
OurCNN lags behind.
3.4.2 Discussion
In our method, we implemented a hybrid approach by
combining well-known models in the literature with
models designed by us. Furthermore, we provide ver-
satility in image generation by allowing the choice be-
tween RGB and grayscale images. Our method in-
volves evaluating several deep learning (DL) mod-
els on network traffic analysis using visualization
techniques such as Grad-CAM and comparing the
heatmaps generated using the Structural Similarity In-
dex (SSIM). To further improve the analysis, we em-
ployed metrics IM-SSIM and IF-SSIM, which mea-
sure the similarity between the heatmaps of different
DL models and of a single model respectively. These
metrics provide a more comprehensive analysis of the
DL models, particularly in the case of unknown target
patterns in the dataset samples.
SECRYPT 2023 - 20th International Conference on Security and Cryptography
392

4 CONCLUSION AND FUTURE
WORK
In this paper, we proposed an intrusion detection sys-
tem aimed to automatically discriminate between le-
gitimate and malicious network traces. In detail, we
propose to represent network traces in terms of im-
ages to input several deep-learning models to detect
the application that generated the specific network
trace. We take into account also prediction explain-
ability, by adopting the Grad-CAM, aimed to high-
light with the heatmap the areas of the image symp-
tomatic of a certain prediction. The deployment of
two versions of SSIM metric to measure heatmap sim-
ilarity. These metrics help assess the degree of resem-
blance between heatmaps, offering valuable insights
into the effectiveness of various approaches or tech-
niques. The limitations of the study include the use of
a limited dataset and the need for further evaluation of
the model’s robustness with additional algorithms for
heatmap generation. For this we plan as future work
to consider more algorithms for heatmap generation,
in order to evaluate the model’s robustness. More-
over, different activation maps will be considered and
we will explore the possibility to detect also malware
in the IoT environment with the proposed method.
ACKNOWLEDGEMENTS
This work has been partially supported by EU DUCA,
EU CyberSecPro, and EU E-CORRIDOR projects
and PNRR SERICS SPOKE1 DISE, RdS 2022-2024
cybersecurity.
This work has been carried out within the Ital-
ian National Doctorate on Artificial Intelligence run
by the Sapienza University of Rome in collaboration
with the Institute of Informatics and Telematics (IIT),
the National Research Council of Italy (CNR).
REFERENCES
Casolare, R., De Dominicis, C., Iadarola, G., Martinelli, F.,
Mercaldo, F., and Santone, A. (2021). Dynamic mo-
bile malware detection through system call-based im-
age representation. J. Wirel. Mob. Networks Ubiqui-
tous Comput. Dependable Appl., 12(1):44–63.
Dhote, Y., Agrawal, S., and Deen, A. J. (2015). A survey on
feature selection techniques for internet traffic classi-
fication. In 2015 International Conference on Com-
putational Intelligence and Communication Networks
(CICN), pages 1375–1380. IEEE.
Finsterbusch, M., Richter, C., Rocha, E., Muller, J.-A., and
Hanssgen, K. (2013). A survey of payload-based traf-
fic classification approaches. IEEE Communications
Surveys & Tutorials, 16(2):1135–1156.
Goel, R., Mehmood, I., and Ugail, H. (2021). A study of
deep learning-based face recognition models for sib-
ling identification. Sensors, 21(15):5068.
Iadarola, G., Mercaldo, F., Santone, A., and Martinelli, F.
(2022). Assessing deep learning prediction in image-
based malware detection with activation maps. In
Proceedings of the 27th European Symposium on Re-
search in Computer Security (ESORICS).
LeCun, Y., Jackel, L. D., Bottou, L., Cortes, C., Denker,
J. S., Drucker, H., Guyon, I., Muller, U. A., Sackinger,
E., Simard, P., et al. (1995). Learning algorithms
for classification: A comparison on handwritten digit
recognition. Neural networks: the statistical mechan-
ics perspective, 261(276):2.
Li, Z., Qin, Z., Huang, K., Yang, X., and Ye, S. (2017). In-
trusion detection using convolutional neural networks
for representation learning. In Neural Information
Processing: 24th International Conference, ICONIP
2017, Guangzhou, China, November 14–18, 2017,
Proceedings, Part V, pages 858–866. Springer.
Sara, U., Akter, M., and Uddin, M. S. (2019). Image qual-
ity assessment through fsim, ssim, mse and psnr—a
comparative study. Journal of Computer and Commu-
nications, 7(3):8–18.
Selvaraju, R. R., Das, A., Vedantam, R., Cogswell, M.,
Parikh, D., and Batra, D. (2016). Grad-cam: Why
did you say that? arXiv preprint arXiv:1611.07450.
Sharma, N., Jain, V., and Mishra, A. (2018). An analysis
of convolutional neural networks for image classifica-
tion. Procedia computer science, 132:377–384.
University, C. (2016). The stratosphere ips project
dataset. https://www.stratosphereips.org/category/
dataset.html.
Vinayakumar, R., Soman, K., and Poornachandran, P.
(2017). Applying convolutional neural network for
network intrusion detection. In 2017 International
Conference on Advances in Computing, Communica-
tions and Informatics (ICACCI), pages 1222–1228.
IEEE.
Wang, W., Zhu, M., Zeng, X., Ye, X., and Sheng, Y.
(2017). Malware traffic classification using convo-
lutional neural network for representation learning.
In 2017 International conference on information net-
working (ICOIN), pages 712–717. IEEE.
Wei Wang, D. L. (2016). Ustc-tfc2016. https://github.com/
yungshenglu/USTC-TFC2016.
A Method for Robust and Explainable Image-Based Network Traffic Classification with Deep Learning
393
