
Does Categorical Encoding Affect the Interpretability of a Multilayer
Perceptron for Breast Cancer Classification?
Hajar Hakkoum
1a
, Ali Idri
1,2 b
, Ibtissam Abnane
1c
and José Luis Fernades-Aleman
3d
1
ENSIAS, Mohammed V University in Rabat, Morocco
2
Mohammed VI Polytechnic University in Benguerir, Morocco
3
Department of Computer Science and Systems, University of Murcia, 30100 Murcia, Spain
Keywords: Interpretability, Machine Learning, Breast Cancer, SHAP, Global Surrogate, Categorical Encoding.
Abstract: The lack of transparency in machine learning black-box models continues to be an impediment to their
adoption in critical domains such as medicine, in which human lives are involved. Historical medical datasets
often contain categorical attributes that are used to represent the categories or progression levels of a
parameter or disease. The literature has shown that the manner in which these categorical attributes are
handled in the preprocessing phase can affect accuracy, but little attention has been paid to interpretability.
The objective of this study was to empirically evaluate a simple multilayer perceptron network when trained
to diagnose breast cancer with ordinal and one-hot categorical encoding, and interpreted using a decision tree
global surrogate and the Shapley Additive exPlanations (SHAP). The results obtained on the basis of
Spearman fidelity show the poor performance of MLP with both encodings, but a slight preference for one-
hot. Further evaluations are required with more datasets and categorical encodings to analyse their impact on
model interpretability.
1 INTRODUCTION
The use of machine learning (ML) models in
medicine has been a popular option for some time
(Kadi et al. 2017; Hosni et al. 2019; Idri and El Idrissi
2020; Zerouaoui et al. 2020). ML predictions serve as
a second opinion that can reduce human errors
(London 2019). Nonetheless, some ML models still
struggle to demonstrate their worth owing to their
obscurity (Hakkoum et al. 2022). These ML models
are also known as black-box or opaque models
(e.g. Artificial Neural Networks (ANNs)). While they
outperform transparent models (e.g., decision trees
(DTs)) in terms of performance, their lack of
interpretability is holding them back in critical fields,
such as healthcare (Hakkoum et al. 2021b).
Interpretability is the extent to which a human can
predict a model's outcome or understand the
reasoning behind its decisions (Kim et al. 2016;
Miller 2019). The term is frequently used
a
https://orcid.org/0000-0002-2881-2196
b
https://orcid.org/0000-0002-4586-4158
c
https://orcid.org/0000-0001-5248-5757
d
https://orcid.org/0000-0002-0176-450X
interchangeably with explainability, which is more
specific to a model by explaining its internals,
whereas providing mappings between the input and
output of a model without knowing its internals is
sufficient to achieve interpretability. Two criteria
distinguish interpretability techniques: 1) whether
they explain the black-box model behaviour globally
or locally (single instance), and 2) whether they are
agnostic or specific to one type of black-box model.
A systematic literature review (SLR) (Hakkoum
et al. 2021a) of 179 articles investigating
interpretability in medicine revealed that 95 (53%)
and 72 (40%) articles focused solely on global or
local interpretability, respectively, and 10 articles
(6%) proposed and/or evaluated both global and local
interpretability techniques. Additionally, most of the
data types that the selected studies worked on were
numerical (46%, 111 papers) and categorical (24%,
59 papers). The categorical features used are often
encoded using ordinal or label categorical encoding
Hakkoum, H., Idri, A., Abnane, I. and Fernades-Aleman, J.
Does Categorical Encoding Affect the Interpretability of a Multilayer Perceptron for Breast Cancer Classification?.
DOI: 10.5220/0012084800003541
In Proceedings of the 12th International Conference on Data Science, Technology and Applications (DATA 2023), pages 351-358
ISBN: 978-989-758-664-4; ISSN: 2184-285X
Copyright
c
2023 by SCITEPRESS – Science and Technology Publications, Lda. Under CC license (CC BY-NC-ND 4.0)
351

(CE) which maps the numerical values to an integer
to represent every category. Label CE can disregard
any order a feature might have like the degree of
malignancy in a cancer prognosis dataset. This can
have a negative impact on the relevance of the feature,
and therefore, on the performance of the model.
Therefore, ordinal CE is often used.
There is no doubt that data pre-processing (DP)
methods (Benhar et al. 2020), such as CE, have a
significant impact on model accuracy. According to
(Crone et al. 2006), the influence of DP is widely
overlooked, as shown in their SLR on studies
investigating data mining applications for direct
management. This SLR particularly showed that only
one publication discussed the treatment and use of
CE, despite the fact that categorical variables were
used and documented in 71% of all studies and are
commonly encountered in the application and ML
domains in general. The aforementioned authors
investigated the impact of different DP techniques
that included CE with four encoding schemes: one-
hot, ordinal, dummy, and thermometer encoding.
Tests performed on DT and a multilayer perceptron
(MLP) proved that CE can have a significant
influence on model performance.
Motivated by these findings showing the impact
of DP methods on accuracy and the lack of studies on
this effect on interpretability (Hakkoum et al. 2021a),
we investigated how interpretability techniques are
affected. Therefore, this study compares two well-
known interpretability techniques, global surrogates
using DT and Shapley Additive exPlanations (SHAP)
(Lundberg and Lee 2017), when used with an MLP
trained for breast cancer (BC) prognosis (Dua and
Graff 2017). Following the application of two
different CE, namely ordinal and hot, the MLP was
optimised using the particle swarm optimisation
algorithm (PSO) to ensure maximum accuracy. The
performance of the MLP with different CEs was first
compared using the Wilcoxon statistical test and
Borda count voting systems, after which the same
comparison was performed at the global and local
interpretability levels.
The key contributions of this study are the
identification of the impact of CEs on accuracy and
interpretability as well as the quantitative evaluation
of SHAP. In this respect, the research questions
(RQs) listed below will be addressed:
RQ1: What is the overall performance of MLP?
Which CE is the best?
RQ2: What is the overall global interpretability of
MLP? Which CE is the best?
RQ3: What is the overall local interpretability of
MLP? Which CE is the best?
The remainder of this paper is organised as
follows: Section 2 provides an overview of the chosen
black-box (MLP) as well as the interpretability
techniques (global surrogate and SHAP) used in this
study. Section 3 describes the BC dataset as well as
the performance metrics and statistical tests used to
identify the best-performing CEs. The experimental
design used in the empirical evaluation is detailed in
Section 4. Section 5 presents and discusses the
findings. Section 6 discusses the threats to the validity
of the study, and Section 7 reports the findings and
future directions.
2 METHODS
This section defines the models and methods
employed in this empirical evaluation, namely: CEs,
MLP, PSO, and the global and local interpretability
techniques.
2.1 Categorical Encodings (CEs)
Data transformation tasks are additional DP
procedures that help ML models to perform better. In
this step, the data were transformed into appropriate
forms for the mining process, resulting in more
efficient results or more understandable patterns
(Esfandiari et al. 2014). CE is a common data-
transformation method. This is the process of
converting categorical data into an integer format,
thus enabling it to be used by various ML models,
which are primarily mathematical operations that rely
entirely on numbers.
Ordinal CE is the most basic strategy for
categorical features in which observed levels from the
training set are mapped onto integers 1 to N (number
of categories) with respect to their original order. In
contrast, the indicator CE regroups one-hot and
dummy CEs. One-hot encoding refers to transforming
the categorical feature into N binary indicator
columns, in which the active category is represented
by 1. Meanwhile, dummy encoding results in only N-
1 indicator columns, and a reference feature level is
chosen, which is encoded with 0 in all indicator
columns.
2.2 Neural Networks
Black-box models are widely used in many domains
owing to their excellent performance. Their ability to
map nonlinear relationships and discover patterns in
databases that slip from white-box models has put
them in the spotlight.
DATA 2023 - 12th International Conference on Data Science, Technology and Applications
352

Neural networks are one of the most famous
black-box models. They take the topology of human
brain and can be used for classification tasks. Their
basic architecture is called MLP which is composed
of three layers of neurones. The first layer
corresponds to the input, that is, the data points. The
third and last layer is the final prediction which is
usually composed of one or two neurones for binary
classification. Each layer is connected to the others by
means of weights which are updated using a
backpropagation technique. When training an MLP,
it is important to select the hyperparameters which
determine its performance. These hyperparameters
include the number of hidden neurones and batch size
(number of data points to work through before
updating the internal model parameters), number of
epochs (number of times that the MLP will work
through the entire training dataset), and learning rate
which controls how quickly the model is adapted to
the problem.
2.3 Model Optimization
PSO is a good technique for hyperparameter
optimisation to achieve the best performance, because
it can be a hurdle to choose them manually for such
powerful black-box models. It is inspired by birds
whose discoveries can be shared with the flock that is
attempting to find the optimal solution, which is often
close to the global optimal (Brownlee 2021).
2.4 Global and Local Interpretability
There are two types of interpretability techniques:
global which examines general behaviour, and local
which focuses on a particular data point. This
evaluation study analyses the impact of CEs when
using two different interpretability techniques: global
surrogate using DT, and SHAP which can be used
globally employing features importance or locally, as
occurs in this study, by employing local surrogates.
Global surrogates are the simplest way to interpret
black-boxes. This is done by training an interpretable
model, such as DT, with black-box predictions rather
than the true labels of data points to gain insight into
the workings of the black-box workings. Nonetheless,
this global surrogate model draws conclusions based
on a black-box rather than actual data.
SHAP is based on the Shapley values game theory
technique (Shapley 1953), a method from coalitional
game theory which fairly distribute the “payout”,
which in this case is the prediction among the players
which are the features. SHAP was inspired by local
surrogates and explains predictions by assuming that
each feature value of the instance is a player in a
game, and attempts to compute the contribution of
each feature to the prediction. One innovation that
SHAP brings to the table is that the Shapley value
explanation is represented as an additive feature
attribution method, that is, a linear model. This view
connects local surrogate implementation and Shapley
values.
3 DATASET AND METRICS
This section presents the categorical BC dataset used
in this study, as well as the metrics used to evaluate
performance and interpretability, along with the
cross-validation used. Finally, the Borda count voting
system and statistical test used to define the best-
performing configuration are presented.
3.1 Dataset Description
Table 1 presents the BC categorical dataset features
available online in the UCI repository (Dua and Graff
2017). It has 9 attributes and a very low number of
instances (286) with 201 instances for no recurrence
of BC and 85 for its recurrence. This class imbalance
was addressed using the synthetic minority over-
sampling technique (SMOTE), as explained in
Section 4.
Table 1: BC features description.
Attribute Possible values
Age [’20-29’, ’30-39’, ’40-49’, ’50-59’,
’60-69’, ’70-79’]
Meno
p
ause [’
g
e40’, ’lt40’, ’
p
remeno’]
Tumor size [’0-4’, ’10-14’, ’15-19’, ’20-24’, ’25-
29’, ’30-34’, ’35-39’, ’40-44’, ’45-49’,
’5-9’, ’50-54’]
Inv nodes [’0-2’, ’12-14’, ’15-17’, ’24-26’, ’3-5’,
’6-8’, ’9-11’]
Node Ca
p
s [’no’, ’
y
es’]
Deg of
Mali
g
.
[1, 2, 3]
Breast [’left’, ’ri
g
ht’]
Breast Quad [’central’, ’left low’, ’left up’, ’right
low’, ’right up’]
Irradiat [’no’, ’
y
es’]
Class
[‘no-recurrence-events’ (201),
‘recurrence-events’ (85)]
3.2 Evaluation Metrics
This subsection presents the metrics and tests used to
assess the performance and interpretability.
Does Categorical Encoding Affect the Interpretability of a Multilayer Perceptron for Breast Cancer Classification?
353
3.2.1 Model Performance Metrics
The known accuracy, F1-score, Area Under Curve
(AUC), and Spearman correlation metrics were used
to evaluate and compare the constructed black-box
models. These are defined as follows:
Accuracy: the ratio of correctly predicted
observations to total observations. Along
with the error of the model, they sum up to
1.
Precision: the ratio of true positive
observations to the total predicted positive
observations.
Recall (Sensitivity/True Positive Rate): the
ratio of true positive observations to all
observations in actual class 1).
F1-Score: the weighted average of Precision
and Recall.
AUC: reflects how good the ROC is, a chart
that visualises the trade-off between TP rate
and FP rate; the more top-left the curve, the
higher the area and hence the higher the
AUC score (Czakon 2021).
Spearman: the differences between ranks of
the true and predicted values are calculated
to measure the disordering of the
predictions with respect to the truth, as
shown in Equation 2.2. It takes a real value
in the range 1 ≤ ρ ≤ 1 with 1 indicates that
the function between prediction and truth is
monotonically increasing while -1 indicates
a monotonically decreasing function
(Stojiljković 2021). It is given in Equation
(1), where n is the total number of points in
each set and 𝑟
𝑋
𝑌
. Xir and Yir
are the ranks of the i
th
value of X and Y that
represents the sets to compare.
𝜌1
∑
²
(1)
3.2.2 Model Interpretability Metrics
To assess how well the global/local surrogate
techniques reflected the behaviour of the black-box
models, the fidelity of each surrogate technique was
computed using Spearman. Unlike the Spearman
metric calculated in the previous Subsection 3.2.1
“Model performance metrics”, fidelity using
Spearman (Equation 1) compares the predicted labels
by the surrogate against the predicted labels by the
black-box model. Consequently, fidelity does not
represent the surrogate’s performance on real data but
rather on the black-box’s predictions.
For global surrogates with DTs, the
comprehensibility of the DTs was assessed based on
the depth of the tree and number of leaves. For local
surrogates, the Mean Squared Error (MSE) was used
to measure the average of the error squares or the
average squared difference between the probability of
the predicted class by the local surrogate and that of
the MLP model.
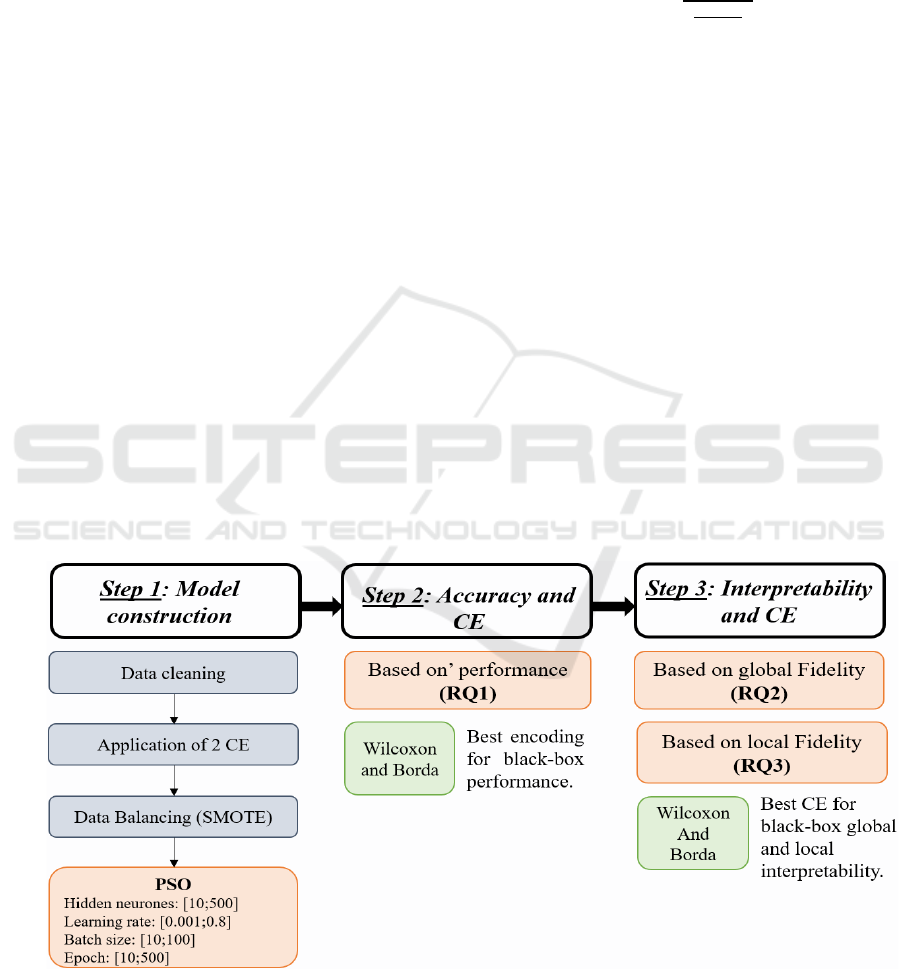
Figure 1: Experimental design.
DATA 2023 - 12th International Conference on Data Science, Technology and Applications
354

3.2.3 Validation and Statistical Testing
For validation, comparison, and testing purposes, the
present empirical evaluation uses different methods
to assess the conducted experiments.
K-folds Cross Validation was used to ensures that
the model is low on bias and to have an idea about
how it will behave/generalise over new/unseen data.
It allows better use of data and provides a robust
estimate of how well the model will perform on
unseen data. As a general rule and empirical
evidence, K = 5 or 10 is generally preferred.
Borda Count is a voting method that was used to
select the best performing CE by ranking them
according to different performance and
interpretability metrics (Borda 1784).
Wilcoxon test was used to determine whether the
two CEs were statistically different. This produces a
p-value that can be used to interpret the test results.
This can be defined as the likelihood of observing the
performance of the two CEs under the underlying
assumption that they were drawn from the same
population with the same distribution. The threshold
used in this study was set to 5%. Consequently, if the
p-value was less than 5%, the assumption of ordinal
and one-hot CEs values from the same distribution
was rejected.
4 EXPERIMENTAL DESIGN
The experimental design of this evaluation is
presented in this section, as shown in Figure 1: 1)
Model construction and evaluation, and 2) Accuracy
and CEs, in which we study the impact of the latter
on black-box performance. 3) Interpretability and
CEs, where we study the impact of the latter on global
and local interpretability techniques using the fidelity
metric.
4.1 Step 1: Model Construction and
Evaluation
The dataset was first cleaned by removing missing
values. CEs were applied to obtain two new encoded
datasets. The encoders were trained on the training-
validation set which represented 80% of the data, and
then applied to the test set (20%). The training-
validation set was balanced using the SMOTE
algorithm (Chawla et al. 2002) on which
hyperparameters were optimized using PSO
according to accuracy. The performance metrics of
the MLP models were computed using the test set.
4.2 Step 2: Accuracy and CE
After hyperparameter optimisation and model
construction, Wilcoxon and Borda count were used to
compare the two MLP models according to their
performance.
4.3 Step 3: Interpretability and CE
Similarly, this step studies the impact of the two CEs
on interpretability instead of performance. Wilcoxon
and Borda count were used to compare both models
according to their global interpretability as well as
local interpretability.
5 RESULTS AND DISCUSSION
This section presents and discusses the findings of the
empirical evaluation conducted in this study to
answer the RQs listed in Section 1. The experiments
were performed on a Lenovo Legion laptop with a
hexa-core Intel Core i7-9750H processor and 16GB
of RAM. Python libraries were used for all
experiments.
5.1 Best CE for MLP Performance
After cleaning the dataset, it was split into training,
validation, and testing, and CEs were performed. The
split resulted in 159 cases with no recurrence of BC
and 63 cases with recurrence of BC. As the
distribution of the classes for the training-validation
set is imbalanced, the SMOTE algorithm was used to
avoid biased accuracy results. The SMOTE
application resulted in 159 data points for every class
in the training-validation set.
The MLP hyperparameters were optimised using
PSO. Table 2 shows the optimal hyperparameters
chosen by the PSO on the basis of accuracy with a 10-
fold cross validation using only the training-
validation set. Table 3 presents the MLP performance
results based on the optimised hyperparameters using
the test set.
As shown in Table 2, both MLP models required
the same number of hidden neurones (373) and a
slightly different batch size (79 and 91 for ordinal and
one-hot, respectively). Nevertheless, the MLP trained
with the ordinal dataset required a higher learning rate
and more than triple the number of epochs needed by
the one-hot dataset. Therefore, the use of the one-hot
dataset can reduce the computation time for the MLP.
Table 3 lists the results of model performance.
Based on accuracy and AUC, MLP trained with the
Does Categorical Encoding Affect the Interpretability of a Multilayer Perceptron for Breast Cancer Classification?
355

one-hot dataset performed slightly better. Meanwhile,
the F1-score and Spearman correlation moderately
favoured the ordinally encoded dataset. Wilcoxon
based on the Spearman correlation reveals that the
differences between ordinal and one-hot are not
significant, while the Borda count considers the two
configurations even.
Nevertheless, it is important to mention the very
low performance of MLP on both CE. Although the
small size of the dataset might be a reason, it might
also be the fact that MLP does not perform well on
categorical datasets. To this extent, little research has
been conducted to check the performance of ANNs,
particularly MLPs, on categorical BC prognosis
datasets. Fitkov-Norris et al. (Fitkov-Norris et al.
2012) evaluated the impact of different CEs,
including ordinal and one-hot, on the performance of
ANNs. They trained an MLP with a single hidden
layer and another with two hidden layers. Results
showed that for categorical datasets, ANNs as well as
standard statistical models such as logistic regression
give similar performances, if not worse.
Table 2: PSO optimized hyperparameters.
CE Number
of
neurones
[10;500]
Learning
rate
[0.001;0.8]
Batch
size
[10;100]
Epochs
[10;500]
Ordinal 373 0.023 79 410
One-
ho
t
373 0.012 91 182
Table 3: MLP performance results for different CEs.
CE
Accuracy F1-
score
AUC Spearman
Ordinal 0.6 0.476 0.398 0.167
One-hot 0.618 0.399 0.404 0.120
5.2 Best CE for MLP Global
Interpretability
In this step, we compare and rank the CEs according
to the global surrogate performance using Spearman
fidelity, depth of the tree, and the number of its leaves
which are presented in Table 4 along with Borda
count decisions. The first glance shows a higher
performance of one-hot CE for the Spearman fidelity
(0.285 and 0.524 for ordinal and one-hot,
respectively), as well as the DT depth (15 and 12 for
ordinal and one-hot, respectively), while the number
of leaves was lower for the MLP trained with the
ordinal encoded dataset (67 and 77 for ordinal and
one-hot, respectively).
The Wilcoxon test yielded a p-value equal to
100% which indicates that the CEs were not
significantly different according to their fidelities.
Meanwhile, Borda count considered one-hot to be
better since it outperformed in terms of fidelity and
tree depth.
Table 4: Global surrogate performance results for different
CEs.
CE Spearman
fidelity
Depth Leaves Borda
count
winne
r
Ordinal 0.285 15 67 One-
hot
One-
hot
0.524 12 77
5.3 Best CE for MLP Local
Interpretability
In this phase, we determined the best CE using the
SHAP local interpretability technique to answer RQ3.
Table 5 reports the Spearman fidelity and MSE of
SHAP.
Both models did not perform well since the
Spearman are negative which assumes a slight
inclination towards negative correlation although
one-hot Spearman fidelity was very close to 0.
Meanwhile, ordinal was slightly preferred according
to MSE (0.041 and 0.090 for ordinal and one-hot
respectively). Wilcoxon reported a very high p-value
equal to 100%, implying that the SHAP fidelities to
MLP as well as the MSE for both CE were not
significantly different.
Table 5: SHAP performance results for different CEs.
Encoding
Spearman
fidelity
MSE
Ordinal -0.330 0.041
One-hot -0.146 0.090
6 LIMITATIONS
To ensure the validity of the current study, it is
necessary to highlight its possible limitations. We
think the main threats to validity are: 1) the extremely
small size of the dataset (286 instances), along with
2) the very poor performance of the MLPs as regards
categorical data. However, we believe that MLPs
generally lose their capabilities when dealing with
categorical features and are therefore a bad fit for
categorical data (Fitkov-Norris et al. 2012).
DATA 2023 - 12th International Conference on Data Science, Technology and Applications
356

Overall, using more CEs, as well as more datasets
and models, can enrich comparisons and conclusions.
However, we believe that the small evaluation
presented in this study shows the importance of
addressing two problems of black-box models:
interpretability and categorical encoding.
7 CONCLUSION AND FUTURE
WORK
Two interpretability techniques (global surrogate and
SHAP) were empirically evaluated in this study. The
primary goal was to identify the influence of ordinal
and one-hot CE on interpretability techniques using
MLP trained for BC prognosis and compare it to the
influence on accuracy.
The main highlight of this evaluation is the
difficulty in applying ANNs to categorical data with
respect to choosing the optimal CE. Nevertheless,
performance and interpretability on both encodings
were very poor, with a slight preference for one-hot
CE which was seen in global interpretability.
Ongoing work is comparing the effect of more
CEs on the accuracy and interpretability of ML black-
box models trained on multiple datasets.
ACKNOWLEDGMENT
This work was conducted under the research project
“Machine Learning based Breast Cancer Diagnosis
and Treatment”, 2020-2023. The authors would like
to thank the Moroccan Ministry of Higher Education
and Scientific Research, Digital Development
Agency (ADD), CNRST, and UM6P for their
support.
REFERENCES
Benhar H, Idri A, L Fernández-Alemán J (2020) Data
preprocessing for heart disease classification: A
systematic literature review. Comput Methods
Programs Biomed 195:. https://doi.org/10.1016/
J.CMPB.2020.105635
Borda JC (1784) Memoire sur les elections au scrutin,
Histoire de l’Academie royale des sciences pour 1781.
Paris (English Transl by Grazia, A 1953 Isis 44)
Brownlee J (2021) A Gentle Introduction to Particle Swarm
Optimization. https://machinelearningmastery.com/a-
gentle-introduction-to-particle-swarm-optimization/.
Accessed 21 Oct 2021
Chawla N V., Bowyer KW, Hall LO, Kegelmeyer WP
(2002) SMOTE: Synthetic minority over-sampling
technique. J Artif Intell Res 16:321–357. https://doi.
org/10.1613/JAIR.953
Crone SF, Lessmann S, Stahlbock R (2006) The impact of
preprocessing on data mining: An evaluation of
classifier sensitivity in direct marketing. Eur J Oper Res
173:781–800. https://doi.org/10.1016/J.EJOR.2005.07.
023
Czakon J (2021) F1 Score vs ROC AUC vs Accuracy vs PR
AUC: Which Evaluation Metric Should You Choose? -
neptune.ai. https://neptune.ai/blog/f1-score-accuracy-
roc-auc-pr-auc. Accessed 28 Nov 2021
Dua D, Graff C (2017) UCI Machine Learning Repository
Esfandiari N, Babavalian MR, Moghadam AME, Tabar VK
(2014) Knowledge discovery in medicine: Current
issue and future trend. Expert Syst Appl 41:4434–4463.
https://doi.org/10.1016/J.ESWA.2014.01.011
Fitkov-Norris E, Vahid S, Hand C (2012) Evaluating the
Impact of Categorical Data Encoding and Scaling on
Neural Network Classification Performance: The Case
of Repeat Consumption of Identical Cultural Goods. In:
Communications in Computer and Information
Science. pp 343–352
Hakkoum H, Abnane I, Idri A (2022) Evaluating
Interpretability of Multilayer Perceptron and Support
Vector Machines for Breast Cancer Classification. 2022
IEEE/ACS 19th Int Conf Comput Syst Appl 2022-
December:1–6. https://doi.org/10.1109/AICCSA56
895.2022.10017521
Hakkoum H, Abnane I, Idri A (2021a) Interpretability in the
medical field: A systematic mapping and review study.
Appl Soft Comput 108391. https://doi.org/10.1016/
J.ASOC.2021.108391
Hakkoum H, Idri A, Abnane I (2021b) Assessing and
Comparing Interpretability Techniques for Artificial
Neural Networks Breast Cancer Classification. Comput
Methods Biomech Biomed Eng Imaging Vis 9:.
https://doi.org/10.1080/21681163.2021.1901784
Hosni M, Abnane I, Idri A, et al (2019) Reviewing
ensemble classification methods in breast cancer.
Comput. Methods Programs Biomed. 177:89–112
Idri A, El Idrissi T (2020) Deep learning for blood glucose
prediction: Cnn vs lstm. Gervasi O al Comput Sci Its
Appl ICCSA 12250:379–393
Kadi I, Idri A, Fernandez-Aleman JL (2017) Knowledge
discovery in cardiology: A systematic literature review.
Int. J. Med. Inform. 97:12–32
Kim B, Khanna R, Koyejo O (2016) Examples are not
Enough, Learn to Criticize! Criticism for
Interpretability
London AJ (2019) Artificial Intelligence and Black-Box
Medical Decisions: Accuracy versus Explainability.
Wiley Online Libr 49:15–21. https://doi.org/10.
1002/hast.973
Lundberg SM, Lee S-I (2017) A unified approach to
interpreting model predictions. In: NIPS’17:
Proceedings of the 31st International Conference on
Neural Information Processing Systems. Long Beach,
Does Categorical Encoding Affect the Interpretability of a Multilayer Perceptron for Breast Cancer Classification?
357

California, USA. Curran Associates Inc., Red Hook,
NY, USA, pp 4768–4777
Miller T (2019) Explanation in Artificial Intelligence:
Insights from the Social Sciences. Artif Intell 267:1–38
Shapley LS (1953) A Value for n-Person Games. Contrib
to Theory Games 2:307–318. https://doi.org/10.1515/
9781400881970-018/HTML
Stojiljković M (2021) Correlation With Python.
https://realpython.com/numpy-scipy-pandas-
correlation-python/#spearman-correlation-coefficient.
Accessed 28 Nov 2021
Zerouaoui H, Idri A, Elasnaoui. K (2020) Machine learning
and image processing for breast cancer: A systematic
map. Trends Innov Inf Syst Technol 5:44–53.
DATA 2023 - 12th International Conference on Data Science, Technology and Applications
358
