
Towards a Geometric Deep Learning-Based Cyber Security: Network
System Intrusion Detection Using Graph Neural Networks
Rocco Zaccagnino
1
, Antonio Cirillo
1
, Alfonso Guarino
2
, Nicola Lettieri
3
, Delfina Malandrino
1
and Gianluca Zaccagnino
4
1
Department of Computer Science, University of Salerno, Via Giovanni Paolo II, 84084, Fisciano (SA), Italy
2
Department of Law, Economics, Management and Quantitative Methods, University of Sannio,
Via delle Puglie 82, 82100, Benevento (BN), Italy
3
National Institute for Public Policy Analysis (INAPP), Corso d’Italia 33, 00198, Rome, Italy
4
TopNetwork, Via Simone Martini, 143 00142, Rome, Italy
gianluca.zaccagnino@top-network.it
Keywords:
Network Traffic Intrusion Detection, Behavior Modeling, Geometric Deep Learning, Graph Neural Network.
Abstract:
Networks play a key role in modern society and are therefore the target of many threats aimed at perform-
ing malicious activities. In recent years, the so-called behavioral anomaly detection is becoming a de facto
standard paradigm for different cyber security scenarios, such as network system intrusion detection. This
paradigm relies on the idea to detect behavioral patterns that do not match the normal activity. To build more
effective behavioral models, researchers are putting efforts on the use of behavioral events’ data in advanced
machine learning methods, such as Convolutional and Recurrent Neural Networks. Recently, the fledging
Geometric Deep Learning research area has proposed Graph Neural Networks (GNNs), which are particularly
suitable to model the data connections and interactions as entities and relationships of a graph. To exploit
the benefits of using such models in network system intrusion detection, we propose a novel graph-based
behavioral modeling approach using GNNs. Preliminary experiments have been carried out to measure the ef-
fectiveness of our approach on the UNSW-NB15 dataset. The results obtained show that our proposal reaches
performances comparable, and in some cases, better than some state-of-the-art approach.
1 INTRODUCTION
Emerging technologies such as mobile Internet, IoT,
and Cloud Computing, have contributed to create a
complex and ever-changing cyberspace where tradi-
tional computer security theory and systems become
ineffective in some cases (Guarino et al., 2021; Guar-
ino et al., 2022; Gaurav et al., 2022). Among these,
the security of networks is an utmost concern to indi-
viduals and organizations. Data on networks should
flow securely between the communicating devices.
Nowadays, intrusion detection systems are nec-
essary to protect networks from ever-evolving mali-
cious cyber-attacks. Such systems must be able to
analyze the massive amount of behavioral data gen-
erated within the networks (Sun et al., 2019) and so
to tackle the network system intrusion detection prob-
lem: understanding whether a network traffic flow is
an “anomaly”, i.e., a cyber-attack, or “normal”.
In recent years, the behavioral anomaly detection
by behavior modeling has attracted the researchers’
attention for its feasibility of dealing with different
cyber-security issues such as network system intru-
sion detection (Mazzawi et al., 2017). Its basic idea is
detecting behaviors that do not match the regular be-
havior pattern. However, the behavioral data related
to networks’ activities are usually high-dimensional
and of limited quality, sparse and fragmented due to
factors such as acquisition technologies and privacy
protections (Jing et al., 2019; Jiang et al., 2020).
Effective behavioral models have been obtained
by providing Machine learning (ML) and Deep learn-
ing (DL) methods with information about behavioral
connected events (Zhu et al., 2020; Wang et al.,
2020). Among these methods, we find the Geomet-
ric DL research, focused on modelling and learning
data connections and interactions as entities and rela-
tionships of a graph, through special models named
Graph Neural Networks (GNNs).
Despite the high performance demonstrated by
394
Zaccagnino, R., Cirillo, A., Guarino, A., Lettieri, N., Malandrino, D. and Zaccagnino, G.
Towards a Geometric Deep Learning-Based Cyber Security: Network System Intrusion Detection Using Graph Neural Networks.
DOI: 10.5220/0012085700003555
In Proceedings of the 20th International Conference on Security and Cryptography (SECRYPT 2023), pages 394-401
ISBN: 978-989-758-666-8; ISSN: 2184-7711
Copyright
c
2023 by SCITEPRESS – Science and Technology Publications, Lda. Under CC license (CC BY-NC-ND 4.0)

GNNs in numerous fields, a few attempts to use them
to address the network intrusion detection problem
have been presented so far. This is probably because
using GNNs requires non-trivial graph-based mod-
elling of the data samples. In our specific case, the
choice of how to represent individual network traf-
fic samples could easily lead to a poorly scalable or
ineffective solutions (Wang and Zhu, 2022), espe-
cially when applied on datasets built and tailored for
the network intrusion detection problem, such as the
UNSW-NB15 dataset (Moustafa and Slay, 2015)
1
.
In this paper, we propose a novel geometric
learning-based behavioral approach for network sys-
tem intrusion detection. The main contributions are:
• A model to represent a set of network traffic sam-
ples using a graph-based structure, where (i) each
node contains the features of a network traffic
sample, and (ii) each edge connects two nodes
sharing protocol, the state and the service.
• A GNN to learn the structure of the graph de-
scribed above; the problem of classifying a sam-
ple as “anomaly” or “normal” becomes the prob-
lem of classifying the type of node.
• Preliminary experiments to assess the effective-
ness of our approach on the UNSW-NB15 dataset
both for the binary (anomaly or normal) and the
multi-class (type of attack or normal) classifica-
tion problem; results show performance in some
cases better than some state-of-the-art approach.
All the source code and the datasets used for our
experiments are available online
2
.
2 RELATED WORK
DNN-Based Network Intrusion Detection. To
date, the research on the use of DNNs for network
system intrusion detection is plenty of proposals.
(Tang et al., 2016) implemented a DL algorithm
for flow-based network intrusion detection and eval-
uated the performance on KDDCUP99 (Tavallaee et al.,
2009) and NSL-KDD
3
. The flow notion is used to iden-
tify the network traffic. The accuracy of 75.75% is not
good enough to be adopted in commercial products.
(Li et al., 2017) proposed an intrusion detection
model using Convolutional Neural Networks (CNNs)
on a visual network representation. Experiments were
1
Created to generate a comprehensive overview of the
modern normal and attack behaviors in network systems.
2
https://github.com/musimathicslab/
network-intrusion-detection-gnn
3
https://www.unb.ca/cic/datasets/nsl.html
conducted on the NSL-KDD dataset, using GoogLeNet
(f-score 90.01%) and ResNet-50 (f-score 89.85%).
(Vinayakumar et al., 2017) employed CNN mod-
els combining long short-term memory units, re-
current neural networks, and gated recurrent units.
Binary classification (resp. multi-classification) on
KDDCup99, showed accuracy 99% (resp. 98.7%).
(Potluri and Diedrich, 2017) focused on the ef-
ficient feature extraction from the NSL-KDD dataset
for attack multi-class classification. A DNN-based
Stacked Auto-Encoder was employed, and experi-
mental results showed that the proposal was able to
reduce the number of features used for the detection
of a limited number of attack classes.
(Kwon et al., 2018) studied how the structural
depths of CNNs impact their performance when used
for the network anomaly detection problem. Results
of experiments on NSL-KDD, Kyoto Honeypot (Song
et al., 2006), and MAWILab (Callegari et al., 2016),
showed that adding more layers to a CNN does not
improve the accuracy that is always lower than 80%.
(Hooshmand and Hosahalli, 2022) introduced
a network anomaly detection using the 1-D CNN
architecture and incorporated the SMOTE over-
sampling method to solve the class-imbalance issue
on UNSW-NB15. As for the multi-classification on
all the protocol categories, the performance achieved
weighted accuracy of 0.763, while as for class-wise
multi-classification (for each independent protocol
category), the accuracy ranged from 0.99 for the class
generic to 0.12 for the class backdoor.
GNN-Based Network Intrusion Detection. Un-
like DNN-based solutions, a few GNN-based network
intrusion detection systems have been proposed so far.
(Zheng et al., 2019) introduced a dynamic graph-
based anomaly detection. Each node represents a de-
vice in the network, the edges identify the connec-
tions among the devices, and several graphs related
to specific timestamps are used to provide the evolu-
tion of the devices over time. A Graph Convolutional
Network provides an anomalous probability for each
edge (edge binary classification problem). A similar
approach is proposed by (Lo et al., 2022) where each
node in the GNN is represented by a pair ⟨ip add,
port num⟩. Each edge contains the values related
to the packet exchanged between the two connected
nodes. Experiments were carried out on ToN-IoT (Al-
saedi et al., 2020) and BoT-IoT (Koroniotis et al.,
2019) datasets. As a result, for the binary classifi-
cation, accuracy 97.87% using ToN-IoT and 99.99%
using BoT-IoT. As for the multi-classification, the
method achieved a detection rate of 86.78 using
ToN-IoT and 99.99 using BoT-IoT.
Towards a Geometric Deep Learning-Based Cyber Security: Network System Intrusion Detection Using Graph Neural Networks
395

(Wang and Zhu, 2022) propose a graph-based be-
havioral modelling paradigm for binary anomaly de-
tection. To evaluate the performance, they selected
four representative security issues, and carried out ex-
periments on the Kyoto-Honeypot
4
and a Darknet
dataset
5
, achieving a standardized partial AUC 0.987
for Kyoto-Honeypot and 0.885 for Darknet.
(Narasimha Prasad et al., 2022) face the intrusion
detection problem in wireless sensor networks using
simulated data. A GNN has been defined for the bi-
nary classification. However, it cannot be imposed on
unstructured network layout and timing interval for
associating the intrusion is high.
The Proposed Work. We propose a novel geomet-
ric learning-based behavioral approach for network
system intrusion detection. It exploits (i) a graph-
based model to represent a set of network traffic sam-
ples and (ii) a GNN to learn the structure of such a
graph. The goal is to tackle the network system in-
trusion detection (both binary and multi-class tasks)
problem in terms of a node-type classification prob-
lem.
The main difference with the DNN-based works
is that we face the network intrusion problem from a
different structural point of view. Such a problem is
characterized by entities and relationships that can be
expressed in a graph-based structure in a natural way.
However, representing graphs in a way that complies
with neural networks (NNs) requires considerable ef-
fort since it is essential to optimally represent the
graph’s connectivity in addition to deciding how to
represent nodes and edges. The GNNs, instead, have
been defined as NNs that work directly on graphs.
The difference with the GNN-based works needs a
more detailed discussion. With regards to (Wang and
Zhu, 2022), the proposed graph consists of one node
for each value of each sample feature. A discretiza-
tion process was proposed for continuous features, al-
though not described in detail. This representation
has two main effects: (i) the number of nodes and
edges tends to grow dramatically; (ii) the discretiza-
tion process, clearly introduced to limit the previous
issue, involves a loss of information. This issue was
evident during our experiments with UNSW-NB15 in
the attempt to use their method for comparison.
As for (Zheng et al., 2019; Lo et al., 2022),
both works proposed a graph where each node con-
tains the socket information. However, as highlighted
by (Faker and Dogdu, 2019), the detector should not
rely on the socket information since this would re-
sult in over-fitted training. The classifier should learn
4
http://www.takakura.com/Kyoto data
5
https://www.unb.ca/cic/datasets/darknet2020.html
from the features of the packets so that any host with
similar packet information is filtered out regardless of
its socket information. Thus, we propose a solution
which does not use IP address and port of the devices.
Another difference with most related works re-
gards the dataset used. We used UNSW-NB15, while
several previous works used KDDCUP99 and NSL-KDD.
Compared to KDDCUP99 and NSL-KDD, UNSW-NB15 in-
cludes more modern behaviors captured over time,
and in-depth features of network traffic. Several stud-
ies (Gogoi et al., 2012), show that KDDCUP99 and
NSL-KDD do not reflect realistic output performance.
Table 1 summarizes the comparison between our
work and the previous ones. The columns labeled
“ML model”, “dataset”, “classification”, and “online”
report respectively the type of ML model used, the
datasets used for the experiments, the type of classifi-
cation problem, and the availability of data online.
3 GRAPH NEURAL NETWORKS
(GNNs)
Here, we briefly recall the needed background to un-
derstand the GNNs. We assume that the reader is fa-
miliar with cyber security and ML notions. For fur-
ther details, refer to (Gupta and Sheng, 2019).
GNN is a type of DL architecture that operates
on graph-structured data. The goal of a GNN is to
learn the structure of a graph to solve three types of
tasks: (i) graph-level, i.e., to predict a single prop-
erty for the graph, (ii) node-level, i.e., to predict some
property for each node, (iii) edge-level, i.e., to predict
some property for each edge. To solve these tasks,
the GNN must learn to build new embeddings for the
nodes, edges, and global context. The GNN structure
is organized in layers, that are usually multilayer per-
ceptrons computing a transformation of each graph
component. Given an input node-vector (resp. input
edge-vector), i.e., a sequence of features represent-
ing a specific node x, a GNN layer returns a learned
node-vector (resp. learned edge-vector), i.e., the em-
beddings representation for x. The same mechanism
is applied to the global context of the graph, where
the result will be one only embedding for the graph.
We focus on the use of GNNs for node-level tasks,
and specifically for classifying each node of the graph
(network traffic sample), as “anomaly” or “normal”.
Message Passing. The transformations performed
by the GNN layers are based on the message pass-
ing technique. The idea is to build the embeddings
through a “neighbourhood aggregation” operation,
SECRYPT 2023 - 20th International Conference on Security and Cryptography
396

Table 1: Classification of network system intrusion detection systems.
Reference ML model dataset classification online
Tang et al. (2016) DNN NSL-KDD/KDDCUP99 binary ✗
Li et al. (2017) CNN NSL-KDD binary ✗
Vinayakumar et al. (2017) CNN/RNN KDDCUP99 binary/multi ✗
Potluri and Diedrich (2017) DNN NSL-KDD multi ✗
Known et al. (2018) CNN NSL-KDD/Kyoto-Honeypot/MAWILab binary ✗
Zheng et al. (2019) GNN N/A binary ✗
Hooshmand and Hosahalli, (2022) CNN UNSW-NB15 multi ✗
Narasimha Prasad et al. (2022) GNN N/A binary ✗
Wang and Zhu (2022) GNN Kyoto-Honeypot/DARKNET binary ✓
Lo et al. (2022) GNN ToN-IoT/BoN-IoT binary/multi ✓
Our work GNN UNSW-NB15 binary/multi ✓
i.e., an iterative mechanism that operates on the nodes
and edges of the graph where each node exchanges in-
formation with its neighbours through a transforma-
tion that aggregates its features and updates its own
feature representation. The updated embedding is
then used to generate new messages that are sent to
the node’s neighbors in the next transformation.
More formally, let G = (V,E) a graph with node
feature matrix X ∈ R
|V |×F
, where F is the number of
features for each node, let F
k
be the node representa-
tion dimensionality in the layer k, with F
0
= F; then
the k-th message passing layer is defined as:
x
(k)
u
= φ
(k)
x
(k−1)
u
,
M
v∈N
u
ψ
(k)
(x
(k−1)
u
,x
(k−1)
v
,e
uv
)
!
• x
(k)
u
denotes the embedding of the node u at the k-
th layer of the network, and x
(0)
u
= x
u
is the feature
vector corresponding to u;
• ψ
(k)
: R
F
k−1
× R
F
k−1
× R
F
′
→ R
F
k−1
is a learnable
transformation function (e.g. multi-layer percep-
tron) receiving the current node features x
(k−1)
u
,
the neighbour features x
(k−1)
v
and (optionally) an
edge feature vector e
uv
∈ R
F
′
(e.g. edge weight),
producing a new vector ψ
(k)
(x
(k−1)
u
,x
(k−1)
v
,e
uv
),
which represents the message passed from the
node v to the node u through the (u,v) edge;
•
L
denotes a permutation-invariant aggre-
gation function which combines the var-
ious message vectors produced by ψ
(k)
and outputs an aggregated feature vector
L
v∈N
u
ψ
(k)
(x
(k−1)
u
,x
(k−1)
v
,e
uv
);
• φ
(k)
: R
F
k−1
×R
F
k−1
→ R
F
k
is a learnable transfor-
mation function receiving the current node fea-
tures x
(k−1)
u
and the aggregated neighbours fea-
tures
L
v∈N
u
ψ
(k)
(x
(k−1)
u
,x
(k−1)
v
,e
uv
) as input and
producing the updated node feature vector x
(k−1)
u
.
GCN via Initial Residual and Identity Mapping.
One of the most interesting GNNs is the Graph Con-
volutional Neural Networks (GCNs). The main scal-
ability concerns regarding the GCNs is the over-
smoothing problem (loss of discriminative and local
structural information). To address such a problem, a
modified GCN architecture, named Graph Convolu-
tional Network via Initial representation and Identity
mapping (GCNII), using both residual connections
and long skip connections, has been proposed (Chen
et al., 2020). A GCNII layer is defined as follows:
X
(l)
= σ
(1 − α
l
)
˜
PX
(l−1)
+ α
l
X
(0)
(1 − β
l
) I
F
+ β
l
W
(l)
• σ is an activation function;
• X
(l)
is the updated node embedding matrix at the
l-th layer, and X
(0)
is the initial node embedding;
• α
l
∈ [0,1] is the strength of the initial node embed-
ding skip-connection, forcing each embedding to
retain at least a fraction of α
l
from the input layer;
• β
l
∈ [0,1] is the strength of the residual connection
with the previous layer; the idea is that the more
layers are stacked, the less information needs to be
added to the node representation, therefore usu-
ally this is set to β
l
= log
λ
l
+ 1
≈ λ/l, with λ
being an hyperparameter usually set to λ = 1;
• W
(l)
is a learnable linear transformation as in the
standard GCN formulation.
4 THE PROPOSED APPROACH
4.1 From Network Traffic to Graph
Problem Statement. Our idea is to use behavior-
based modeling to mine the association between net-
work traffic flows. Such flows can be represented as
Towards a Geometric Deep Learning-Based Cyber Security: Network System Intrusion Detection Using Graph Neural Networks
397

nodes of a graph where the edges represent the re-
lationships in terms of type of service, protocol, and
state. Our goal is to recognize the nodes that have the
same behavior (same state, protocol, and service), to
understand if a new node is anomaly or normal. To
this aim, inspired by the powerful representation abil-
ity of graph-based methods in spotting anomalies ef-
ficiently (Zeng et al., 2021), we exploit a graph-based
model to represent a set of network traffic flows or
samples, and a GNN to learn its structure. Thus, we
translate the network system intrusion detection prob-
lem into a node-type classification problem.
Formally, let S = [t
1
,t
2
,. .. ,t
|S|
] be a set of network
traffic samples. Each t
i
, with i = 1,. .. ,|S| can be in-
terpreted as a behavioral event which has n proper-
ties or features values, e.g., source IP address, desti-
nation IP address, port number, and so on. We de-
note with F = [ f
1
,. .. , f
n
] the set of features. A be-
havioral event is denoted as t
i
= [t
1
i
,. .. ,t
n
i
] where t
j
i
is the value of f
j
∈ F for t
i
. Two possible classifi-
cation tasks can be defined: (i) binary classification,
i.e, detecting whether an incoming event is “anomaly”
or “normal”, or (ii) multi-classification, i.e, detecting
whether an incoming event is “anomaly” and, if so,
indicating the specific “attack”, or “normal”.
The Graph-Based Model. Let S = [t
1
,t
2
,. .. ,t
|S|
] be
a set of network traffic samples. Let F be the set of
features. We define a graph G = (V,E,R), where V is
the set of nodes, and each v
i
∈ V represents the event
t
i
(network traffic sample), with i = 1, .. ., |S|. R =
[r
1
,. .. ,r
k
] ⊆ F is a subset of event features, that we
call edge features. Let u ∈ V be a node, we indicate
with u(R
j
) the value of r
j
∈ R for u.
First, we partition V as ⟨V
1
,. .. ,V
m
⟩ where each
V
i
(with i = 1,. .. ,m) has the following property: let
u,v ∈ V
i
, then u(R
j
) = v(R
j
) for each r
j
∈ R with
j = 1,. .. ,k. Then, for each set obtained during the
partitioning step described above V
i
= [u
1
,. .. ,u
|V
i
|
],
and let [u
′
1
,. .. ,u
′
|V
i
|
] be a random ordering of V
i
, we
set (u
′
l
,u
′
l+1
) ∈ E for each l = 1, .. ., |V
i
| − 1 (Fig. 1).
4.2 The Methodology
Data Pre-Processing and Feature Selection.
Given the UNSW-NB15, as a first step, we have elim-
inated the redundant features: features concerning
the switch, i.e., source IP address (srcip), (sport),
source port number (dstip), destination IP address
(dsport), and the time-related features, i.e., record
last time (ltime) and record start time (stime).
After this step, each sample has 43 features. Then,
the categorical features transaction protocol (proto),
state (state), and service (service), have been
encoded using the one-hot encoding technique. Note
that such a technique could generate huge vectors
if the number of possible values is vast since the
size of a generated feature vector is equal to the
number of possible values. Therefore, for each of
such features, first, we have sorted all the possible
values in decreasing order of frequency in the dataset.
Then, we considered the first values which cover at
least 80% of the frequency. As a result, we have the
following values:
• proto: ‘TCP’, ‘UDP’, ‘OTHER’.
• state: ‘FIN’, ‘CON’, ‘INT’, ‘OTHER’.
• service: ‘-’, ‘DNS’, ‘OTHER’.
Furthermore, for each sample such that
attack cat= null, we set attack cat= normal.
Finally, the normalization technique has been applied
using the min-max scaling technique. A feature selec-
tion has been applied to eliminate less significant fea-
tures. After the data pre-processing step, each sample
has 43 features. We further reduced the number of
features to the following 26 using the Chi-square
selection technique: sttl, dload, dttl, sload,
smeansz, sintpkt, dmeansz, dintpkt, tcprtt,
ackdat, synack, ct state ttl, ct srv src,
ct dst ltm, ct srv dst, is sm ips ports,
proto tcp, proto udp, proto other, state fin,
state con, state int, state other, service -,
service dns, and service other.
GNN: Training and Testing. We have split, us-
ing a stratified approach, the dataset into train-
ing set, consisting of the 60% of samples of the
dataset (1,524,027 samples), validation set and test-
ing set consisting each one of the 20% (508,010 sam-
ples). Observe that UNSW-NB15 is strongly unbal-
anced, with a maximum of 2,218,761 samples for
the class normal and a minimum of 174 samples
for the class worms. To overcome such a limitation,
we applied the synthetic minority over-sampling tech-
nique (Chawla et al., 2002) on the training set to
generate additional synthetic samples into the attack
classes. The size of each attack class has been aug-
mented to 129,298. As a result, the size of the training
set has been augmented to 2,495,097.
Given the training set, we created a graph G
as described in Section 4.1. We recall that each
node in G is a sample of the training set. Thus,
the number of nodes is 2,495,097. To build the
edges, we have defined the set of edge features R =
[proto,state, service], and applied the method de-
scribed in Section 4.1, generating 3,047,686 edges.
Then, we defined a GCNII to learn the structure of
G. Several types of GNN have been tested. However,
SECRYPT 2023 - 20th International Conference on Security and Cryptography
398
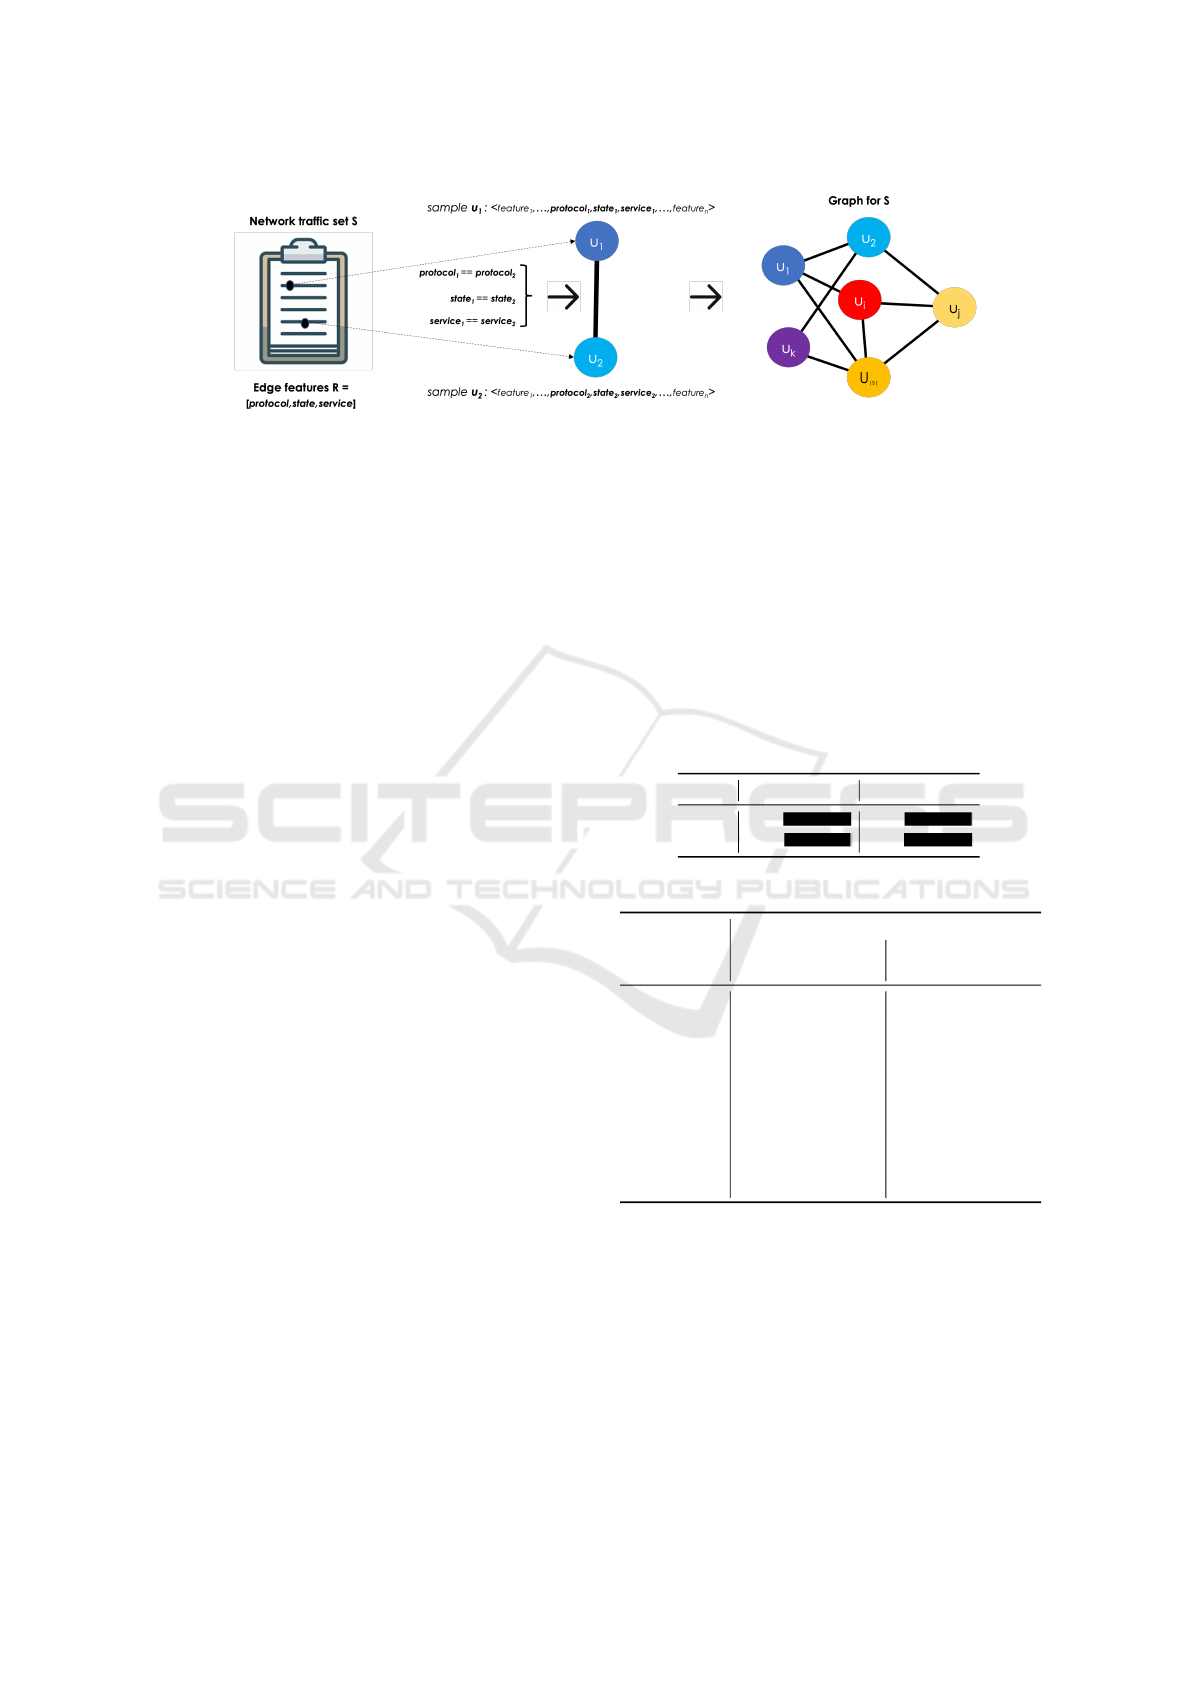
Figure 1: Graph-based model for the network traffic samples.
here, we describe the one providing the best results:
• 1 Linear layer which project the 26 features of
each input sample into one layer of size 512 (x
0
).
• 64 Convolutional blocks, where each block con-
sists of: 1 Dropout layer with probability 0.5, 1
GCN2Conv layer which takes as input the output
of the previous layer and the initial input x
0
, and
finally 1 Activation layer gelu.
• 1 Normalization layer gelu.
• 1 Dropout layer with probability 0.5.
• 1 Linear layer 512 × 512 with activation gelu.
• 1 Dropout layer with probability 0.5.
• 1 Linear layer which project the output on a layer
of size 10 (number of classes).
• 1 SoftMax layer, with Adadelta optimizer, and
weighted CrossEntropy loss function.
Then, for both the binary and the multi-class prob-
lem, such a GCNII has been trained on G, validated
on the validation set, and finally tested on the test set.
In the following we will report the results obtained.
4.3 Preliminary Experiments
Here, we report the results obtained during prelimi-
nary experiments carried out to assess the effective-
ness of the proposed method, in comparison with two
types of baselines: ML-based and CNN-based.
As for the ML-based baseline, we used the follow-
ing standard ML models on the sets described above:
Random Forest, Support Vector Machine, Gradient
Boosting, XGBRFClassifier, and XGBClassifier. Best
results were obtained using XGBClassifier.
As for the CNN-based baselines, we cho-
sen (Potluri et al., 2018) and (Hooshmand and Hosa-
halli, 2022), since they are the most recent ones us-
ing UNSW-NB15, and although they did not provide the
source code, their methodology is well described.
None of the GNN-based methods described in
Section 2 has been chosen because they were built ex-
ploiting the socket information.
Comparison with ML-Based Baseline. The com-
parison with the XGBClassifier has been performed
for both the binary and multi-classification network
traffic intrusion problem. Table 2 reports the results
obtained for the binary problem. It shows the detec-
tion rate obtained for each class. As we can see, the
detection rate of XGBClassifier on the class normal
seems slightly better. However, in the context of
anomaly detection, the ability to detect attacks has
a priority role. Indeed, our method’s detection rate
(1.000) proves to be perfect in detecting attacks.
Table 2: Binary-classification comparison with ML method.
Class XGBClassifier GNN
normal 0.997 0.986
attack 0.969 1.000
Table 3: Multi-class by XGBClassifier and our method.
Class
Multi-classification performance
XGBClassifier GNN
pre rec f-score pre rec f-score
normal 0.995 0.998 0.996 1.000 0.986 0.993
worms 0.722 0.342 0.464 0.037 0.737 0.070
backdoor 0.782 0.098 0.173 0.080 0.435 0.135
shellcode 0.652 0.655 0.654 0.201 0.655 0.307
analysis 0.719 0.042 0.080 0.097 0.316 0.148
reconnaisance 0.906 0.765 0.830 0.657 0.777 0.712
dos 0.538 0.054 0.098 0.331 0.571 0.419
fuzzers 0.700 0.494 0.579 0.420 0.787 0.548
exploits 0.591 0.923 0.720 0.850 0.433 0.574
generic 0.996 0.984 0.990 1.000 0.973 0.986
As for the multi-classification problem, Table 3
shows the precision (pre), the recall (rec), and the
f-score (f-score) reached for each class. The preci-
sion achieved by XGBClassifier is higher, i.e., it tends
to classify an attack as either correct or as exploits
(or, in the worst case, even as normal) when wrong
(see Fig. 2). Our method, instead, tends to classify
all the attacks more uniformly. This is shown by the
confusion matrix in Fig. 3, where clearly the number
of classifications is almost completely distributed on
Towards a Geometric Deep Learning-Based Cyber Security: Network System Intrusion Detection Using Graph Neural Networks
399

Figure 2: Confusion matrix with XGBClassifier.
Figure 3: Confusion matrix with the GNN.
the main diagonal. Furthermore, when an attack is
wrongly classified, the error always falls on classify-
ing it as another type of attack, and never as normal.
Comparison with CNN-Based Baselines. The
comparison has been performed only for the multi-
classification problem since such methods have been
defined only for this type of classification. In Fig. 4,
we report the detection rate reached for each class.
The method proposed in (Potluri et al., 2018) can clas-
sify only the classes normal, fuzzers, exploits,
and generic. The results obtained by (Hooshmand
and Hosahalli, 2022) are satisfying. However, the
detection rate for the classes dos and backdoor do
not exceed 15%. On average, the performance of our
method is slightly better, having a higher mean de-
tection rate of 0.677. Furthermore, the minimum de-
tection rate achieved by our proposal is at least 30%
(specifically, 0.316 for analysis).
5 CONCLUSIONS
Nowadays, network intrusion detection systems are
fundamental to protect networks from ever-evolving
Figure 4: Multi-classification performed by (Potluri et al.,
2018), (Hooshmand and Hosahalli, 2022), and our method.
malicious cyber-attacks. We propose a novel geo-
metric learning-based behavioral approach which ex-
ploits the capability of GNNs models to address, in
a natural way, problems which can be modeled us-
ing graph-based structures, such as network traffic in-
trusion detection problems. Results of preliminary
experiments prove that our method is a promising
solution. However, we remark that the proposed
graph-based representation is properly defined for
UNSW-NB15 only, and not straightforwardly applica-
ble to any dataset. For this reason, a more gener-
alizable solution will be explored. Furthermore, we
plan to explore other graph-based models and trans-
late the addressed problem into more suitable GNN-
based tasks, such as graph classification. Further-
more, we are planning experiments on further and
newer datasets types, such as the Intrusion Detection
Evaluation dataset
6
defined to cover most of the cri-
teria necessary for a reliable benchmark dataset.
REFERENCES
Alsaedi, A., Moustafa, N., Tari, Z., Mahmood, A., and An-
war, A. (2020). Ton iot telemetry dataset: A new gen-
eration dataset of iot and iiot for data-driven intrusion
detection systems. Ieee Access, 8:165130–165150.
Callegari, C., Giordano, S., and Pagano, M. (2016). Sta-
tistical network anomaly detection: An experimental
study. In FNSS 2016, pages 12–25. Springer.
Chawla, N. V., Bowyer, K. W., Hall, L. O., and Kegelmeyer,
W. P. (2002). Smote: synthetic minority over-
sampling technique. Journal of artificial intelligence
research, 16:321–357.
Chen, M., Wei, Z., Huang, Z., Ding, B., and Li, Y. (2020).
Simple and deep graph convolutional networks. In
Proceedings of the 37th International Conference on
Machine Learning. PMLR.
6
https://www.unb.ca/cic/datasets/ids-2017.html
SECRYPT 2023 - 20th International Conference on Security and Cryptography
400

Faker, O. and Dogdu, E. (2019). Intrusion detection using
big data and deep learning techniques. In Proceedings
of the 2019 ACM Southeast conference, pages 86–93.
Gaurav, A., Gupta, B. B., and Panigrahi, P. K. (2022).
A comprehensive survey on machine learning ap-
proaches for malware detection in iot-based enterprise
information system. Enterprise Information Systems,
pages 1–25.
Gogoi, P., Bhuyan, M. H., Bhattacharyya, D., and Kalita,
J. K. (2012). Packet and flow based network intrusion
dataset. In IC3 2012, Noida, India, August 6-8, 2012.,
pages 322–334. Springer.
Guarino, A., Lettieri, N., Malandrino, D., and Zaccagnino,
R. (2021). A machine learning-based approach to
identify unlawful practices in online terms of ser-
vice: analysis, implementation and evaluation. Neural
Computing and Applications, 33:17569–17587.
Guarino, A., Malandrino, D., and Zaccagnino, R. (2022).
An automatic mechanism to provide privacy aware-
ness and control over unwittingly dissemination of
online private information. Computer Networks,
202:108614.
Gupta, B. B. and Sheng, Q. Z. (2019). Machine learning for
computer and cyber security: principle, algorithms,
and practices. CRC Press.
Hooshmand, M. K. and Hosahalli, D. (2022). Network
anomaly detection using deep learning techniques.
CAAI 2022, 7(2):228–243.
Jiang, Z., Sun, L., Philip, S. Y., Li, H., Ma, J., and Shen, Y.
(2020). Target privacy preserving for social networks.
In ICDE 2020, pages 1862–1865. IEEE.
Jing, C., Wang, C., and Yan, C. (2019). Thinking like a
fraudster: Detecting fraudulent transactions via statis-
tical sequential features. In FC 2019, pages 588–604.
Springer.
Koroniotis, N., Moustafa, N., Sitnikova, E., and Turnbull,
B. (2019). Towards the development of realistic botnet
dataset in the internet of things for network forensic
analytics: Bot-iot dataset. Future Generation Com-
puter Systems, 100:779–796.
Kwon, D., Natarajan, K., Suh, S. C., Kim, H., and Kim,
J. (2018). An empirical study on network anomaly
detection using convolutional neural networks. In
ICDCS 2018, pages 1595–1598. IEEE.
Li, Z., Qin, Z., Huang, K., Yang, X., and Ye, S. (2017). In-
trusion detection using convolutional neural networks
for representation learning. In ICONIP 2017, pages
858–866. Springer.
Lo, W. W., Layeghy, S., Sarhan, M., Gallagher, M., and
Portmann, M. (2022). E-graphsage: A graph neural
network based intrusion detection system for iot. In
NOMS 2022, pages 1–9.
Mazzawi, H., Dalal, G., Rozenblatz, D., Ein-Dorx, L., Nin-
iox, M., and Lavi, O. (2017). Anomaly detection in
large databases using behavioral patterning. In ICDE
2017, pages 1140–1149. IEEE.
Moustafa, N. and Slay, J. (2015). Unsw-nb15: a compre-
hensive data set for network intrusion detection sys-
tems. In MilCIS 2015, pages 1–6.
Narasimha Prasad, S., Senthamil Selvan, K., and Lak-
shmi Dhevi, B. (2022). Intrusion detection system in
wireless sensor networks and fair resource allocation
using geometric deep learning techniques. Wireless
Personal Communications, pages 1–12.
Potluri, S., Ahmed, S., and Diedrich, C. (2018). Convolu-
tional neural networks for multi-class intrusion detec-
tion system. In Mining Intelligence and Knowledge
Exploration, pages 225–238. Springer.
Potluri, S. and Diedrich, C. (2017). Deep feature extraction
for multi-class intrusion detection in industrial control
systems. Int. J. Comput. Theory Eng, 9(5):374–379.
Song, J., Takakura, H., and Okabe, Y. (2006). Description
of kyoto university benchmark data.
Sun, P., Li, J., Bhuiyan, M. Z. A., Wang, L., and Li, B.
(2019). Modeling and clustering attacker activities in
iot through machine learning techniques. Information
Sciences, 479:456–471.
Tang, T. A., Mhamdi, L., McLernon, D., Zaidi, S. A. R.,
and Ghogho, M. (2016). Deep learning approach for
network intrusion detection in software defined net-
working. In WINCOM 2016, pages 258–263. IEEE.
Tavallaee, M., Bagheri, E., Lu, W., and Ghorbani, A. A.
(2009). A detailed analysis of the kdd cup 99 data set.
In IEEE CISDA 2009, pages 1–6.
Vinayakumar, R., Soman, K., and Poornachandran, P.
(2017). Applying convolutional neural network for
network intrusion detection. In ICACCI 2017, pages
1222–1228.
Wang, C., Wang, C., Zhu, H., and Cui, J. (2020). Law:
learning automatic windows for online payment fraud
detection. IEEE TDSC, 18(5):2122–2135.
Wang, C. and Zhu, H. (2022). Wrongdoing monitor: A
graph-based behavioral anomaly detection in cyber se-
curity. IEEE TIFS, 17:2703–2718.
Zeng, J., Chua, Z. L., Chen, Y., Ji, K., Liang, Z., and Mao,
J. (2021). Watson: Abstracting behaviors from au-
dit logs via aggregation of contextual semantics. In
NDSS.
Zheng, L., Li, Z., Li, J., Li, Z., and Gao, J. (2019). Ad-
dgraph: Anomaly detection in dynamic graph using
attention-based temporal gcn. In IJCAI, volume 3,
page 7.
Zhu, Y., Xi, D., Song, B., Zhuang, F., Chen, S., Gu,
X., and He, Q. (2020). Modeling users’ behavior
sequences with hierarchical explainable network for
cross-domain fraud detection. In Proceedings of The
Web Conference 2020, pages 928–938.
Towards a Geometric Deep Learning-Based Cyber Security: Network System Intrusion Detection Using Graph Neural Networks
401
