
Predicting Academic Performance of Low-Income Students in Public
Ecuadorian Online Universities: An Educational Data Mining Approach
Jorge Rodas-Silva
1 a
and Jorge Parraga-Alava
2 b
1
Facultad de Ciencias e Ingenier
´
ıa, Universidad Estatal de Milagro, Cdla. Universitaria Km 1 1/2 v
´
ıa Km 26, Milagro,
Ecuador
2
Facultad de Ciencias Inform
´
aticas, Universidad T
´
ecnica de Manab
´
ı, Avenida Jos
´
e Mar
´
ıa Urbina, Portoviejo, Ecuador
Keywords:
Educational Data Mining, Predicting Academic Performance, Online Education, Low-Income Students.
Abstract:
The success of higher education institutions in the online learning environment can be measured by the per-
formance of students. Identifying backgrounds or factors that increase the academic success rate of online
students is especially helpful for educational decision-makers to adequately plan actions to promote success-
ful outcomes in this digital landscape. In this paper, we identify the factors that contribute to the academic
success of students in public Ecuadorian online universities and develop a predictive model to aid in improving
their performance. Our approach involved five stages: data collection and description, which involved gather-
ing data from universities, including social demographic, and academic features. In preprocessing, cleaning,
and transforming the data to prepare it for analysis was performed. Modeling involved applying machine
learning algorithms to identify patterns and key factors to predict student outcomes. It was validated in the
next stage where the performance of feature selection and predictive model was tackled. In the last stage, were
interpreted the results of the analysis about the factors that contribute to the academic success of low-income
students in online universities in Ecuador. The results suggest that the grade in the leveling course, the family
income, and the age of the student mainly influence their academic performance. The best performances were
achieved with Boruta + Random Forest and LVQ + SVM, reaching an accuracy of 75.24% and 68.63% for
binary (Pass/Fail) and multiclass (Average/Good/Excellent) academic performance prediction, respectively.
1 INTRODUCTION
Online education has brought about a significant
transformation in the way people learn, making ed-
ucation more accessible and affordable to a vast num-
ber of people worldwide. With the outbreak of
the COVID-19 pandemic, the importance of online
higher education has become even more pronounced
as traditional in-person learning became challeng-
ing due to safety concerns and lockdown measures
(Stoian et al., 2022). Despite the many advantages
of online and distance learning, educational institu-
tions have become increasingly worried about the low
dropout/completion rates and academic performance
of the students. Institutional authorities often use
these outcomes as key parameters for assessing pro-
gram/course quality and assigning resources. Poor
academic performance usually translates into low cer-
tification rates and high dropout rates can potentially
a
https://orcid.org/0000-0001-6526-7740
b
https://orcid.org/0000-0001-8558-9122
damage the reputation of the institution, funding, and
profit, and they have significant implications for the
self-esteem of the student, well-being, employment,
and likelihood of graduating (Xavier and Meneses,
2020). Hence, it is crucial to develop mechanisms
to identify students who may have low levels of aca-
demic performance as early as possible to take proac-
tive measures towards improving online learning ex-
periences and establishing intervention strategies that
cater to the needs of the students. In this sense, data
Educational Data Mining (EDM) emerges as an inter-
esting alternative for this purpose.
EDM is a field of study that involves using data
mining and machine learning techniques to analyze
educational data in order to understand and improve
the learning process, including academic performance
and the level of learning of subjects usually with
high degrees of complexity. This becomes even more
crucial in subjects such as introductory program-
ming, which presents historically high dropout rates
(Bennedsen and Caspersen, 2019) in most careers re-
52
Rodas-Silva, J. and Parraga-Alava, J.
Predicting Academic Performance of Low-Income Students in Public Ecuadorian Online Universities: An Educational Data Mining Approach.
DOI: 10.5220/0012086300003541
In Proceedings of the 12th International Conference on Data Science, Technology and Applications (DATA 2023), pages 52-63
ISBN: 978-989-758-664-4; ISSN: 2184-285X
Copyright
c
2023 by SCITEPRESS – Science and Technology Publications, Lda. Under CC license (CC BY-NC-ND 4.0)

lated to computer science. As stated (Simeunovi
´
c and
Preradovi
´
c, 2014), these processes of analyzing edu-
cational data are important for higher education in-
stitutions given that the strategic planning of study
programs implies expanding or reducing the scope or
depth of the curriculum as well as modifying the ped-
agogical and educational process, depending on stu-
dent achievements. However, carrying out the process
of predicting student performance or level of learn-
ing is commonly difficult. Machine learning tools be-
came very popular among educational researchers be-
cause of their ease of use and the ability to discover
patterns hidden in the data.
EDM has utilized Machine Learning (ML) tech-
niques to analyze academic performance data. Essen-
tially, ML algorithms perform computational tasks by
learning patterns from data samples and making au-
tomated inferences. The goal in prediction tasks is
to create a model that can distinguish between stu-
dents who will have high or low academic perfor-
mance. The prediction model is induced using certain
variables (sometimes called feature selection), some
of which are more relevant than others and can pro-
vide valuable insights into the social, demographic,
and academic history characteristics of the students.
These variables may differ between student cohorts,
revealing important factors that influence the aca-
demic success of students.
In recent years, researchers have been using ML
techniques to predict the academic performance of
university students. The work of (Ya
˘
gcı, 2022) used
ML algorithms to predict the final exam grades of un-
dergraduate students based on midterm exam grades
as the source data in a state University in Turkey.
Similarly, in Ecuador (Carrillo and Parraga-Alava,
2018) used data mining techniques to successfully
classify students into one of three categories: “Ac-
ceptable”, “Good”, “Excellent”, according to their
academic success in professionalizing subjects and
using personal and academic data. (Belgaum et al.,
2021) found that the use of machine learning algo-
rithms based on neural networks and logistic regres-
sion significantly improved the accuracy of predict-
ing the academic performance of university students.
The work of (Su et al., 2022) used data from an on-
line course on data science and machine learning with
techniques such as decision trees and neural networks
to predict the academic performance of students. The
results show that student characteristics and learning
behavior can be used to predict student academic per-
formance with reasonable accuracy. A review arti-
cle with more detail on similar studies on the predic-
tion of academic performance can be consulted in the
work of (Alhothali et al., 2022).
The reviewed studies agree that the use of ma-
chine learning techniques is a promising tool for pre-
dicting student academic performance. Some studies
have used neural network algorithms and logistic re-
gression, while others have used decision trees and
other classification techniques. These studies found
that these techniques can significantly improve the ac-
curacy of predicting student academic performance.
However, some studies also point out that a high-
quality data set and good feature selection are nec-
essary to achieve the desired precision, and that this
quality is also influenced by the form of evaluation of
the university educational systems of each country.
Some more recent studies have used feature se-
lection techniques to find relevant characteristics to
identify relevant characteristics that influence the aca-
demic performance of students. In the work of
(Rahimi and Shute, 2021) the authors propose a hy-
brid machine learning model that uses feature selec-
tion techniques to predict academic performance in
a blended learning environment. The results showed
that the hybrid model with feature selection outper-
forms other machine learning models and feature se-
lection techniques in terms of prediction accuracy.
(Xiao et al., 2021) used a combination of feature se-
lection and machine learning models to predict stu-
dents’ academic performance in college courses. It
was shown that feature selection improved the pre-
diction accuracy and that certain features, such as the
GPA of previous courses, had a significant impact on
the prediction. Similarly, (Beckham et al., 2023) in
their work found that the most outstanding variables
in academic performance increased the grade point
average of previous courses, the number of previous
courses, age, and specialization of the study program.
The results suggest that the application of machine
learning techniques and feature selection can be use-
ful to predict student academic performance and to
identify the key factors that influence it. The work
of (Al-Zawqari et al., 2022) used slightly more ad-
vanced techniques. It used a genetic algorithm to se-
lect an optimal subset of characteristics from an initial
set of characteristics, including student demographic
information, online platform browsing behavior, and
social interactions with data from an Australian uni-
versity statistics and probability online course.
Studies have highlighted that individual student
characteristics are important in predicting their aca-
demic performance. These characteristics include
gender, age, parental education, socioeconomic sta-
tus, and previous educational history. Some studies
have also pointed to the importance of psychological
characteristics, such as motivation and self-efficacy.
Therefore, it is important to consider a wide range
Predicting Academic Performance of Low-Income Students in Public Ecuadorian Online Universities: An Educational Data Mining
Approach
53

of characteristics when trying to predict student aca-
demic performance. Some studies have also used data
on the use of the online learning platform and partic-
ipation in online discussions to improve the predic-
tion of academic performance. These findings suggest
that careful monitoring of student performance and
engagement over time may provide valuable informa-
tion for predicting future academic performance.
In general, the studies on predicting academic per-
formance and learning in university students using
EDM show that educational interventions are posi-
tively associated with student performance. However,
it is worth noting that the majority of these studies fo-
cus on traditional face-to-face learning and not on dis-
tance education or online learning, which is becoming
more prevalent in current times. Furthermore, more of
them have been conducted in specific countries, there-
fore, it is not clear whether the results are generaliz-
able to other countries and cultures with low incomes.
In this sense, this paper aims to perform the predicting
the academic performance of introductory program-
ming in online Ecuadorian university students using
machine learning algorithms according to their aca-
demic historic, and social demographic characteris-
tics. The main contributions are 1) To provide a pre-
dictive model for early warning for the academic per-
formance of online Ecuadorian university students in
the introductory programming subject. 2) To deter-
mine key factors associated with the academic perfor-
mance of online students of the Information Technol-
ogy career in public Ecuadorian universities.
Moreover, the study proposes the following two
research questions:
RQ1: What is the importance of socio-
demographic features in the academic performance of
online Ecuadorian university students in introductory
programming?
RQ2: Which machine learning prediction algo-
rithms are suitable for predicting the academic per-
formance of online Ecuadorian university students in
introductory programming?
The remainder of this paper is organized as fol-
lows. Section 2 presents the theoretical backgrounds
of online universities in Ecuador as well as perfor-
mance learning related to student learning. Section
3 explains the EDM-based study including the data
collection, preprocessing, feature selection, modeling
and evaluation metrics. Presentation and discussion
of the results are presented in Section 4. Finally, Sec-
tion 5 concludes the work and provides pointers for
future research.
2 BACKGROUNDS
2.1 Online Higher Education in
Ecuador
In 2018, the different institutions of the Ecuadorian
higher education system took their first steps towards
increasing the reach of online education and helping
complete the offer of higher education in the country.
The Ecuadorian government proposed rolling out five
bachelor’s degree programs under this system in the
five public universities that have taken on this chal-
lenge: the Technical University of Manab
´
ı (UTM)
1
,
the State University of Milagro (UNEMI)
2
, the Cen-
tral University of Ecuador (UCE), the University of
the Armed Forces (UFA-ESPE) and the Technical
University of the North (UTN).
In 2023, the UTM and UNEMI are two of the
Ecuadorian public universities with the largest num-
ber of online students in Ecuador, with about 11000
and 25000 students enrolled in this modality, respec-
tively. The UTM and UNEMI have their headquar-
ters in the cities of Portoviejo and Milagro, respec-
tively. In both cases, the cities are located in least-
developed zones in Ecuador, where a large proportion
of the population lives in the countryside (C
´
ardenas-
Cobo et al., 2021). Students entering these universi-
ties come mostly from this social stratum. This low
socioeconomic status might have a negative influence
on academic performance (Ya
˘
gcı, 2022), (Liu et al.,
2020) regardless of government initiatives to facilitate
access to educational centers
The information technology career is one of the
oldest online careers at both universities, according
to the database of the management systems of both
universities, careers at the beginning of 2023 had a
total of 2221 students enrolled. Over the years it was
observed that subjects such as introductory program-
ming present high failure and dropout rates coincid-
ing with experiences in other countries of the world
(Bennedsen and Caspersen, 2019). Therefore, there is
a huge challenge in developing more inclusive and ef-
fective learning environments and instructional meth-
ods to reduce these dropout and failure rates.
2.2 Student Learning Performance
Prediction
In essence, prediction involves deducing a target at-
tribute or variable that is to be predicted from a com-
bination of other aspects of the data, otherwise known
1
https://www.utm.edu.ec/
2
https://www.unemi.edu.ec/
DATA 2023 - 12th International Conference on Data Science, Technology and Applications
54

as predictor variables. To accomplish this, it is neces-
sary to have output variable labels available. As men-
tioned (Huynh-Cam et al., 2022), prediction has been
a widely used technique in EDM for forecasting stu-
dent performance. Predictions can fall under either
categorical or continuous output variable categories.
The use of Student Learning Performance Predic-
tion (SLPP) can result in the development of effec-
tive strategic intervention plans well in advance of
the final semester, as noted in reference (Huynh-Cam
et al., 2021). By identifying students who are at risk
of dropping out or struggling academically, SLPP can
facilitate the timely provision of additional support
such as tutoring or assistance, as noted in reference
(Tomasevic et al., 2020).
SLPP features are typically categorized into pop-
ular groupings, such as demographic, academic per-
formance, internal assessment, communication, be-
havioral, psychological, and family/personal back-
ground, as noted in reference (Alhothali et al., 2022).
These features are then utilized as inputs for SLPP
methods, which commonly employ supervised learn-
ing techniques. This is because the “students’ aca-
demic learning performance” serves as the class label
for these methods.
3 MATERIALS AND METHODS
The main objective of this work was to predict the
academic performance of the introductory program-
ming subject in low-income students in Ecuadorian
online universities based on social demographic and
academic history features. To accomplish this task,
we applied a pipeline inspired by (Huynh-Cam et al.,
2022) but re-adapted to our approach, as shown in
Figure 1.
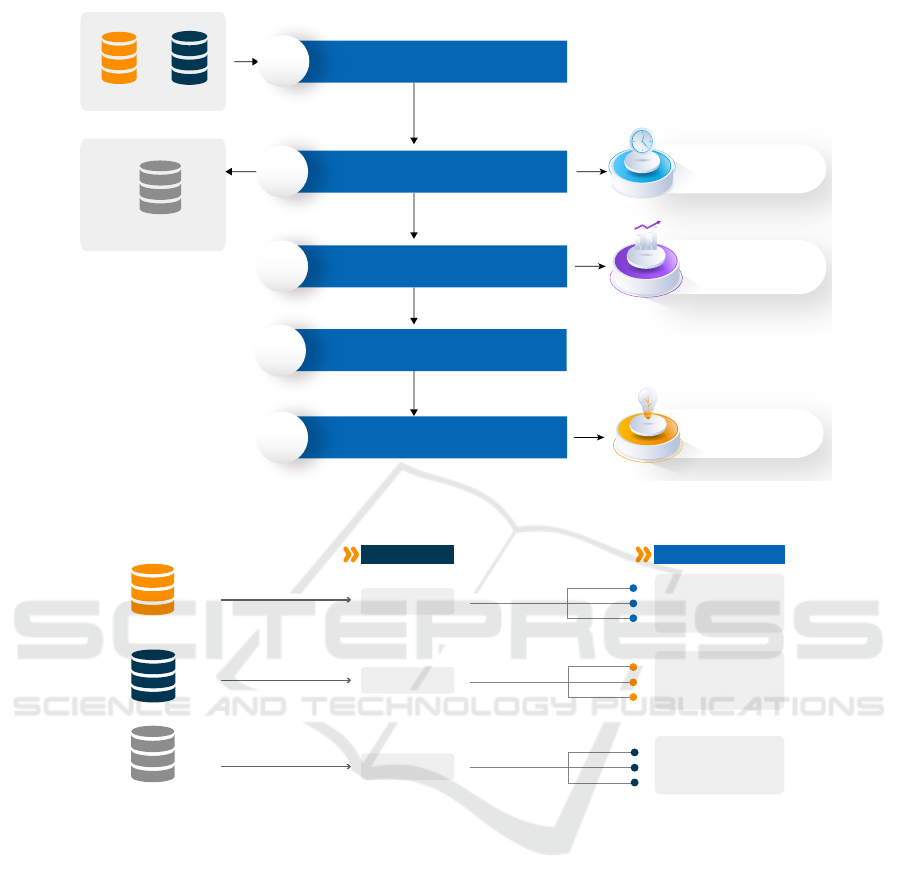
Figure 1 summarizes the pipeline followed in this
study. The first stage involves outlining the methods
used to gather data and providing an overview of the
research datasets. The second stage entails a two-
stage process of preparing the data, which includes
both data cleaning and transformation. The third
stage elaborates on a three-stage approach to imple-
menting the model, which includes data splitting, se-
lecting relevant features, and constructing the model
for making predictions. The fourth step involves as-
sessing the performance of the model, while the fifth
and final step involves summarizing the knowledge
gleaned from the research and identifying the key
factors that influence the academic performance of
the introductory programming subject in low-income
students in Ecuadorian universities online. The fol-
lowing subsections describe in detail each one of the
stages of our approach.
3.1 Stage 1. Data Collection and
Description
Data used for experiments corresponds to academic
and social demographic information of students from
the Information Technology career online modality of
the Technical University of Manab
´
ı (UTM) and State
University of Milagro (UNEMI). They were collected
directly from the universities database system during
the 2019–2022 academic year. The initial data set
contained a total of 3367 records of enrolled students
in the subject of introductory programming. 1610
and 1757 cases for students of the UTM and UN-
EMI, respectively. There were 24 different categories
of information for each student, including their ID,
gender, marital status, birth date, disability, school
of origin, familiar average income per month], main
source of living expenses, health condition, scholar-
ship, hours of internet use, final grade in course of
admission, and others, all of which were used as can-
didate input variables. The introductory programming
final grade points were used as a candidate output
variable.
3.2 Stage 2. Preprocessing
We performed a preprocessing stage to convert fea-
tures from human language into a computer-readable
format for machine learning use. During the data
cleaning step, irrelevant attributes and missing-value
samples were removed. Also, those attributes that did
not coincide in both subsets (UTM and UNEMI) were
removed. In addition, in the data transformation step,
all category features were encoded and transferred to
binary or numeric features. All features that are sensi-
tive and can reveal the identity of these students were
removed or remained anonymous for ethical reasons.
After the preprocessing stage, out of 24 initial fea-
tures, a total number of 9 features, 2 target variables,
and 1694 instances were finally selected as the dataset
to be used in experiments. we rename the dataset of
the UTM, UNEMI, and the union of both, as DS1,
DS2, and DS3, respectively. Figure 2 details the pro-
portion of instances in each of the classes of the binary
and multiclass problem.
Table 1 shows the description of selected features.
Note that final grade was discarded because it was
used to generate two target prediction variables, i.e.,
C1=class binary and C2=class multi. The target of
predictions in this work is the academic performance
of the students which is expressed from the final
grade feature but split-into into the two target predic-
Predicting Academic Performance of Low-Income Students in Public Ecuadorian Online Universities: An Educational Data Mining
Approach
55
Subset A
Data collection and description
Modeling
Conclusions
9 features,
2 predictive class,
1690 instances
Preprocessing
Evaluation
Subset B
UTM
data
UNEMI
data
Dataset
DS1 DS2
DS3
1
02
3
4
5
2.1. Data cleaning
2.2. Data transformation
3.1. Splitting data
3.2. Feature selection
3.3. Classification model
5.1. Key factors
5.2. Predictive model
Figure 1: Pipeline of our approach for predicting academic performance of the introductory programming subject in low-
income students in Ecuadorian online universities.
Fail 39.5
Fail 44.8
Fail 41.5
UTM
UNEMI
BOTH
DS1
DS2
DS3 = DS1 + DS2
Pass 60.5
Pass 55.2
Pass 58.2
C1 %
C2 %
Excellent 17.7
Good 39.1
Average 43.2
Excellent 18.8
Good 45.4
Average 35.8
Excellent 18.0
Good 41.4
Average 40.6
Figure 2: Proportions of instances in each class and dataset.
tion variables mentioned. Thereby, they can have val-
ues as Pass/Fail and Excellent/Good/Acceptable (cat-
egories are mutually exclusive) for binary and multi-
class problems, respectively.
A student is labeled as Pass when it scores 70 or
more points, otherwise, the label is Fail. Students
who have points between 70-79, 80-89, and 90-100,
belong to the categories Average-, Good, Excellent,
respectively.
3.3 Stage 3. Modeling
3.3.1 Splitting Data
To avoid overfitting, we split the dataset into two sets,
i.e., assigning 75% of the instance as training and
25% as testing.
3.3.2 Feature Selection
According to (Ang et al., 2015), Feature Selection
(FS) is a crucial step in pre-processing data for build-
ing ML models. ML models generally assume that
all features are relevant to the task at hand, however,
the more features there are, the higher the computa-
tional cost of inducing the model. Additionally, ir-
relevant attributes may hinder the predictive ability of
the model. Studies by (Chen et al., 2020) and (Cilia
et al., 2019) suggest that discarding certain original
features and inducing the model on a subset of the
same data can lead to better performance of the same
learning algorithm.
In EDM, the relevant attributes often are un-
known. The FS can discover knowledge from the col-
lected data and it is performed as a selection of the
DATA 2023 - 12th International Conference on Data Science, Technology and Applications
56

Table 1: Data summary of the dataset.
Code Feature name Feature values Description
F1 age
1= 17-20
The age range of the student.
2= 21-24 years
3= 25-28 years
4= 29-32 years
5= 33 or more
F2 gender
1= Male
The gender of the student.
2= Female
F3 marital status
1= Single
The marital status of the student.
2= else case
F4 housing head
1= No
Indicates if the student is the head of household.
2= Yes
F5 familiar income
1= 0-250 $
The family average income per month.
2= 251-375 $
3= 376-475 $
4 = 476-600 $
5 = 601 or more
F6 familiar help
1= No
Indicates if family-funded living expenses.
2= Yes
F7 children
1= None
The number of children of the student.
2= One or more
F8 second career
1= No
Indicates if is the second student career.
2= Yes
F9 leveling career
1 = Excellent (90–100 pts)
The performance achieved in career leveling.2 = Good (80–89 pts)
3 = Average (70–79 pts)
C1 class binary
1= Fail (0-69 pts)
Prediction class for the binary problem.
2= Pass (70-100 pts)
C2 class multi
1 = Excellent (90–100 pts)
Prediction class for the multi-class problem.2 = Good (80–89 pts)
3 = Average (70–79 pts)
most useful variables in the dataset. This can be a
dominant factor that highly affects the academic per-
formance of the students to improve pattern discov-
ery and class prediction in machine learning mod-
els. (Phauk and Okazaki, 2020). In our experiments,
we used Boruta (Kursa et al., 2010), Learning Vector
Quantization (LVQ) (Kohonen, 2001), and Recursive
Features Elimination (RFE) (Guyon et al., 2002). FS
techniques are used to filter irrelevant or redundant
features from the dataset, i.e., identifying which of the
9 socio-demographic and academic historical features
of the data set could be ignored during the predictive
process.
3.3.3 Classification Model
The goal of a binary classification model is to create
a model that can differentiate between successful and
unsuccessful samples from a given population. Mean-
while, in a multiclass classification model, the goal is
to classify instances into three or more classes.
We define the problem the predicting the aca-
demic performance of low-income students in public
Ecuadorian online universities as both a binary and
multi-class classification problem. In the binary the
performance can be successful (pass) or unsuccess-
ful (fail). In the multi-class case, each student has
an academic performance mutually exclusive (Excel-
lent, Good, Average) in the introductory program-
ming subject. Note that, both binary and multiclass
models are applied sequentially. First, we train a bi-
nary classification model to predict whether a student
passes or fails the introductory programming course.
Then, we apply the multiclass model only to those
students who were predicted to pass the binary model.
To predict the academic performance of the on-
line students of the Information Technology career of
the UTM and UNEMI, we build prediction models
employing the well-known classification algorithms:
random forest (RF), logistic regression (LR), Lin-
Predicting Academic Performance of Low-Income Students in Public Ecuadorian Online Universities: An Educational Data Mining
Approach
57

ear discriminant analysis (LDA), k-nearest neighbor
(KNN), decision tree (DT) and support vector ma-
chine (SVM) in the R language which was widely
used in machine learning.
3.4 Stage 4. Evaluation
In order to evaluate the effectiveness of our classifi-
cation models, we employed well-known validation
metrics. As we have the ground truth academic per-
formance (C1, C2), we use the accuracy, precision,
recall, and F-score. Here, when a student passes the
subject was called positive (P), and when it fails, neg-
ative (N). These measures are calculated as follows
(Tharwat, 2018), (Ghoneim, 2019):
Accuracy =
TP+TN
TP+FP+FN+TN
(1)
Precision =
TP
TP+FP
(2)
Recall =
TP
TP + FN
(3)
F-Score = 2 ×
Recall × Precision
Recall + Precision
(4)
Where:
• True positive (TP): the case is positive (P) and it
is classified as positive (P’)
• True negative (TN): the case is negative (N) and it
is classified as negative (N’)
• False positive (FP): the case is negative (N) and it
is classified as positive (P’)
• False negative (FN): the case is positive (P) and it
is classified as negative (N’)
We also considered the area under the curve
(AUC). It is a metric used to measure the classifica-
tion method’s prediction performance for all classi-
fication thresholds (Niyogisubizo et al., 2022). The
AUC values range from 0.5 to 1.0, with a value of 1.0
indicating excellent performance and a value of 0.5
indicating poor performance for a particular model.
3.5 Settings and Implementation Details
The computational experiments were implemented
using R (Team, 2017) version 4.2.1, R Studio (RStu-
dio Team, 2018) version 2022.12.0. To perform
stages 4-5, we use the system of packages based
on “tidyverse” (Wickham et al., 2019) including the
“tidymodels” (Kuhn and Wickham, 2020) R libraries.
The computational tests were performed on a com-
puter with Ubuntu 22.11 OS and Intel Core i7-1065G
Processor, 2.3Ghz, 8 cores/threads, 16GB RAM,
512GB Storage.
4 RESULTS AND DISCUSSION
To perform the classification, we consider as input
variables the nine features F1, . . . , F9 and as predic-
tion class, the features C1 and C2, which have the
values: Fail/Pass and Average/Good/Excellent for the
binary and multiclass case, respectively. It just repre-
sents the academic performance of introductory pro-
gramming of the students. As can be seen in Fig-
ure 2, the distribution of the instances in the classes
is not balanced. We apply an oversampling pro-
cess using Synthetic Minority Oversampling Tech-
nique (SMOTE) (Chawla et al., 2002) to our data. So,
we increase the number of observations in the minor-
ity class by generating synthetic samples based on the
existing ones, with the aim of balancing class distri-
bution and improving model performance. The re-
sults obtained, during 30 consecutive runs of the al-
gorithms, for the feature selection and classification
model is shown in the following subsections.
4.1 Importance of Socio-Demographic
Features in the Academic
Performance
To answer the RQ1, we evaluated the performance of
three feature selection algorithms - Boruta, Learning
Vector Quantization (LVQ), and Recursive Feature
Elimination (RFE) - on a dataset consisting of socio-
demographic characteristics of students and their aca-
demic performance outcomes of the introductory pro-
gramming. The aim was to identify the most relevant
features for predicting academic performance. The
selected relevant features for each feature selection
(FS) method are shown in Table 2.
Furthermore, in Figure 3 we show the number of
times that each feature is selected as important by FS
algorithm. Note that when there is no frequency for
a feature, it is because none of the 3 feature selection
algorithms considered it highly important.
4.2 Performance of Machine Learning
Prediction Algorithm
To answer the RQ2, different prediction models were
evaluated considering four scenarios: the features that
contribute most to the prediction of the academic per-
formance outcomes of the introductory programming
DATA 2023 - 12th International Conference on Data Science, Technology and Applications
58
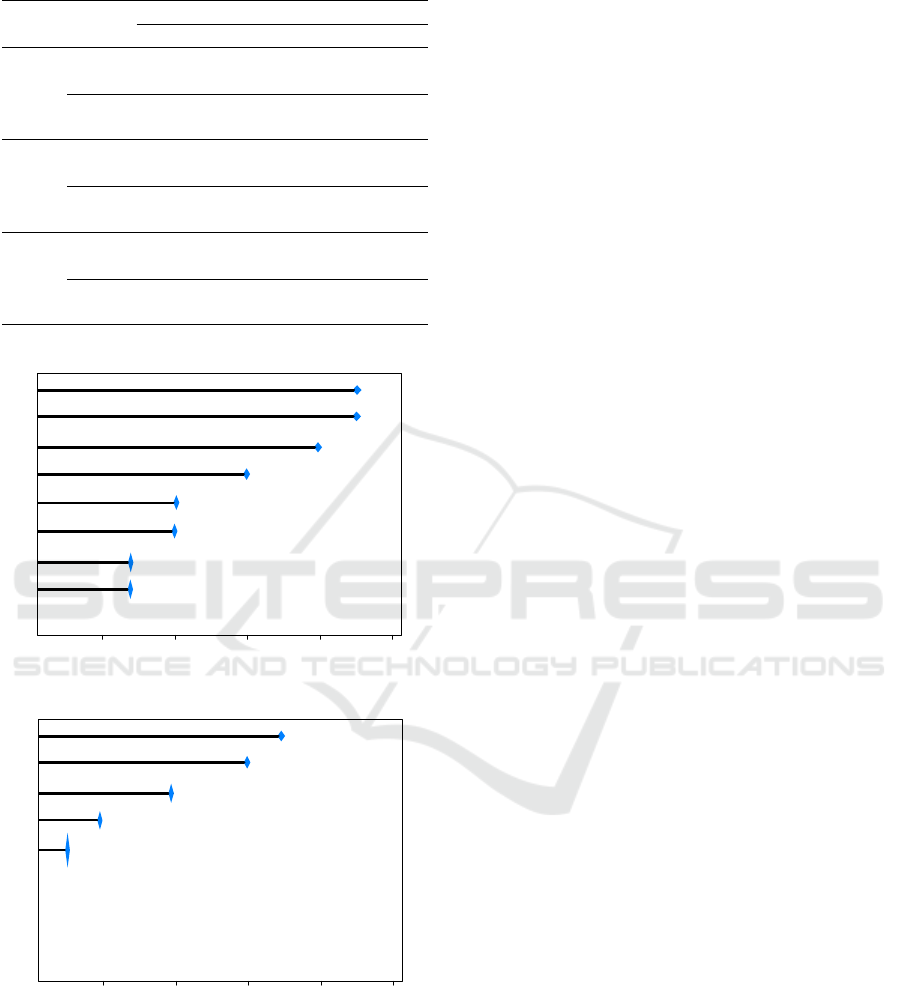
Table 2: Selected relevant features for each FS method.
Data Class
Feature selection
Boruta LVQ RFE
DS1
C1
F1 . . . F3 F9 F9 F5
F5 F7 F9 F5 F1 F2 F7
C2
F9 F9 F5 F9
F5 F1 F5
DS2
C1
F1 . . . F6 F1 F2 F1 F3
F9 F5 F6 F9 F4 F5 F9
C2
F9 F5 F6
F1 F7
DS3
C1
F1 . . . F7 F9 F5 F9 F5
F9 F1 F1 F7 F2
C2
F9 F5 F9 F5 F9
F7 F1 F1
a) Pass/Fail (C1)
Frequency as an important feature for prediction
F8
F6
F4
F7
F3
F2
F1
F5
F9
2 4 6 8 10
b) Excellent/Good/Average (C2)
F8
F4
F3
F2
F6
F7
F1
F5
F9
2 4 6 8 10
Figure 3: Number of times each feature is selected as im-
portant by FS algorithms used in experiments.
according to 1) Boruta, 2) LVQ, 3) RFE, and 4) Us-
ing all features. The average results of 30 consec-
utive runs of the prediction algorithm for the binary
and multiclass problems are shown in Tables 3-4, re-
spectively. The standard deviation is denoted as ±.
For multiclass cases, we consider the OvR (”One
vs Rest”) approach which involves one approach for
evaluating multiclass models by simultaneously com-
paring each class against all the others. To implement
this, we select one class and designate it as the “pos-
itive” class, while categorizing all remaining classes
(i.e., “the rest”) as the “negative” class (See 3.4).
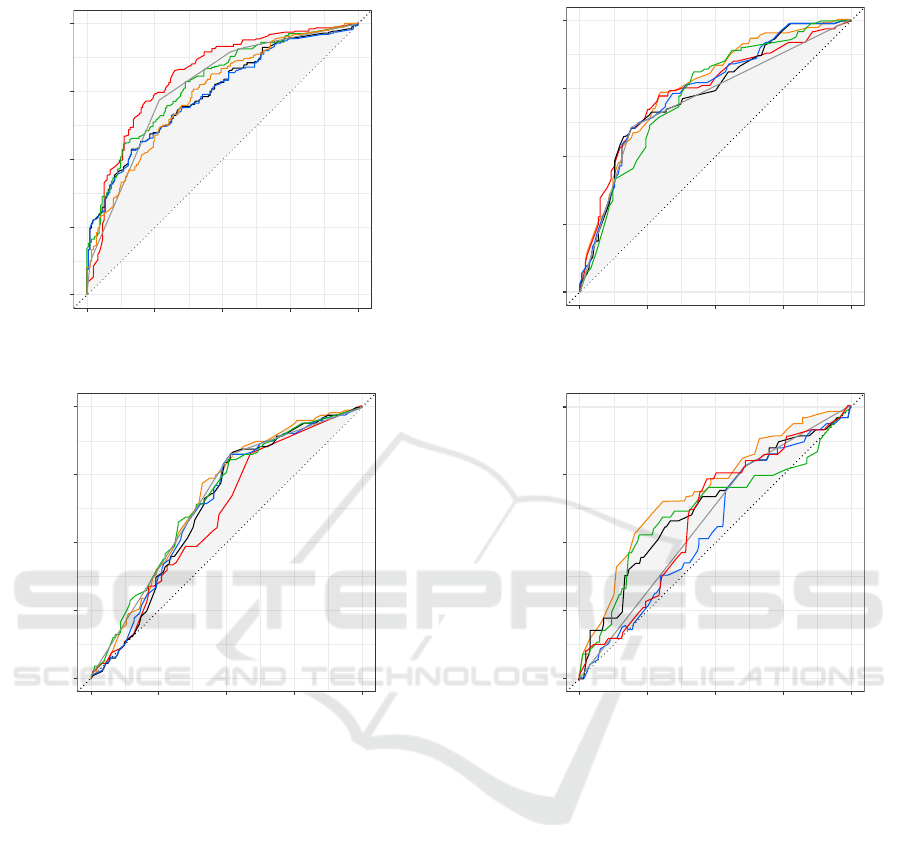
In Figure 4, we show the ROC Curve and ROC
AUC scores which are crucial resources for assessing
classification models. Essentially, they indicate the
distinguishability of the classes across all potential
thresholds, or in simpler terms, the effectiveness of
the model to accurately classify each respective class.
We show the best performance for the models using
as input the variables selected by Boruta and LVQ,
for the binary (Figure 4a) and multiclass case (Figure
4b-d), respectively.
4.3 Discussion
We analyzed the performance of the three feature se-
lection algorithms on individual features, as shown in
Table 2. The results for DS3 indicate that to clas-
sify a student as Pass/Fail for the subject introduc-
tory programming, the Boruta algorithm considered
that F8 feature does not seem to matter, that is, if
the student is studying a second career. While LVQ
and RFE, usually consider F9, F5, and F1, as rel-
evant features to predict the academic performance
of students. This means that the grade in the level-
ing course (F9), the family income (F5), and the age
(F1) of the student mainly influence passing or not
the subject. When the performance is analyzed in
terms of Average/Good/Excellent observe that three
algorithms consider the feature F9 as the most rel-
evant, followed by F5 and F1. As seen in Figures
3a-b, these three are the features with the higher fre-
quency of selection as an important feature for pre-
diction. The importance of these socio-demographic
and academic variables has also been reported by
(Ramaswami et al., 2020), (Farissi et al., 2020) and
(Bakker et al., 2023). In fact, when analyzing in depth
the DS3 data set we notice that about 74% of the stu-
dents who achieved a minimum passing grade in the
leveling feature (coded as 1 in Table 2), failed the
subject. While those who achieved an “Excellent”
score, only 1% failed the programming fundamen-
tals course. The highest percentage (55%) of those
who passed the subject corresponds to students with
leveling grades between 80-89 points. This seems to
indicate that the student’s historical score appears to
influence future performance. Regarding the impor-
tance of familiar income, it was observed that students
whose families have incomes higher than the Ecuado-
Predicting Academic Performance of Low-Income Students in Public Ecuadorian Online Universities: An Educational Data Mining
Approach
59

Table 3: Models evaluation using total instances of dataset (DS3) for the binary problem.
Feature selection Classification Model Accuracy (%) Precision (%) Recall (%) F-score (%)
Boruta
RF 75.24 ±0.92 71.78 ±0.82 66.48 ±0.80 69.03 ±0.89
LR 66.04 ±0.87 58.79 ±0.87 60.8 ±0.87 59.78 ±0.86
LDA 66.04 ±0.91 58.6 ±0.90 61.93 ±0.90 60.22 ±0.95
KNN 67.69 ±0.91 58.44 ±0.91 76.70 ±0.91 66.34 ±0.91
DT 72.41 ±0.88 64.82 ±0.88 73.3 ±0.88 68.8 ±0.88
SVM 67.45 ±0.86 59.79 ±0.88 65.91 ±0.88 62.7 ±0.88
LVQ
RF 71.46 ±1.16 65.71 ±1.16 65.34 ±1.26 65.53 ±1.34
LR 65.57 ±1.01 57.81 ±1.01 63.07 ±1.00 60.33 ±1.04
LDA 65.57 ±1.01 57.81 ±1.01 63.07 ±1.09 60.33 ±1.04
KNN 64.39 ±1.01 54.24 ±1.01 60.91 ±1.01 67.94 ±1.02
DT 71.23 ±1.01 63.11 ±1.15 73.86 ±1.25 68.06 ±1.11
SVM 71.23 ±1.35 64.21 ±1.05 69.32 ±1.25 66.67 ±1.25
RFE
RF 70.28 ±1.01 63.16 ±1.01 68.18 ±1.01 65.57 ±1.01
LR 66.27 ±1.15 59.02 ±1.16 61.36 ±1.17 60.17 ±1.04
LDA 66.51 ±1.17 59.34 ±1.17 61.36 ±1.21 60.34 ±1.12
KNN 68.4 ±1.03 57.61 ±1.00 60.34 ±1.10 60.35 ±1.02
DT 71.23 ±1.14 63.11 ±1.15 73.86 ±1.15 68.06 ±1.05
SVM 68.63 ±1.19 61.26 ±1.16 66.48 ±1.11 63.76 ±1.25
None
RF 74.76 ±1.15 69.06 ±1.16 71.02 ±1.15 70.03 ±1.01
LR 66.04 ±1.14 58.79 ±1.01 60.8 ±1.25 59.78 ±1.03
LDA 66.27 ±1.17 58.92 ±1.15 61.93 ±1.10 60.39 ±1.28
KNN 68.4 ±1.19 59.29 ±1.05 76.14 ±1.25 66.67 ±1.21
DT 72.41 ±1.35 64.82 ±1.05 73.3 ±1.01 68.8 ±1.14
SVM 66.27 ±1.35 58.73 ±1.17 63.07 ±1.25 60.82 ±1.16
Table 4: Models evaluation using total instances of dataset (DS3) for the multiclass problem.
Feature selection Classification Model Accuracy (%) Precision (%) Recall (%) F-score (%)
Boruta
RF 66.63 ±0.58 68.83 ±0.56 55.64 ±0.56 52.42 ±0.51
LR 66.63 ±0.56 68.83 ±0.56 55.64 ±0.56 52.42 ±0.52
LDA 67.44 ±0.44 66.68 ±0.55 60.04 ±0.56 50.22 ±0.53
KNN 56.59 ±0.58 68.73 ±0.41 54.89 ±0.56 56.70 ±0.53
DT 66.63 ±0.41 68.83 ±0.47 55.64 ±0.56 52.42 ±0.54
SVM 66.63 ±0.47 68.83 ±0.48 55.64 ±0.51 52.42 ±0.54
LVQ
RF 66.63 ±0.49 68.83 ±0.48 55.64 ±0.57 54.42 ±0.57
LR 66.63 ±0.51 68.83 ±0.48 55.64 ±0.48 52.42 ±0.47
LDA 67.84 ±0.54 67.88 ±0.51 61.65 ±0.48 51.56 ±0.47
KNN 55.39 ±0.55 50.18 ±0.52 50.92 ±0.60 57.22 ±0.59
DT 64.22 ±0.57 65.34 ±0.51 55.64 ±0.60 52.42 ±0.57
SVM 68.63 ±0.60 70.83 ±0.61 53.71 ±0.57 69.90 ±0.55
RFE
RF 66.63 ±0.44 68.83 ±0.40 55.64 ±0.40 52.42 ±0.42
LR 66.63 ±0.56 68.83 ±0.57 55.64 ±0.40 52.42 ±0.42
LDA 66.63 ±0.41 68.83 ±0.48 55.64 ±0.49 52.42 ±0.42
KNN 54.99 ±0.39 56.26 ±0.48 53.6 ±0.49 51.16 ±0.47
DT 66.63 ±0.48 68.83 ±0.50 55.64 ±0.58 52.42 ±0.52
SVM 66.63 ±0.62 68.83 ±0.60 55.64 ±0.58 52.42 ±0.61
None
RF 61.82 ±0.60 59.93 ±0.60 55.56 ±0.58 55.7 ±0.60
LR 65.83 ±0.57 68.38 ±0.57 54.98 ±0.54 51.51 ±0.57
LDA 67.04 ±0.57 66.43 ±0.57 59.3 ±0.54 59.23 ±0.58
KNN 57.00 ±0.57 52.97 ±0.50 52.56 ±0.54 51.41 ±0.53
DT 67.84 ±0.61 63.15 ±0.61 60.46 ±0.58 51.25 ±0.51
SVM 65.43 ±0.62 51.38 ±0.61 54.68 ±0.59 51.57 ±0.60
DATA 2023 - 12th International Conference on Data Science, Technology and Applications
60
a) Pass/Fail (C1)
0.00
0.25
0.50
0.75
1.00
0.00 0.25 0.50 0.75 1.00
1 − specificity
sensitivity
AUC=73.7%
LR
RF
AUC=80.9%
AUC=73.7%
LDA
AUC=77.7%
KNN
AUC=76.6%
DT
AUC=74.1%
SVM
b) Average vs Rest (C2)
0.00
0.25
0.50
0.75
1.00
0.00 0.25 0.50 0.75 1.00
1 − specificity
sensitivity
AUC=73.4%
LR
RF
AUC=74.3%
AUC=74.2%
LDA
AUC=73.0%
KNN
AUC=70.7%
DT
AUC=75.6%
SVM
X
X
c) Excellent vs Rest (C2)
0.00
0.25
0.50
0.75
1.00
0.00 0.25 0.50 0.75 1.00
1 − specificity
sensitivity
AUC=68.6%
LR
RF
AUC=67.1%
AUC=69.1%
LDA
AUC=63.0%
KNN
AUC=58.2%
DT
AUC=74.2%
SVM
X
c) Good vs Rest (C2)
0.00
0.25
0.50
0.75
1.00
0.00 0.25 0.50 0.75 1.00
1 − specificity
sensitivity
AUC=65.2%
LR
RF
AUC=63.4%
AUC=67.2%
LDA
AUC=57.8%
KNN
AUC=65.6%
DT
AUC=67.7%
SVM
X
Figure 4: Models AUC-ROC curves plots.
rian basic salary ($475) represent about 53% of the
students who pass the subject. On the other hand,
those who earn fewer dollars than this value represent
almost 70% of the students who fail the subject. This
seems to indicate that the higher the family income,
the better the academic performance. Finally, it is ob-
served that students between 17 and 24 years old cor-
respond to 70% of the students who fail. While those
aged 25 or over are 60% of those who pass the subject.
This seems to be an indication that older students tend
to be more interested in passing the introductory pro-
gramming course. In brief, the grade in the leveling
course (F9) is likely an important predictor because
it reflects a student’s prior knowledge and prepara-
tion for the subject. Students who performed well in
the leveling course may have a better foundation to
build upon in the introductory programming course,
while those who struggled may face more challenges
in keeping up with the material. The family income
(F5) may be an important predictor because it can im-
pact a student’s access to resources and support that
are critical for academic success. The age (F1) may be
an important predictor because older students may ap-
proach their studies differently than younger students.
Older students may have more competing responsi-
bilities such as work or family obligations, which can
impact their ability to devote time and energy to their
studies. The findings provide insights for educators
and policymakers of the UTM and UNEMI on how to
support low-income students in online higher educa-
tion and improve their chances of success.
The experimental results with the prediction mod-
els aim to demonstrate that our approach can better
distinguish between passing and Failing the course by
the students with a high probability as well as getting
a final grade into categories Average, Good, and Ex-
cellent. Results showed in Tables 3-4 seem to demon-
strate that the performance of the binary prediction is
Predicting Academic Performance of Low-Income Students in Public Ecuadorian Online Universities: An Educational Data Mining
Approach
61

better when Boruta with RF model is used (except in
recall metric). Meanwhile, for the multiclass case, the
best performance is understood using LVQ + SVM
(except for the recall metric). The accuracy of 75.24%
(highlighted in gray) means that little more than 7 out
of 10 students classified as passing or failing are cor-
rectly labeled as such. While a little more than 6 out
of 10 students correctly predict their academic per-
formance in terms of average, good, or excellent final
grades.
In Figure 4 larger area under the curve (AUC) cor-
responds to the better classification effect. Here, we
can observe that AUC values of the RF (Figure 4a)
and SVM (Figure 4b-d) are higher than those of other
prediction models for binary and multiclass cases, re-
spectively; visually, it seems to have the best perfor-
mance for academic performance prediction. To de-
tect whether prediction models operate similarly or
not from a statistical point of view, we carried out
the ANOVA test. It verifies whether the average per-
formance regarding AUC of the methods is signif-
icantly different between them. We conducted the
test and found p-values of 0.0123, 1.23e-09, 1.2e-
16, and 1.2e-16, for predictions of Pass/Fail, Average
Vs Rest, Good Vs Rest, and Excellent Vs Rest, re-
spectively. As they are lower than our threshold of
0.05, we can say that there is a statistically signif-
icant difference in the performance of classification
models regarding AUC value. As the ANOVA test
is significant, we can compute Tukey HSD (Tukey
Honest Significant Differences) to perform multiple
pairwise comparisons between the means of groups.
We conducted the test and found p-values lower than
our threshold of 0.05 when comparing the AUC of RF
with LR, LDA, DT, and SVM, so we can say that there
is a statistically significant difference between these
models for the academic performance (Pass/Fail) out-
comes of the introductory programming. However,
when it was compared with KNN, we found no dif-
ferences. For the prediction of Average vs Rest, we
found p-values lower than our threshold when com-
paring SVM with LDA and DT, with other models
we found no differences. For the prediction of Good
vs Rest, we found p-values lower than our threshold
when comparing SVM with RF, KNN, and DT, with
other models we found no differences. Finally, we
can say that there is a statistically significant differ-
ence between SVM and other models for academic
performance (Excellent vs Rest).
5 CONCLUSIONS
This work presents a predictive model for early warn-
ing of academic performance for online Ecuadorian
university students in the introductory programming
subject.
Different feature selection and predictive models
are compared by evaluating the well-known valida-
tion metrics namely, Accuracy, Precision, Recall, F-
score as well as the ROC curve and AUC score.
In terms of the results, the computational exper-
iments shows that the grade in the leveling course,
family income, and age of the student are the main
factors influencing academic performance in terms of
passing or failing the subject and achieving an aver-
age, good, or excellent final grade.
When our approach uses Boruta + Random Forest
and LVQ + SVM, the academic performance predic-
tion is achieved in a better way, with 7 out of 10 cases
and 6 out of 10 cases, correctly labeled for binary
(Pass/Fail) and multiclass (Average/Good/Excellent)
academic performance prediction, respectively.
REFERENCES
Al-Zawqari, A., Peumans, D., and Vandersteen, G. (2022).
A flexible feature selection approach for predicting
student’s academic performance in online courses.
Computers and Education: Artificial Intelligence,
3:100103.
Alhothali, A., Albsisi, M., Assalahi, H., and Aldosemani, T.
(2022). Predicting student outcomes in online courses
using machine learning techniques: A review. Sus-
tainability, 14(10).
Ang, J. C., Mirzal, A., Haron, H., and Hamed, H.
N. A. (2015). Supervised, unsupervised, and semi-
supervised feature selection: a review on gene selec-
tion. IEEE/ACM transactions on computational biol-
ogy and bioinformatics, 13(5):971–989.
Bakker, T., Krabbendam, L., Bhulai, S., Meeter, M.,
and Begeer, S. (2023). Predicting academic suc-
cess of autistic students in higher education. Autism,
0(0):13623613221146439.
Beckham, N. R., Akeh, L. J., Mitaart, G. N. P., and Mo-
niaga, J. V. (2023). Determining factors that affect
student performance using various machine learning
methods. Procedia Computer Science, 216:597–603.
7th International Conference on Computer Science
and Computational Intelligence 2022.
Belgaum, M. R., Alansari, Z., Musa, S., Alam, M. M.,
and Mazliham, M. S. (2021). Impact of artificial
intelligence-enabled software-defined networks in in-
frastructure and operations: Trends and challenges.
International Journal of Advanced Computer Science
and Applications, 12(1).
DATA 2023 - 12th International Conference on Data Science, Technology and Applications
62

Bennedsen, J. and Caspersen, M. E. (2019). Failure rates
in introductory programming: 12 years later. ACM
Inroads, 10(2):30–36.
C
´
ardenas-Cobo, J., Puris, A., Novoa-Hern
´
andez, P., Parra-
Jim
´
enez,
´
A., Moreno-Le
´
on, J., and Benavides, D.
(2021). Using scratch to improve learning program-
ming in college students: A positive experience from
a non-weird country. Electronics, 10(10):1180.
Carrillo, J. M. and Parraga-Alava, J. (2018). How predicting
the academic success of students of the espam mfl?: A
preliminary decision trees based study. In 2018 IEEE
Third Ecuador Technical Chapters Meeting (ETCM),
pages 1–6.
Chawla, N. V., Bowyer, K. W., Hall, L. O., and Kegelmeyer,
W. P. (2002). Smote: synthetic minority over-
sampling technique. Journal of artificial intelligence
research, 16:321–357.
Chen, R.-C., Dewi, C., Huang, S.-W., and Caraka, R. E.
(2020). Selecting critical features for data classifica-
tion based on machine learning methods. Journal of
Big Data, 7(1):52.
Cilia, N. D., De Stefano, C., Fontanella, F., Raimondo, S.,
and Scotto di Freca, A. (2019). An experimental com-
parison of feature-selection and classification methods
for microarray datasets. Information, 10(3):109.
Farissi, A., Dahlan, H. M., et al. (2020). Genetic algo-
rithm based feature selection with ensemble methods
for student academic performance prediction. In Jour-
nal of Physics: Conference Series, volume 1500, page
012110. IOP Publishing.
Ghoneim, S. (2019). Accuracy, Recall, Precision, F-Score
and Specificity, which to optimize on.
Guyon, I., Weston, J., Barnhill, S., and Vapnik, V. (2002).
Gene selection for cancer classification using support
vector machines. Machine learning, 46:389–422.
Huynh-Cam, T.-T., Chen, L.-S., and Huynh, K.-V. (2022).
Learning performance of international students and
students with disabilities: Early prediction and feature
selection through educational data mining. Big Data
and Cognitive Computing, 6(3).
Huynh-Cam, T.-T., Chen, L.-S., and Le, H. (2021). Using
decision trees and random forest algorithms to predict
and determine factors contributing to first-year uni-
versity students’ learning performance. Algorithms,
14(11).
Kohonen, T. (2001). Learning Vector Quantization, pages
245–261. Springer Berlin Heidelberg, Berlin, Heidel-
berg.
Kuhn, M. and Wickham, H. (2020). Tidymodels: a collec-
tion of packages for modeling and machine learning
using tidyverse principles.
Kursa, M. B., Jankowski, A., and Rudnicki, W. R. (2010).
Boruta–a system for feature selection. Fundamenta
Informaticae, 101(4):271–285.
Liu, J., Peng, P., and Luo, L. (2020). The relation between
family socioeconomic status and academic achieve-
ment in china: A meta-analysis. Educational Psychol-
ogy Review, 32:49–76.
Niyogisubizo, J., Liao, L., Nziyumva, E., Murwanashyaka,
E., and Nshimyumukiza, P. C. (2022). Predicting
student’s dropout in university classes using two-
layer ensemble machine learning approach: A novel
stacked generalization. Computers and Education:
Artificial Intelligence, 3:100066.
Phauk, S. and Okazaki, T. (2020). Study on dominant fac-
tor for academic performance prediction using feature
selection methods. International Journal of Advanced
Computer Science and Applications, 11:492–502.
Rahimi, S. and Shute, V. J. (2021). First inspire, then in-
struct to improve students’ creativity. Computers &
Education, 174:104312.
Ramaswami, G. S., Susnjak, T., Mathrani, A., and Umer,
R. (2020). Predicting students final academic perfor-
mance using feature selection approaches. In 2020
IEEE Asia-Pacific Conference on Computer Science
and Data Engineering (CSDE), pages 1–5.
RStudio Team (2018). RStudio: Integrated Development
Environment for R. RStudio, Inc.
Simeunovi
´
c, V. and Preradovi
´
c, L. (2014). Using data min-
ing to predict success in studying. Croatian Journal
of Education, 16(2):491–523.
Stoian, C. E., F
˘
arcas
,
iu, M. A., Dragomir, G.-M., and
Gherhes
,
, V. (2022). Transition from online to face-to-
face education after covid-19: The benefits of online
education from students’ perspective. Sustainability,
14(19).
Su, Y.-S., Lin, Y.-D., and Liu, T.-Q. (2022). Applying ma-
chine learning technologies to explore students’ learn-
ing features and performance prediction. Frontiers in
Neuroscience, 16.
Team, R. C. (2017). R: A Language and Environment for
Statistical Computing. R Foundation for Statistical
Computing.
Tharwat, A. (2018). Classification assessment methods. Ap-
plied Computing and Informatics.
Tomasevic, N., Gvozdenovic, N., and Vranes, S. (2020). An
overview and comparison of supervised data mining
techniques for student exam performance prediction.
Computers & Education, 143:103676.
Wickham, H., Averick, M., Bryan, J., Chang, W., Mc-
Gowan, L. D., Franc¸ois, R., Grolemund, G., Hayes,
A., Henry, L., Hester, J., Kuhn, M., Pedersen, T. L.,
Miller, E., Bache, S. M., M
¨
uller, K., Ooms, J., Robin-
son, D., Seidel, D. P., Spinu, V., Takahashi, K.,
Vaughan, D., Wilke, C., Woo, K., and Yutani, H.
(2019). Welcome to the tidyverse. Journal of Open
Source Software, 4(43):1686.
Xavier, M. and Meneses, J. (2020). Dropout in Online
Higher Education: A scoping review from 2014 to
2018.
Xiao, W., Ji, P., and Hu, J. (2021). Rnkheu: A hybrid fea-
ture selection method for predicting students’ perfor-
mance. Scientific Programming, 2021:1–16.
Ya
˘
gcı, M. (2022). Educational data mining: prediction
of students’ academic performance using machine
learning algorithms. Smart Learning Environments,
9(1):11.
Predicting Academic Performance of Low-Income Students in Public Ecuadorian Online Universities: An Educational Data Mining
Approach
63
