
BAGUETTE: Hunting for Evidence of Malicious Behavior in Dynamic
Analysis Reports
Vincent Raulin
1 a
, Pierre-Franc¸ois Gimenez
2 b
, Yufei Han
1
and Val
´
erie Viet Triem Tong
2 c
1
Inria, Univ. Rennes, IRISA, Rennes, France
2
CentraleSup
´
elec, Univ. Rennes, IRISA, Rennes, France
Keywords:
Malware Analysis, Visualization, Dynamic Analysis.
Abstract:
Malware analysis consists of studying a sample of suspicious code to understand it and producing a represen-
tation or explanation of this code that can be used by a human expert or a clustering/classification/detection
tool. The analysis can be static (only the code is studied) or dynamic (only the interaction between the code
and its host during one or more executions is studied). The quality of the interpretation of a code and its later
detection depends on the quality of the information contained in this representation. To date, many analyses
produce voluminous reports that are difficult to handle quickly. In this article, we present BAGUETTE, a
graph-based representation of the interactions of a sample and the resources offered by the host system during
one execution. We explain how BAGUETTE helps automatically search for specific behaviors in a malware
database and how it efficiently assists the expert in analyzing samples.
1 INTRODUCTION
Malware infection is a major cybersecurity threat
that evolves persistently and rapidly. The perpetra-
tors progressively refine their malware payloads and
related extortion activities. More than 120 million
new malware samples are uncovered every year. Ac-
cording to the report from Cybersecurity Ventures
1
,
Ransomware will cost its victims around 265 billion
USD annually by 2031. Therefore, developing and
updating malware detection techniques to mitigate
malware-associated cyber-threats becomes necessary.
Security researchers have been working on mal-
ware detection for decades. The mainstream malware
analysis solutions can be categorized as static anal-
ysis and dynamic analysis. Static analysis methods
scan the raw bytes of the software to extract signa-
tures, such as printable strings, n-grams, and instruc-
tions. However, the signature-based static analysis
might be vulnerable to code obfuscation. In con-
trast, dynamic analysis executes each software in an
isolated environment (e.g., a sandbox) to collect its
run-time behaviour information. By using such be-
a
https://orcid.org/0000-0002-7125-9947
b
https://orcid.org/0000-0002-4238-4423
c
https://orcid.org/0000-0003-4838-2952
1
https://tinyurl.com/3ck4uyfr
havioral information, dynamic analysis can produce
a higher detection rate and is more robust to evading
techniques such as packed and obfuscated codes. Our
study focuses on representing and visualizing the be-
haviour information about malware samples extracted
from Cuckoo report. We aim to make this informa-
tion easy to analyze and manipulate by the human
expert and to produce easy-to-interpret results to
identify suspicious payloads.
In previous works, dynamic traces are usually or-
ganised as reports stacking all run-time information,
including file access, network activities, registry oper-
ations, and process/thread information. As informa-
tive as they are, they can’t help automatically iden-
tify the malicious payloads, i.e., facilitating machine
learning-driven methodologies to detect the existence
of malicious functions in malware samples. Fur-
thermore, it is difficult for human experts to under-
stand how malware samples compromise the target
system by simply reading the malware analysis re-
ports. Therefore, we propose a graph-based post-
processing analysis report framework, named Behav-
ioral Analysis Graph Using Execution Traces To-
wards Explainability (BAGUETTE). We describe
how the BAGUETTE graph-based representation is
designed and we demonstrate in the rest of the arti-
cle how it can benefit the downstream analysis.
Raulin, V., Gimenez, P., Han, Y. and Tong, V.
BAGUETTE: Hunting for Evidence of Malicious Behavior in Dynamic Analysis Reports.
DOI: 10.5220/0012086400003555
In Proceedings of the 20th International Conference on Security and Cryptography (SECRYPT 2023), pages 417-424
ISBN: 978-989-758-666-8; ISSN: 2184-7711
Copyright
c
2023 by SCITEPRESS – Science and Technology Publications, Lda. Under CC license (CC BY-NC-ND 4.0)
417

The main contributions of this article are:
• We define the heterogeneous graph used by
BAGUETTE that summarizes the interactions be-
tween the malware and the network, the file sys-
tem activity, the registry keys and more;
• We demonstrate the usefulness of such graphs
with the automatic search of behavioral subgraphs
on Windows Malware;
• We detail a study of a Windows ransomware,
LockBit.
2 RELATED WORKS
Most works on dynamic analysis (Sihwail et al.,
2018) (Raff and Nicholas, 2020) collect system call
or API call traces because they are the medium of in-
teraction between a program and the host OS. Any
malicious action the malware may take over the re-
sources of the target system involves API calls in the
captured traces (Kolosnjaji et al., 2016)(Wunderlich
et al., 2020). While some work only makes use of
the name of the API calls, their parameters can also
be important to identify suspicious behaviours (Ding
et al., 2018)(Park et al., 2010)(Xiao et al., 2019).
Monitoring disk access, network traffic, and OS ac-
tivity inside a virtual machine have also been pro-
posed in (Alptekin et al., 2019)(Wang et al., 2019).
Finally, physical properties like CPU usage (Piplai
et al., 2020) or CPU power consumption (Bridges
et al., 2018) can also be monitored.
To facilitate human analysts and Machine
Learning-driven malware classification, execution
traces produced by dynamic analysis needs to be re-
organised into well-formatted feature representation
of malware behaviors. We summarize previous works
on defining malware feature representations from the
following three perspectives.
2.1 Sequences of Function Calls to
Record Malware Behaviours
A classical representation directly uses time series
of system calls without parameters (Kolosnjaji et al.,
2016)(Wunderlich et al., 2020). N-grams (sequences
of n system calls) or word embedding vectors (a ma-
chine learning technique) are then extracted to con-
duct malware analysis. A graph structure similar to
Markov chains has also been proposed (Chen et al.,
2017), where each vertex denotes a system call and
each edge is labelled by the probability to chain
two system calls in the observed executing traces.
This representation was extended by (Grimmer et al.,
2018) to consider n-tuples of system calls. The rep-
resentation has a main advantage: its size does not
depend on the sample or the size of the execution
traces, but only on the number of system calls being
monitored. Another approach is proposed by (Qiang
et al., 2022) that reconstructs the program’s control
flow graph from execution traces.
The limit of the sequential representation is they
cannot produce a semantic understanding of malware
behaviours. The temporal sequence of the function
calls cannot show much beyond the execution order of
different API/system functions and it does not detail
the system resources accessed, created, or modified
by these functions. This prevents further interpreta-
tion of malware functions and makes malware anal-
ysis vulnerable to mimicry attacks, where adding/re-
moving a few function calls evades detection.
Besides the name of the function calls, the param-
eters of these API/system calls allow human analysts
to characterize the behavior of a malware. For exam-
ple, it can be used to identify whether an ”open file”
system call and a ”write into file” system call concern
the same file. Several representations track objects,
such as files, sockets, or threads manipulated by sys-
tem calls from parameters or return values. For ex-
ample, (Ding et al., 2018) defines a graph where each
vertex is a system call, and a directed edge links ev-
ery pair of consecutive system calls that manipulate
the same object in the sequence. Two other works,
(Xiao et al., 2019) and (Park et al., 2010), consist of
multiple time series, one for each set of system calls
manipulating the same object.
While these representations use API call parame-
ters to track actions on objects, they do not allow easy
analysis of the interactions between system objects.
Our heterogeneous representation includes the effects
of system calls with their parameters on the system,
creating semantics links between the different objects.
2.2 Interactions with the Hosting
System
To better analyze malware behaviors, several works
do not only rely on system calls but also on mul-
tiple other sources of information about the system,
such as network traffic, contacted IPs, URLs, or do-
mains, and file accesses. In (Alptekin et al., 2019),
processes, threads, files and sockets are included in
a graph-based representation. The manipulated ob-
jects are higher-level concepts: for example, file ob-
jects (which have persistence in the system) replace
file descriptors (which are only valid for the current
process). Sadly, there is little information on how they
build this graph.
SECRYPT 2023 - 20th International Conference on Security and Cryptography
418

These works build representations for a single pur-
pose: for example, (Piplai et al., 2020) is a data min-
ing tool and (Kolosnjaji et al., 2016) is meant to be
used with machine learning algorithms. Our work
aims to create a well-defined representation that can
be used for multiple purposes, from machine learning
to expert analysis. We demonstrate this ability with
two experiments: automatic graph analysis and mal-
ware visualization.
2.3 Interactions Between Processes of
Different Applications
The work from (Wang et al., 2019) proposes a graph-
structured representation to monitor multiple pro-
cesses on several machines. This is a heterogeneous
graph with three node types: file, process and socket.
There are three kinds of edges: from a process to a
socket (if that process uses this socket to communi-
cate), from a process to a file (if that process interacts
with it) and from a process to another one (if the for-
mer creates the latter). This malware representation
can identify a suspicious process by comparing its be-
havior with benign processes. It can also be used to
analyze the behavior of a malware with respect to the
files it handles, the processes it spawns and the IP ad-
dresses it contacts. For example, it could help iden-
tify a remote Command and Control (C&C) server.
However, this method requires a more complex ex-
perimental setup to build than a classical host-scale
monitoring. Our work focuses on the impact of the
malware on the system and, in this regard, is more
complete than (Wang et al., 2019)’s work. Indeed, on
most systems, three types of entities is not enough to
describe the behavior of a malware sample. In our
representation, more types of entities are present, and
we define more subtle interactions between them. Our
representation is restricted to the direct perimeter of
action of the malware : we track all the actions of the
malware on the host system, as well as what goes in
and out of the machine.
Finally, VirusTotal’s database exploration graph
2
is a representation that entails the interactions be-
tween a malware and other entities (file, IP, domains,
etc.), both via internet and via the file system. It is a
very high-level representation that does not contain,
for example, the network data transmitted or the in-
teractions between file access.
From the previous works, it appears that a higher-
level, more detailed and semantically richer represen-
tation of malware behavior is necessary in the com-
munity of malware analysis. To answer this prob-
2
The Virus Total website: https://www.virustotal.com/
lem, we present here BAGUETTE a framework based
on heterogeneous graphs that attempts to capture as
much as possible the effect of the malware on the
system while staying readable by both ML-based ap-
proaches and human analysts.
3 BAGUETTE GRAPHS FOR
AUTOMATIC EXPLORATION
We propose to use the BAGUETTE graph to repre-
sent the behavioral information extracted during a dy-
namic analysis conducted with Cuckoo over 2 min-
utes (limit of resources). A BAGUETTE graph shows
the actions that malware samples took over system re-
sources, such as files and the network traffics. It en-
ables human analysts to flag and understand the mali-
cious payloads of malware samples.
3.1 Definition of BAGUETTE Graphs
A BAGUETTE graph is defined as a heterogeneous
graph containing 14 types of nodes: Host, Process,
Thread, API Call, Import, File, Directory, Handle,
Connection, Socket, Diff, Registry Key, Registry En-
try and Registry Handle. Each of these types of nodes
has its own attributes. Edges and arrows are typed
as well (e.g., ”Has Child Process”, ”References File
System”, ”Has Similar Content”. . . 59 types in total).
The definition of the node attributes and edges types
in a BAGUETTE graph is presented in Figure 1.
The root node of a BAGUETTE graph is a Host
node. It represents a physical machine that starts pro-
cesses, connects to other machines and owns hard
drives to store the file system. In our study, one Host
node will always denote the virtual machine (VM) ex-
ecuting dynamic analysis. Other hosts may appear in
the graph if they are connected to the VM by network
connections.
We introduce multiple categories of types which
group vertices, edges and arrow types by the behav-
ior they represent. For example, Process, Thread and
Call nodes are related to the execution of programs.
They will be organized to represent the execution
tree (process and thread hierarchy, which each Thread
node spanning the sequence of API Call nodes that it
made).
File system activity is represented by File, Direc-
tory and Handle nodes. In a BAGUUETTE graph,
they will form the part of the file system tree that was
used by the sample during the execution, with its root
drives connected to the host machine.
Network activity is represented by Socket, Con-
nection and Host nodes. Multiple Host nodes might
BAGUETTE: Hunting for Evidence of Malicious Behavior in Dynamic Analysis Reports
419
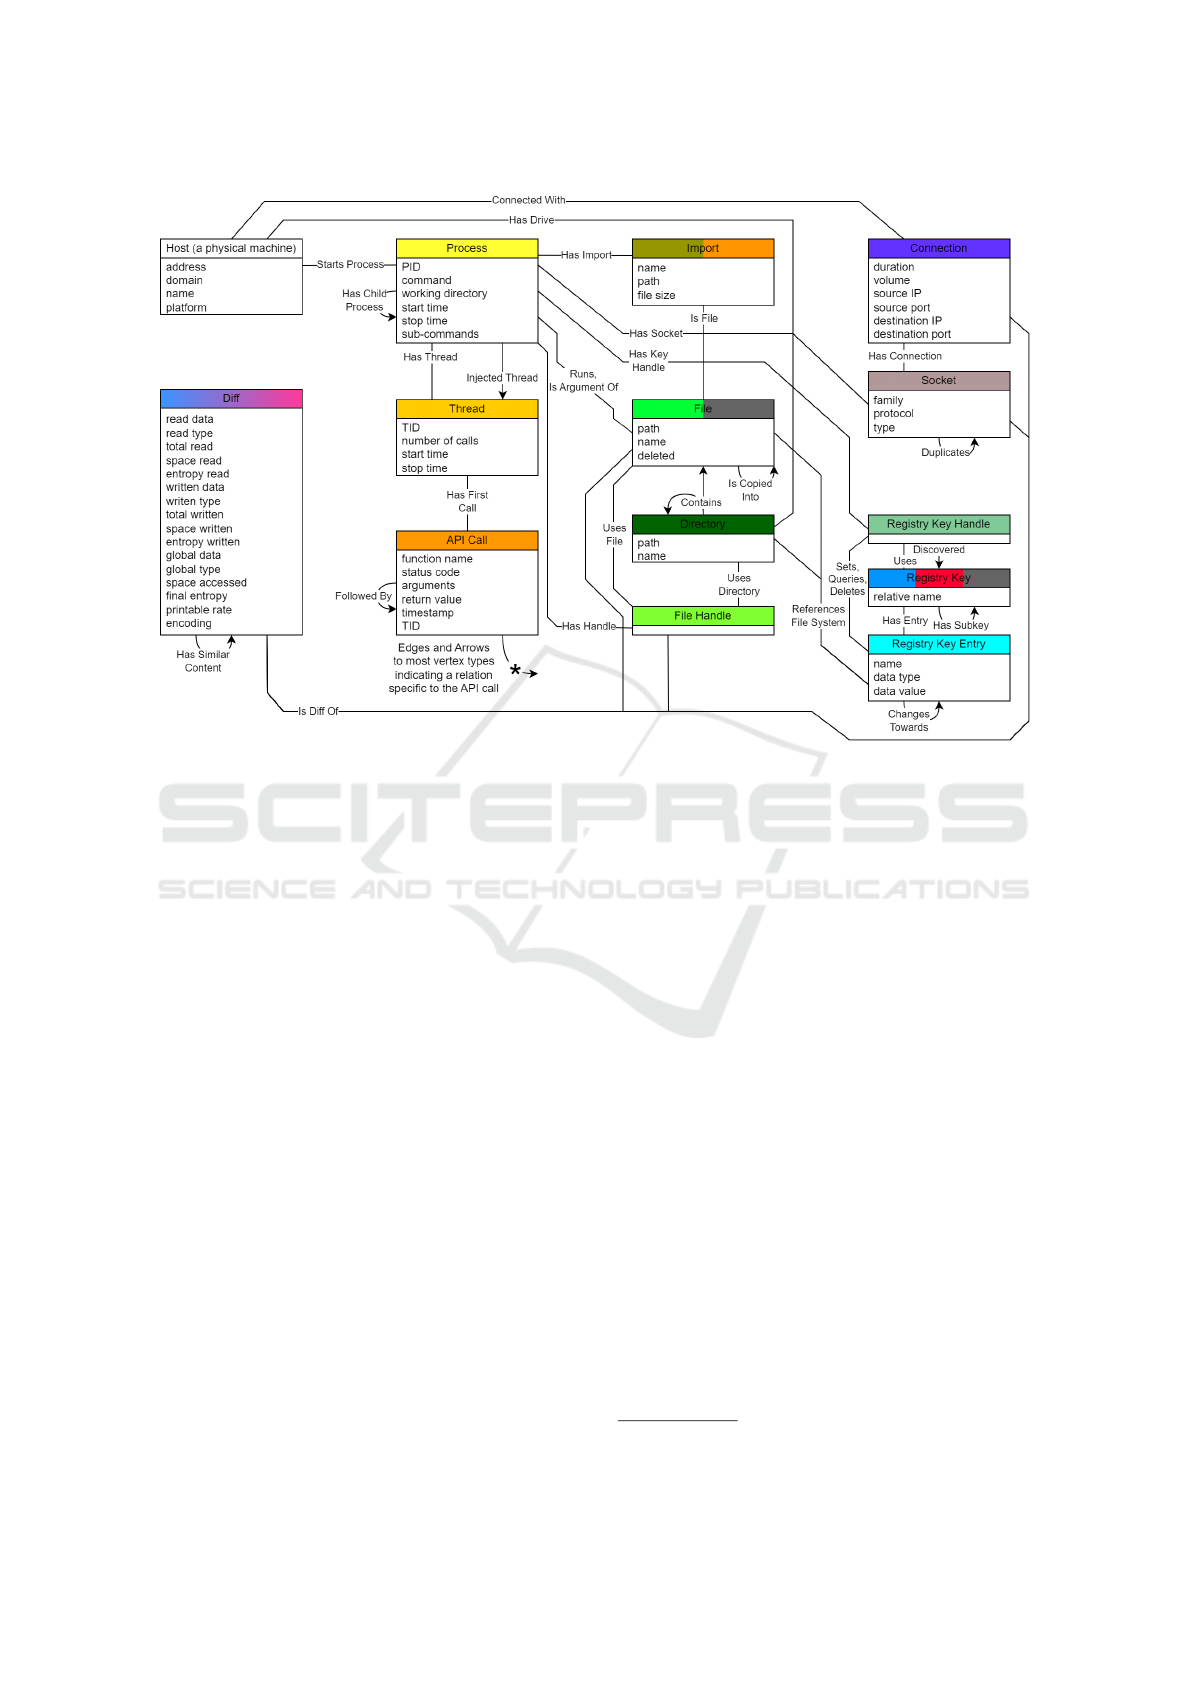
Figure 1: Structure of BAGUETTE graph.
be linked by Connection nodes, and their even-
tual conversation might be accessible through Socket
nodes.
Windows registry activity is represented by Key,
Key Entry and Key Handle nodes. Similarly to the
file system, the registry tree used by the sample will
be present in the BAGUETTE graphs, featuring all
operations made on the keys and entries.
Diff nodes trace the data flows across the execu-
tion. They represent data the was captured through
any data-capable object and are compared to each
other using a similarity metric.
Finally, Import nodes correspond to DLL imports.
All of these categories also have edges and arrow
types, which relate the different types of vertices (po-
tentially from different categories).
3.2 BAGUETTE Graph Construction
A BAGUETTE graph is built in 3 steps.
Step 1: Host, Process, Thread and API Call Nodes.
The host node of the VM is first created. Then, one
node is created for each process, thread and API calls,
and they are linked with the according edge and arrow
types according to the BAGUETTE scheme defined in
Figure 1.
Step 2: File, File Handle, Socket, Connection, Reg-
istry Key, Registry Key Handle, Registry Key En-
try, and Import Nodes. In this step, each API call
is processed chronologically. For example, each time
a file handle is used by an API call, we search the
corresponding Handle nodes (it is created if it does
not exist) and we connect the API Call nodes to the
File Handle nodes. Registry Key, Registry Key En-
try, Registry Key Handle, Sockets and Imports nodes
are created and connected to API call with the ade-
quate edge type 1 similarly. Besides multiple special
case handling happen. For example, edges ”Injected
Thread” can be added between a process and a for-
eign thread if a CreateRemoteThread call (or similar)
is encountered or when an API call references directly
a file path without using a file handle (e.g., CopyFile),
a File node is created.
Step 3: Diff and Directory Nodes and Other Refin-
ing For each File node, Directory nodes are created
in a tree structure to place the file in their relative po-
sitions in the file system. Besides, the Diff nodes are
compared to each other using a similarity metric or
might be merged if they have identical data. If the
name of a File or a Directory is mentioned in a Reg-
istry Key Entry’s value, an edge labeled ”References
File System” is added.
BAGUETTE is available here
3
.
3
https://pypi.org/project/baguette-verse/0.9/
SECRYPT 2023 - 20th International Conference on Security and Cryptography
420

4 IDENTIFYING BEHAVIORS
WITH METAGRAPHS
A limitation of dynamic analysis is that malware sam-
ples may not execute their malicious payloads during
the analysis period. There could be multiple causes,
e.g. dead C&C server, incompatibility crash, wait-
ing for a specific date, or evasion techniques (VM en-
vironment or Cuckoo agent detection, sleep for the
duration of the analysis, etc.). For this reason, for a
given malware family, we run many of its variants.
As a result, our dynamic analysis produces a large set
of malware execution traces. Only a fraction of them
correspond to observable malicious payloads.
To facilitate tagging the potentially interesting
traces, we propose to search for subgraphs of the
BAGUETTE graphs that correspond to particular
behaviors probably related to malicious actions.
These graph patterns denoting specific behaviours and
shared in different BAGUETTE subgraphs are typi-
cally referred to as metagraphs (Fang et al., 2021).
A metagraph is a type graph that complies with the
BAGUETTE scheme (cf. Fig. 1), which can also
have partially defined attributes (i.e., associated with
a range of values). We define a match of a meta-
graph pattern in a BAGUETTE graph as finding a sub-
graph with the same structure and compatible node at-
tributes as the metagraph pattern. Subgraph matching
is an NP-complete problem. We use some heuristic
rules to narrow down the graph exploration. In par-
ticular, we prioritize the search by starting with nodes
for which the types are the rarest. Note that we search
for all possibly matching subgraphs in a BAGUETTE
graph given one specific metagraph pattern.
4.1 Metagraph Examples
We propose 5 metagraphs. Each one shows a par-
ticular behavior that could exist in our BAGUETTE
graphs, which correspond to suspiciously malicious
payloads.
The (a) ”High-Entropy Writing” metagraph rep-
resents the writing of high entropy bytes to a file.
It likely belongs to the payloads of data encryption.
This behaviour is encoded as a File node connected
with a Diff node, where the Diff node writes high-
entropy contents into the corresponding file.
The (b) ”Changed File Type” metagraph denotes
the action of reading a file’s contents and changing the
file type associated with the file content. This behav-
ior pattern is encoded by a File node connected to a
Diff node with the type of the read data different from
the type of the written data. This behavior can be an
indicator to masquerading
4
.
The (c) ”Covert Execution” metagraph repre-
sents the behavior of executing a file that is not sup-
posed to be executable. This is encoded by searching
for a Process node that executes a file with an exten-
sion beyond typical Windows executable file types,
including ”.exe” (PE Executable), ”.vbs” (Visual Ba-
sic Script) and ”.ps1” (Powershell script) . This tech-
nique can also be used for masquerading.
The (d) ”Extraction and Execution” metagraph
represents a process writing to a file first, and then
executing it in a child process. This is encoded as
two Process nodes. One process is the parent of the
other. The parent process uses a handle on the exe-
cuted file. There is also a Diff node connected to the
Handle node. The Diff node indicates only writing
operations are performed on the file via this Process’s
Handle. Finally the same file is executed by the child
process.
The (e) ”Auto-Run” metagraph represents the be-
havior that a program changes/creates a key value
in the run keys, in order to launch automatically the
specified applications during startup of the system or
user login (Auto-Run/Logon-Run). The added key
value refers to a file that will be executed or used as a
parameter in a new process created at the next system
startup. To match the exact keys, the metagraph must
contain the complete Key hierarchy (constrained by
their ”name” attributes). At the end, there is a mod-
ified Key Entry linked to the Key Handle used to set
the Key Entry (the type of the link is Set Entry) and
the file referred by the value of the entry.
4.2 Experiment
We created a dataset of BAGUETTE graphs defined
using the Cuckoo reports of malware samples of three
families collected from MalwareBazaar: 247 sam-
ples of GCleaner, 436 samples of SnakeKeyLogger
and 7 samples of LockBit. GCleaner
5
is a file drop-
per, SnakeKeyLogger
6
is a key logger and spyware,
and LockBit
7
is a ransomware. Their BAGUETTE
graphs are available in our repository
8
and can be vi-
sualized using Gephi
9
. We searched for metagraphs
inside these BAGUETTE graphs and we counted the
number of matches for each metagraph. The results
are presented in Table 1. p represents the fraction
4
https://attack.mitre.org/techniques/T1036/
5
https://bazaar.abuse.ch/browse/signature/GCleaner/
6
https://bazaar.abuse.ch/browse/signature/
SnakeKeylogger/
7
https://bazaar.abuse.ch/browse/signature/LockBit/
8
https://files.inria.fr/baguette/SECRYPT 2023.zip
9
https://gephi.org/
BAGUETTE: Hunting for Evidence of Malicious Behavior in Dynamic Analysis Reports
421

of samples belonging to one family, which contain at
least 1 match to the given metagraph pattern. n (resp.
σ) is the average number (resp. standard deviation) of
matches per sample with at least one match.
From the results, we can find that every metagraph
pattern can be matched with at least one BAGUETTE
graph. It implies that these patterns may indicate im-
portant payloads in these malware samples. Further-
more, the distribution of metagraph patterns varies
significantly across malware families. This shows that
different metagraph patterns can be considered as be-
havioral signatures of malware family.
In the columns of GCleaner, we can see that all
metagraph patterns except ”Auto-Run” can find the
matched subgraphs. Furthermore, the very low vari-
ance of the number of matches per sample tell us that
we identified characteristic behaviors of this family.
For example, each of the GCleaner samples contain
on average 3 matches of the ”Extraction and Execu-
tion” metagraph pattern.
For SnakeKeyLogger, there are much fewer
matches. Indeed, 326 out of the 436 SnakeKey-
Logger samples are not executed properly and their
BAGUETTE graphs are almost empty. These sam-
ples may deploy evading techniques to avoid sandbox
analysis. However, our current metagraph patterns are
not designed to capture these evasive behaviours.
In the case of LockBit, 2 of the 7 samples ran
properly. The other 5 samples may have had evasive
behaviors. These 2 samples contribute matches for
the metagraphs ”High Entropy Writing” and ”Extrac-
tion and Execution”. These numbers show that meta-
graphs can help the experts quickly identify traces
with interesting behavior. Interestingly, we can find
on average 2450 matches of the ”High Entropy Writ-
ing” metagraph pattern in the 2 samples. This can
be a strong indicator that these samples executed ran-
somware payloads encrypting many files. The low
number of ”High Entropy Writing” matches for the
other families probably indicates false positives.
Let us point out that malware family may demon-
strate multiple metagraph patterns simultaneously.
This echoes the difficulty of accurately classifying
malware families in practice, as the different fami-
lies may adopt similar attack techniques. The sam-
ples of GCleaner and LockBit are easier to tag, as
they demonstrate on average significantly more ”Ex-
traction and Execution” and ”High Entropy Writing”
patterns respectively than the other family.
Remark that, in some of the samples of SnakeKey-
Logger and LockBit, we fail to find matches to some
metagraph patterns. It is possible that these patterns
are not enough to capture possible malicious pay-
loads in these samples, for example capturing the
evading behaviours. The results imply the necessity
of enriching the metagraph patterns while exploring
BAGUETTE graphs.
The ”Auto-Run” metagraph is the least matched
pattern across these families. The reason is ”Auto-
Run” is more complex than the other metagraph pat-
terns. It contains more nodes / links inside and there-
fore exactly matching ”Auto-Run” in BAGUETTE
graphs poses more constraints than the simpler meta-
graphs. On the other hand, ”Auto-Run” metagraph
can convey more accurate description of the be-
haviour than the other patterns. It raises a trade-off
between the flexibility and complexity of metagraph
patterns as more accurate (less flexible) descriptions
of payloads require more complex structures of meta-
graphs but could raise less false positives.
5 USE CASE STUDY WITH
BAGUETTE VISUALIZATION
We demonstrate how to use BAGUETTE graphs for
visualization for investigating dynamic analysis re-
ports.
5.1 Graph Pruning for Visualization
In the previous subsection, we used metagraphs
to identify suspicious behaviours. However,
BAGUETTE graphs can be very large (on average
10,000 nodes and 15,000 directed edges in our use
case study), making manual graph exploration diffi-
cult. We thus introduce a pruning method of the raw
BAGUETTE graphs for better visualizing the traces.
We remove Import nodes not connected to a File
node. We only keep the File Handle nodes, with the
corresponding File nodes connected to a Process node
via a ”Runs” or a ”Is Argument Of” edge (i.e. when
the process’s command line references that file). We
only keep the Thread nodes that are started remotely
(i.e., with an Injected Thread edge). Remotely started
threads are typically used by malware for evasion or
privilege escalation
10
. Process nodes that are only
linked to their parent processes are removed.
We keep the Registry Keys and Registry Key En-
tries that are modified, removed or created by a pro-
cess. We keep API Call nodes that are linked to other
types of nodes, which indicate they might be more
significant.
Besides, we highlight important nodes with big-
ger sizes and use different color to denote different
types of nodes. The color of each node type is given
10
https://attack.mitre.org/techniques/T1055/
SECRYPT 2023 - 20th International Conference on Security and Cryptography
422
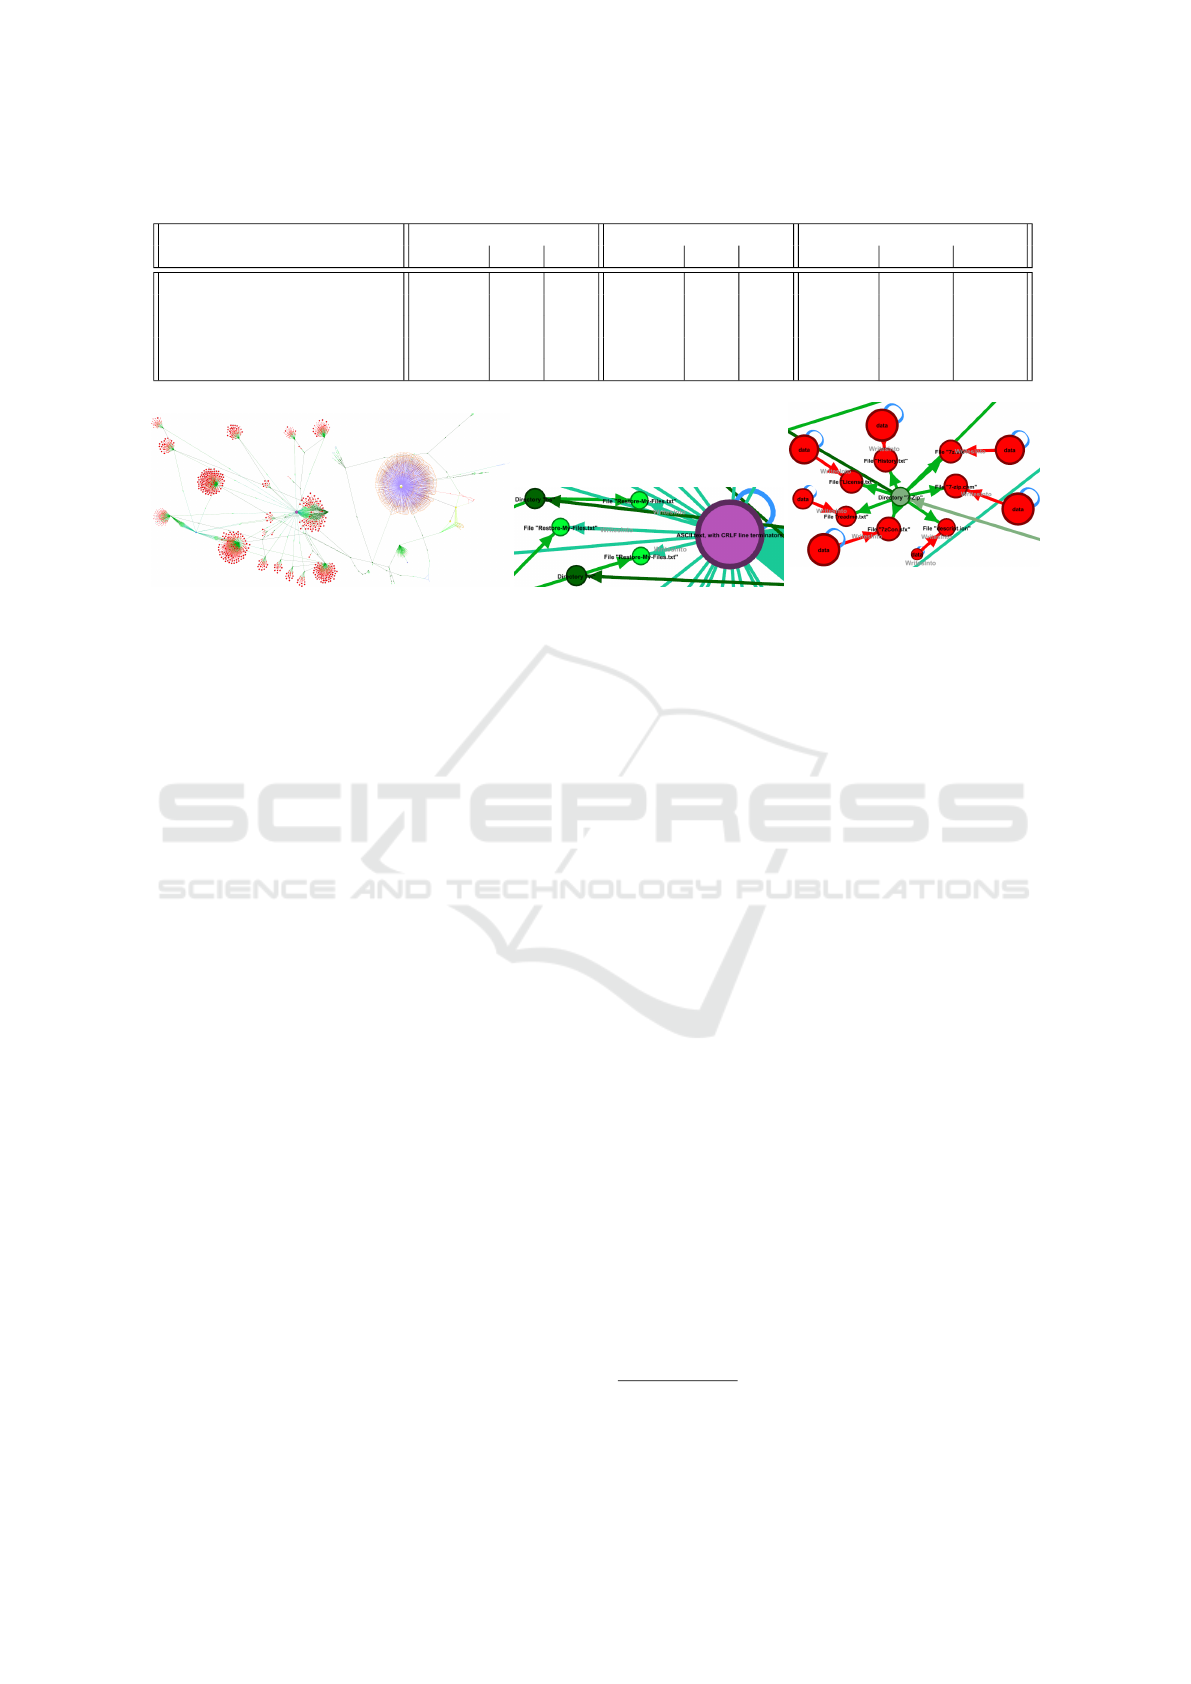
Table 1: Statistics extracted for malware samples for three families of malware.
Metagraph GCleaner SnakeKeyLogger LockBit
p n σ p n σ p n σ
(a) High-Entropy Writing 97.57% 1.53 0.59 13.53% 1.08 0.28 28.57% 2450.0 1878.0
(b) Changed File Type 97.57% 1.0 0.0 4.59% 1.05 0.22 14.29% 1.0 0.0
(c) Covert Execution 98.38% 1.0 0.0 0% - - 0% - -
(d) Extraction and Execution 98.38% 2.97 0.17 13.53% 1.0 0.0 0% - -
(e) Auto-Run 0% - - 0% - - 28.57% 1.0 0.0
(a) Overview of the graph. (b) Ransom dropping behavior.
(c) File system encryption behav-
ior.
Figure 2: BAGUETTE graph of LockBit.
in Figure 1. The size and the color of a node can vary
according to its content. Diff nodes are bigger when
they contain larger buffers. Also, Diff node color has
a gradient from blue (small entropy of ”global data”)
to purple (high entropy of ”global data”) File nodes
are green when the files still exist at the end of the
analysis and grey when they have been deleted Reg-
istry Key and Registry Key Entry nodes also turn to
grey when they are deleted. Furthermore, Registry
Key nodes change to red when their names contain
UTF-16 values that are not mapped to any character
or symbol. The width of the edges ”Has Similar Con-
tent” depends on the similarity (narrower edges for
smaller similarity, thicker edges for higher similarity).
Finally, when a match was found for a metagraph
in a given BAGUETTE graph, we color the matching
vertices, edges and arrows in red.
5.2 LockBit (Ransomware) Analysis
LockBit is a ransomware family that appeared in
2019. Its BAGUETTE graph can be seen in Figure 2a.
Its pruned graph is still larger than average, prob-
ably because it has much more interactions with the
system. Four different types of nodes groups can be
identified: first, a purple and yellow circle on the
right, indicating network activity. Second, a purple
node in the middle linked to many other nodes, indi-
cating that the same data was found in many file I/O
operations. Then, the group of dynamic dll import
at the bottom right. Last, multiple green and red ar-
eas indicating high entropy contents written to many
files. These subgraphs matched the (a) High-Entropy
Writing behaviour.
Figure 2c zooms out one of these green and red
groups where 7 (a) metagraphs can be found. We can
see that file contents of high entropy are written into
many files inside the ”7-Zip” directory. In fact, this
behavior can be seen in many other directories (”Au-
dacity”, ”Inkscape”, etc.). Upon inspection, we find
an average entropy of about 6.2 bits per byte. Pro-
ducing file contents with such a high entropy implies
of encryption or compression of files. Furthermore,
the type of the written files is tagged as ”data” by lib-
magic, which indicates that it may be not compressed
/ packed with any well-known off-the-shelf compres-
sion algorithms. An assumption is that the malware
sample encrypted these files. Note that we cannot see
the writing operation as the sample uses asynchronous
reading
11
, which is not handled by Cuckoo, and thus
absent from the reports.
To confirm this hypothesis, Figure 2b shows a
single Diff node was linked to many File nodes.
By checking the Diff node, we find this node only
contains writing operations and the bytes written into
the connected File nodes named with ”Restore-My-
Files.txt” are exactly the same. Upon inspection, the
Diff node shows the file content is ASCII text. The
files ”Restore-My-Files.txt” were created in many
different directories, which confirms that this is a
ransom message to the victim. More specifically,
the writing buffer of the Diff node contains the text
"LockBit 2.0 Ransomware. Your data are
stolen and encrypted. The data will be
11
A call to ”NtSetInformationFile” with the parame-
ter ”FileCompletionInformation” indicates undocumented
AsyncIO operations
BAGUETTE: Hunting for Evidence of Malicious Behavior in Dynamic Analysis Reports
423

published on TOR website [...]". We cannot
observe data exfiltration, as it was done with low-
level methods, e.g. using special I/O API calls with
undocumented flags. Instead, we can only observe
sockets binding to all the opened interfaces without
sending anything.
All of these examples of BAGUETTE graphs
show that: 1) A global view of the dynamic traces
in the BAGUETTE graph help human analysts to
quickly focus on possibly interesting behaviours. 2)
Zooming the graph and unveiling detailed informa-
tion allows human analysts to conduct deeper investi-
gation into specific payloads and help producing ex-
planations for the malware sample’s behaviour.
6 CONCLUSION
Malware analysis consists of understanding the ob-
jective of a malware, and its various attack, pro-
tection, and evasion techniques. BAGUETTE is a
post-processing of the dynamic analysis report pro-
duced by Cuckoo sandbox relying on a heterogeneous
graph. Based on this representation, it is easy to spec-
ify metagraphs that describe suspicious behaviours
and to use them to filter a database of analysis re-
ports to highlight malware displaying a given suspi-
cious and precise behaviors. Finally, experts can use
BAGUETTE graphs to manually analyze the interac-
tion between the malware and the host and quickly
discover and verify hypotheses. In the future, we
will use metagraphs to identify clusters of malware
exhibiting partially similar behaviors and qualify un-
known malware by recognizing partially known be-
haviors through metagraphs. We will also try to create
an algorithm to learn significant metagraphs to sepa-
rate datasets of BAGUETTEs.
REFERENCES
Alptekin, H., Yildizli, C., Savas, E., and Levi, A. (2019).
TRAPDROID: Bare-Metal Android Malware Behav-
ior Analysis Framework. In 2019 21st International
Conference on Advanced Communication Technol-
ogy (ICACT), pages 664–671, PyeongChang Kwang-
woon Do, Korea (South). IEEE.
Bridges, R., Hern
´
andez Jim
´
enez, J., Nichols, J., Goseva-
Popstojanova, K., and Prowell, S. (2018). Towards
Malware Detection via CPU Power Consumption:
Data Collection Design and Analytics. In 2018
17th IEEE International Conference On Trust, Secu-
rity And Privacy In Computing And Communications/
12th IEEE International Conference On Big Data Sci-
ence And Engineering (TrustCom/BigDataSE), pages
1680–1684. ISSN: 2324-9013.
Chen, Z.-G., Kang, H.-S., Yin, S.-N., and Kim, S.-R.
(2017). Automatic Ransomware Detection and Analy-
sis Based on Dynamic API Calls Flow Graph. In Pro-
ceedings of the International Conference on Research
in Adaptive and Convergent Systems, pages 196–201,
Krakow Poland. ACM.
Ding, Y., Xia, X., Chen, S., and Li, Y. (2018). A malware
detection method based on family behavior graph.
Computers & Security, 73:73–86.
Fang, Y., Lin, W., Zheng, V. W., Wu, M., Shi, J., Chang, K.
C.-C., and Li, X.-L. (2021). Metagraph-Based Learn-
ing on Heterogeneous Graphs. IEEE Transactions on
Knowledge and Data Engineering, 33(1):154–168.
Grimmer, M., R
¨
ohling, M. M., Kricke, M., Franczyk, B.,
and Rahm, E. (2018). Intrusion detection on system
call graphs. Sicherheit in vernetzten Systemen, pages
G1–G18.
Kolosnjaji, B., Zarras, A., Webster, G., and Eckert, C.
(2016). Deep Learning for Classification of Malware
System Call Sequences. In Kang, B. H. and Bai, Q.,
editors, AI 2016: Advances in Artificial Intelligence,
volume 9992, pages 137–149. Springer International
Publishing, Cham. Series Title: Lecture Notes in
Computer Science.
Park, Y., Reeves, D., Mulukutla, V., and Sundaravel, B.
(2010). Fast malware classification by automated be-
havioral graph matching. In Proceedings of the Sixth
Annual Workshop on Cyber Security and Informa-
tion Intelligence Research - CSIIRW ’10, page 1, Oak
Ridge, Tennessee. ACM Press.
Piplai, A., Mittal, S., Abdelsalam, M., Gupta, M., Joshi, A.,
and Finin, T. (2020). Knowledge Enrichment by Fus-
ing Representations for Malware Threat Intelligence
and Behavior. In 2020 IEEE International Conference
on Intelligence and Security Informatics (ISI), pages
1–6.
Qiang, W., Yang, L., and Jin, H. (2022). Efficient and
Robust Malware Detection Based on Control Flow
Traces Using Deep Neural Networks. Computers &
Security, 122:102871.
Raff, E. and Nicholas, C. (2020). A Survey of Machine
Learning Methods and Challenges for Windows Mal-
ware Classification. NeurIPS 2020 Workshop: ML
Retrospectives, Surveys & Meta-Analyses (ML-RSA).
Sihwail, R., Omar, K., and Zainol Ariffin, K. A. (2018). A
Survey on Malware Analysis Techniques: Static, Dy-
namic, Hybrid and Memory Analysis. International
Journal on Advanced Science, Engineering and Infor-
mation Technology, 8(4-2):1662.
Wang, S., Chen, Z., Yu, X., Li, D., Ni, J., Tang, L.-A.,
Gui, J., Li, Z., Chen, H., and Yu, P. S. (2019). Het-
erogeneous Graph Matching Networks for Unknown
Malware Detection. In Proceedings of the Twenty-
Eighth International Joint Conference on Artificial In-
telligence, pages 3762–3770, Macao, China. Interna-
tional Joint Conferences on Artificial Intelligence Or-
ganization.
Wunderlich, S., Ring, M., Landes, D., and Hotho, A.
(2020). Comparison of System Call Representations
for Intrusion Detection. Springer, Cham, 951:14–24.
Xiao, F., Lin, Z., Sun, Y., and Ma, Y. (2019). Malware De-
tection Based on Deep Learning of Behavior Graphs.
Mathematical Problems in Engineering, 2019:1–10.
SECRYPT 2023 - 20th International Conference on Security and Cryptography
424
