
A Data Analysis Pipeline for Automating Apple Trait Analysis and
Prediction
Kyle Ranslam and Ramon Lawrence
University of British Columbia, Kelowna, BC, Canada
Keywords:
Database Integration, Deep Learning, Object Detection, Fruit, Apple.
Abstract:
Feeding the world’s growing population requires research and development of fruit varieties that can be sus-
tainably grown with high yields and quality and require low inputs of water and fertilizer. The process of
developing new fruit varieties is data-intensive and traditionally uses manual processes that do not scale. The
contribution of this work is a data analysis pipeline that automates the extraction of fruit characteristics from
images and integrates multiple data sources (images, field measurements, human evaluation) to help direct the
research to the most promising candidates and reduce the amount of manual time required for data collection
and analysis. Initial results demonstrate that the image analysis is accurate and can be done at scale in a real-
world environment.
1 INTRODUCTION
Ensuring sufficient food for a growing world popu-
lation and supporting sustainable agriculture begins
with the development of plant varieties that maximize
yields and quality while minimizing inputs of water
and fertilizer. Developing new varieties is a long-term
research effort, especially for tree fruits such as apples
and cherries where it may take decades to develop
new commercial varieties. The research process in-
volves selecting promising cultivars for combination,
planting multiple instances of each combination, and
monitoring the trees over many years to determine
fruit quality, yield, and disease resistance. Due to
the long timelines and infinite possibilities, automat-
ing the process of analysis and predicting promising
cultivars is extremely important.
The research activities result in the collection of
multiple distinct data sets ranging from imaging data,
fruit measurements, and subjective evaluations of ap-
pearance, colour and taste for a large number of
samples. This work describes the implementation
and evaluation of a data analysis pipeline for ap-
ple breeding developed for the Agriculture and Agri-
Food Canada (AAFC) research centre in Summer-
land, BC, Canada. AAFC Summerland (Government
of Canada, 2023) has developed the majority of the
cherry varieties in commercial production and several
apple varieties.
A time-intensive manual process is measuring the
fruit traits (size, colour, shape) for a large number of
samples. A key focus in the automation was using
deep learning to automate trait extraction from images
and populate them into the database. Automation is
especially important for trait extraction as these pro-
cesses are slow, expensive, and subject to evaluators’
bias and fatigue. Using deep learning image analysis
techniques can improve image processing efficiency,
and applying data integration and fusion can produce
an integrated view of the data allowing for improved
prediction and planning.
The contributions of this work are:
• An automated data analysis pipeline containing
deep learning image processing for fruit trait ex-
traction.
• Database integration of multiple diverse data sets
including image data, field measurements, and
multi-stage user evaluation to produce an inte-
grated database system.
This is a position paper describing work in
progress including implementation and experimenta-
tion to date. The paper outline is as follows. Section 2
discusses current techniques used for fruit detection in
images and prior work on data-driven analysis. The
dataset, model training, and model construction for
the image analysis are described in Section 3. Sec-
tion 4 overviews the overall data pipeline and data
integration system combining multiple data sources.
Preliminary results are in Section 5. The paper closes
with future work and conclusions.
Ranslam, K. and Lawrence, R.
A Data Analysis Pipeline for Automating Apple Trait Analysis and Prediction.
DOI: 10.5220/0012088300003541
In Proceedings of the 12th International Conference on Data Science, Technology and Applications (DATA 2023), pages 375-380
ISBN: 978-989-758-664-4; ISSN: 2184-285X
Copyright
c
2023 by SCITEPRESS – Science and Technology Publications, Lda. Under CC license (CC BY-NC-ND 4.0)
375

2 BACKGROUND
Tree fruit breeding (Science Learning Hub, 2023) de-
velops crosses (hybridizations) using distinct geno-
types, followed by several stages of evaluation of the
germplasm for numerous traits over multiple years
and locations before the commercialization of a new
cultivar. Germplasm is a piece of live plant tissue
from which a new plant can be grown and is a com-
mon method used for crop propagation. Due to the
long juvenile period and perennial nature of trees, this
process can take more than 20 years. The resources
and time required for evaluation of the germplasm for
various traits is a major bottleneck in this process.
Apple breeding research facilities have a large
amount of fruit bearing trees, each requiring fruit
analysis. Traditionally, most of the traits are mea-
sured manually, which involves tedious and repetitive
tasks such as counting fruits, size measurement, and
colour classification. The assessment of these traits
is referred to as phenotyping. The phenotyping pro-
cess requires several fruits of the same genotype to
be measured and the resulting measurements are aver-
aged to determine the characteristics of the genotype.
The tree fruit germplasm evaluation process is vul-
nerable to worker fatigue and subjectivity, resulting
in errors and inconsistencies in the collection of fruit
trait data in addition to its time consuming process.
Image analysis and artificial intelligence may au-
tomate these manual tasks, improving efficiency and
increasing the probability of developing fruits with
enhanced traits. Object detection approaches (Aslam
et al., 2020) identify known objects and their locations
and categorizes them into classes.
Prior work on using object detection for agricul-
ture applications include the use of convolutional neu-
ral networks (He et al., 2016) for plant classifica-
tion (Mahmudul Hassan and Kumar Maji, 2021; T
´
oth
and Papp, 2016) and machine learning with deep neu-
ral networks for general fruit classification using Effi-
cientNet (Duong et al., 2020). Prior research demon-
strated (Ukwuoma et al., 2022a) that deep neural net-
works offer superior prediction abilities but the in-
creased performance comes with higher computation
cost.
Detection, classification and mapping systems
have been developed for coffee assessment on
branch (Ramos et al., 2017) and during har-
vest (Bazame et al., 2021). Previous work has exam-
ined the assessment of fruit on trees for improvements
on harvesting (Villacr
´
es and Auat Cheein, 2020). Us-
ing You Only Look Once (YOLO) (Redmon et al.,
2016) for cherry detection and trait measurement was
presented in (Nagpal et al., 2021). (Ukwuoma et al.,
2022b) surveys existing fruit detection and classifica-
tion approaches with a focus on deep learning models.
The prior approaches are shown to have good accu-
racy on the fruit detection task, but fruit classification,
especially within a given fruit type, is difficult.
One popular classification problem in agriculture
is fruit grading. Fruit grading is a process that deter-
mines the quality of a fruit, which can be simplified
to two categories: healthy or diseased. (Raja Sekar
et al., 2018) and (Dubey and Jalal, 2015) both pro-
vide a comprehensive overview of image processing
and classification techniques that have been published
for fruits. The approaches for fruit grading range from
using fuzzy logic to more modern machine learning
techniques like SVM classifiers.
A common step in preprocessing for these pa-
pers include segmentation to find and isolate the ob-
jects of interest in an image. The segmentation tech-
niques vary from K-means clustering (Dubey and
Jalal, 2015) to BLOB Analysis (Yusuf et al., 2018).
Ismail et al. used different segmentation techniques
for training and testing their deep learning network
for fruit grading (Ismail and Malik, 2022).
This paper utilizes Mask R-CNN (He et al., 2017),
a popular tool for instance segmentation to generate
the binary masks for each of the apples in the im-
age. Instance segmentation identifies each individual
instance of an object and their location. Instance seg-
mentation also labels the pixels belonging to each ob-
ject instance that is output in a binary mask.
Prior work on image processing for fruits did
not focus on the key trait data required for this re-
search. General fruit classification approaches (Ab-
dullah et al., 2023) identify that the image contains
an apple (as compared to other fruits and vegetables).
Fruit grading techniques (Li et al., 2021) classify fruit
based on quality and may not require detailed analysis
of key traits such as size, colour patterns, and shape
needed for fruit breeding research. There has been no
published work on integrating image analysis into a
data pipeline to support research generating new fruit
varieties.
The challenges in data and schema integra-
tion (Batini et al., 1986; Parent and Spaccapietra,
1998; Lenzerini, 2002) combining data from multiple
sources are well-known. Although semi-automatic
schema matching and merging approaches (Rahm and
Bernstein, 2001) automate some of the process, in
practice human design efforts are still required to
build a merged schema and answer integrated queries.
Due to the specialized and commercially competitive
nature of tree fruit breeding, there has been no prior
work detailing how the diverse data sets produced
during the research process can be integrated for anal-
DATA 2023 - 12th International Conference on Data Science, Technology and Applications
376

ysis. The diversity of the data (images, field measure-
ments, human evaluations) over a long time period
presents unique challenges in building an integrated
database. The potential impact of the multi-source
data fusion is enormous as predicting the best poten-
tial candidates for exploration is still highly manual
and based on researcher knowledge.
3 TRAIT EXTRACTION USING
IMAGE ANALYSIS
A key component of the data analysis pipeline is the
automated analysis of fruit traits from images. AAFC
collects images of the apples of each cultivar annu-
ally. An example image is shown in Figure 2. The
fruits are shown in 6 orientations including top, bot-
tom, sides, and cut top-to-bottom and cut in half. As
the researchers are performing large-scale measure-
ments, the images have a general format including the
standardized apple orientations and a consistent back-
ground. The images are taken using a high-quality
camera with consistent lighting. A white balance card
is included in the images as well as a ruler for size
measurement. Each season hundreds of photos are
taken for analysis. Although there are variations in
images over the years, the images have more regular
structure than is typical in general image classification
problems.
Traits extracted from these images include size,
shape, and overcolour. Overcolour is used to describe
the red colouration of apples. There are four types of
colouring that are identified: dark red overcolour, red
overcolour, yellow overcolour and background colour
(see Figure 1). Colouring is especially important for
consumers, so growers expect fruits to have a consis-
tent colour range.
3.1 Machine Learning Model
A deep learning model using Mask R-CNN (He et al.,
2017) was trained using 50 labeled images from the
sample data set of 300 images. Ground truth was pro-
vided by manually annotating the images. The model
was trained to detect the apple locations and the white
balance card.
The model was used first to identify apples and
produce masks of pixels. These masks in combination
with the ruler are used to determine sizes of the apples
(see Figure 3).
The model identified the location of the white bal-
ance card that would often appear in different loca-
tions in the images. The white and black pixels in the
white balance card were used to perform white bal-
ancing before the colour analysis.
The colour analysis used RGB colour ranges to
identify red overcolouring in the apples. Figure 4
shows identification of particular red colour ranges
and percentages in the apples.
After image analysis is complete, for each apple
image the size and colour statistics are computed and
stored in the database.
4 ANALYSIS PIPELINE
The data collected varies substantially in format and
time with data collection occurring over many years.
A summary of the data collected and timelines is in
Table 1. Field observations occur throughout the sea-
son with particular emphasis in August and Septem-
ber before harvest. Researchers walk daily through
the orchard observing and recording trees and captur-
ing information on flower density and fruit size and
yield. Although there are discussions about creat-
ing a mobile app to simplify data input, the major-
ity of this data is collected on paper and recorded
in spreadsheets. The pipeline allows importing data
from spreadsheets into the database.
The majority of the data collection occurs at har-
vest where the trees are harvested for apples and the
number and weight of fruits determined. Exemplar
fruits are chosen for detailed measurement on colour,
weight, size, and firmness. It is at this point that pho-
tos of the fruits are taken, and the images are collected
and analyzed.
User panels combine researchers with expert eval-
uators to subjectively measure fruit traits. These pan-
els use survey software to collect measurements on
appearance, texture, and flavor that are combined for
aggregate scores.
The data analysis pipeline consists of multiple
stages that generate and integrate diverse data from
these multiple sources. An overview of the pipeline
is in Figure 5. A key challenge is the data collection
must occur for 10 to 20 years. This requires consis-
tency in data collection and cleaning techniques and
stability in the underlying software.
A fundamental data integration challenge is iden-
tifying related entities. This challenge is compounded
in the fruit breeding case as there are few natural keys
like names or identifiers, and auto-generated, surro-
gate keys still must ultimately relate to a physical tree.
To resolve this issue, trees are identified by physical
location in the orchard consisting of a field number,
row number, and tree number such as 1C-19-25 (field
1C, row 19, tree 25). A given tree may be derived
A Data Analysis Pipeline for Automating Apple Trait Analysis and Prediction
377
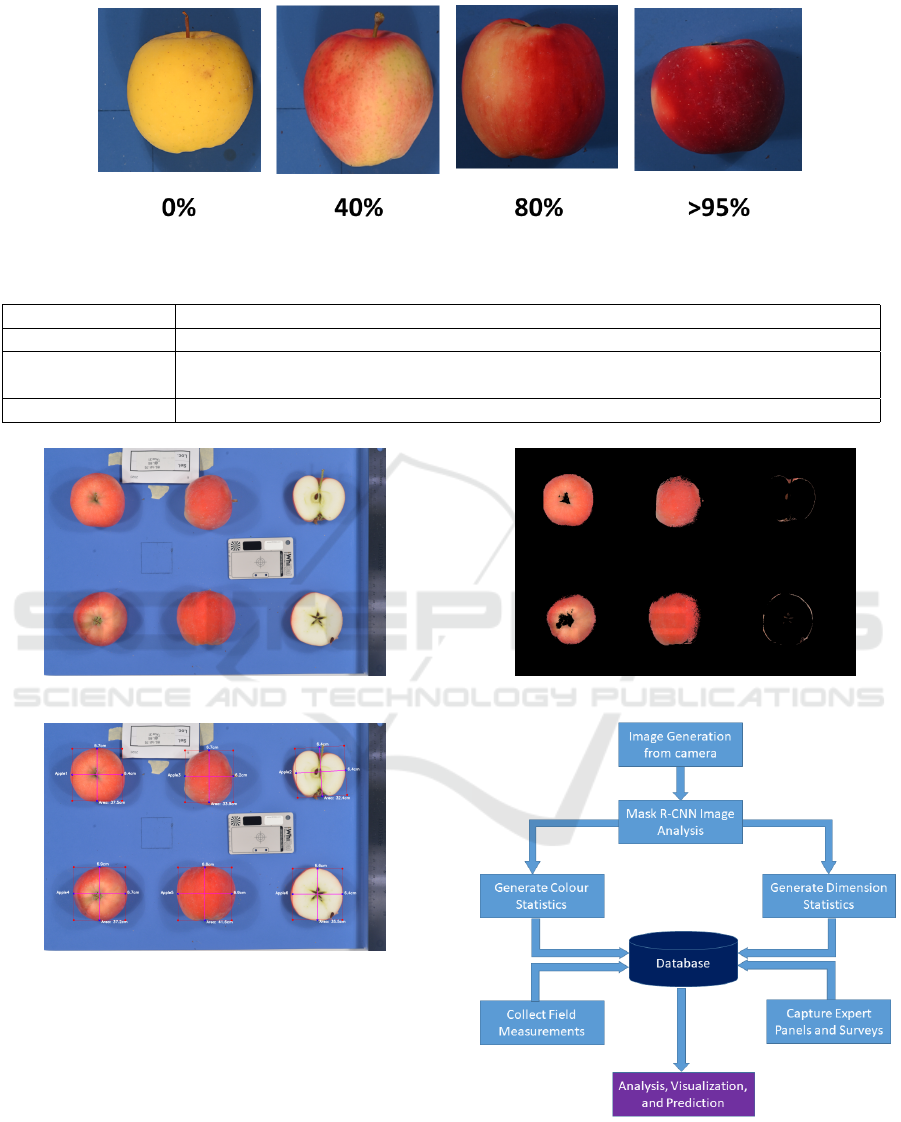
Figure 1: Example of Apple Red Overcolour.
Table 1: Data Collected for Analysis and Timelines.
Collection Period Data Collected
August-September Field Observations: trunk diameter, flower density, fruit size, fruit yield
September Harvest: number and weight of fruits on tree, firmness, starch index, colour, images
captured and analyzed
October-January User Panels: multiple user panels measuring appearance, texture, flavor, firmness
Figure 2: Apple Image.
Figure 3: Apple Identification and Sizes.
from other trees, which themselves are identified by
their original location in the research station such as
8C-24-55 (field 8C, row 24, tree 55). These identifiers
are required as a variety name is only chosen much
later in the process when there is a potential for com-
mercialization.
4.1 System Implementation
The pipeline is composed of separate Docker contain-
ers for each stage. The Mask R-CNN image analysis
Figure 4: Apple Colour Analysis.
Figure 5: Pipeline Overview.
stage monitors a directory for input files produced by
the camera setup. Once a file is detected, the image
analysis is performed identifying the apples and pro-
DATA 2023 - 12th International Conference on Data Science, Technology and Applications
378

ducing the pixel maps. These outputs are provided
to two separate analysis stages; one extracting the
colour statistics and the other generating the dimen-
sion statistics. The platform is generalizable allowing
any number of analysis stages for extracting particu-
lar statistics. All statistics are then inserted into the
database. The image files are stored in a file-based
repository outside of the database. The image anal-
ysis including the Mask R-CNN model and trait ex-
traction routines are written in Python.
Field data collected includes tree observations on
fruit quality, yield, size, and taste. These observations
were previously performed on paper and input into
Excel. The new pipeline allows direct entry of data
while in the field using a mobile device as well as
direct entry from researchers. Previous data in Excel
can be imported into the database.
Other data collected include judging panels that
consists of up to 7 people that subjectively rate fruits
based on taste, appearance, and quality. These ob-
servations are collected by a proprietary system. The
data can be extracted from the system for inclusion in
the database.
Overall, the integrated database allows for anal-
ysis across the diverse set of data items and a con-
sistent, historical record to perform data analysis and
prediction. The database used is PostgreSQL.
5 PRELIMINARY RESULTS
The image analysis accuracy is currently being eval-
uated over the test data set. The accuracy of the ap-
ple traits are within the tolerance of human evaluators
and can be computed in a few seconds. This allows
the image analysis to not be a bottleneck in the re-
search lab’s data collection pipeline. Positioning and
capturing the image is a much more time consuming
step than the image analysis. This is a significant sav-
ings over manual processes, and may save hundreds
of researcher hours on data collection and analysis.
The automated colour analysis and classification
of overcolouring allows for higher throughput anal-
ysis of apples and more precise measurements com-
pared to human evaluation.
Overall, the automated techniques allow for faster
processing and the potential to perform higher vol-
ume data analysis. This work has created a unique,
high-quality data set for image analysis and fruit trait
prediction. Important work in progress is the ability
to use the integrated data set to make predictions on
the tree crosses to investigate. Determining what trees
to breed is currently a manual process dependent on
researcher intuition and experience.
6 CONCLUSIONS
Automating the collection and analysis of tree fruit
research data offers the potential to reduce the time
and cost of generating new fruit varieties. This work
describes a data analysis pipeline for combining mul-
tiple data sources for analysis. A key component was
automated image analysis for fruit trait extraction.
The accuracy of the automated process is high and
allows for more image analysis than would be possi-
ble using manual techniques. This research applies to
many other fruit applications beyond apples, and can
be used by growers and environmental agencies.
Ongoing and future work includes expanding on
the integrated database to include new data sets and
using the integrated information for automated pre-
diction.
REFERENCES
Abdullah, A., Harjoko, A., and Mahmod, O. (2023). Clas-
sification of fruits based on shape and color using
combined nearest mean classifiers. Jurnal RESTI
(Rekayasa Sistem dan Teknologi Informasi), 7:51–57.
Aslam, A., Irtaza, A., and Nida, N. (2020). Object De-
tection and Localization in Natural Scenes Through
Single-Step and Two-Step Models. In 2020 Interna-
tional Conference on Emerging Trends in Smart Tech-
nologies (ICETST), pages 1–7.
Batini, C., Lenzerini, M., and Navathe, S. B. (1986).
A comparative analysis of methodologies for
database schema integration. ACM Comput. Surv.,
18(4):323–364.
Bazame, H. C., Molin, J. P., Althoff, D., and Martello, M.
(2021). Detection, Classification, and Mapping of
Coffee Fruits During Harvest with Computer Vision.
Computers and Electronics in Agriculture, 183.
Dubey, S. R. and Jalal, A. S. (2015). Fruit and vegetable
recognition by fusing colour and texture features of
the image using machine learning. International jour-
nal of applied pattern recognition, 2(2):160–181.
Duong, L. T., Nguyen, P. T., Di Sipio, C., and Di Ruscio, D.
(2020). Automated fruit recognition using Efficient-
Net and MixNet. Computers and Electronics in Agri-
culture, 171.
Government of Canada (2023). Summerland Research
and Development Centre. [Online] Available: https:
//profils-profiles.science.gc.ca/en/research-centre/
summerland-research-and-development-centre.
He, K., Gkioxari, G., Dollar, P., and Girshick, R. (2017).
Mask R-CNN. In Proceedings of the IEEE Interna-
tional Conference on Computer Vision (ICCV).
He, K., Zhang, X., Ren, S., and Sun, J. (2016). Deep Resid-
ual Learning for Image Recognition. In Proceedings
of the IEEE conference on Computer Vision and Pat-
tern Recognition, pages 770–778.
A Data Analysis Pipeline for Automating Apple Trait Analysis and Prediction
379

Ismail, N. and Malik, O. A. (2022). Real-time visual inspec-
tion system for grading fruits using computer vision
and deep learning techniques. Information Processing
in Agriculture, 9(1):24–37.
Lenzerini, M. (2002). Data integration: A theoretical per-
spective. In Proceedings of the Twenty-First ACM
SIGMOD-SIGACT-SIGART Symposium on Principles
of Database Systems, PODS ’02, page 233–246, New
York, NY, USA. Association for Computing Machin-
ery.
Li, Y., Feng, X., Liu, Y., and Han, X. (2021). Apple qual-
ity identification and classification by image process-
ing based on convolutional neural networks. Scientific
Reports, 11(1):16618.
Mahmudul Hassan, S. K. and Kumar Maji, A. (2021). Iden-
tification of Plant Species Using Deep Learning. In
Proceedings of International Conference on Frontiers
in Computing and Systems, pages 115–125.
Nagpal, R., Long, S., Jahagirdar, S., Liu, W., Fazackerley,
S., Lawrence, R., and Singh, A. (2021). An Appli-
cation of Deep Learning for Sweet Cherry Phenotyp-
ing using YOLO Object Detection. In The 25th Int’l
Conf on Image Processing, Computer Vision, & Pat-
tern Recognition (IPCV’21).
Parent, C. and Spaccapietra, S. (1998). Issues and ap-
proaches of database integration. Commun. ACM,
41(5es):166–178.
Rahm, E. and Bernstein, P. A. (2001). A survey of ap-
proaches to automatic schema matching. VLDB J.,
10(4):334–350.
Raja Sekar, L., Ambika, N., Divya, V., and Kowsalya, T.
(2018). Fruit classification system using computer vi-
sion: a review. International Journal of Trend in Re-
search and Development (IJTRD), ISSN, pages 2394–
9333.
Ramos, P., Prieto, F., Montoya, E., and Oliveros, C. (2017).
Automatic Fruit Count on Coffee Branches using
Computer Vision. Computers and Electronics in Agri-
culture, 137:9–22.
Redmon, J., Divvala, S., Girshick, R., and Farhadi, A.
(2016). You Only Look Once: Unified, Real-Time
Object Detection. In 2016 IEEE Conference on Com-
puter Vision and Pattern Recognition (CVPR), pages
779–788. IEEE.
Science Learning Hub (2023). Breeding a new apple cul-
tivar. [Online] Available: https://www.sciencelearn.
org.nz/resources/844-breeding-a-new-apple-cultivar.
T
´
oth, B. P. and Papp, D. (2016). Deep Learning and SVM
Classification for Plant Recognition in Content-Based
Large Scale Image Retrieval. In CLEF 2016 - Confer-
ence and Labs of the Evaluation Forum.
Ukwuoma, C. C., Zhiguang, Q., Bin Heyat, M. B., Ali, L.,
Almaspoor, Z., and Monday, H. N. (2022a). Recent
advancements in fruit detection and classification us-
ing deep learning techniques. Mathematical Problems
in Engineering, 2022:1–29.
Ukwuoma, C. C., Zhiguang, Q., Bin Heyat, M. B., Ali, L.,
Almaspoor, Z., and Monday, H. N. (2022b). Recent
advancements in fruit detection and classification us-
ing deep learning techniques. Mathematical Problems
in Engineering, 2022:1–29.
Villacr
´
es, J. and Auat Cheein, F. (2020). Detection and
Characterization of Cherries: A Deep Learning Us-
ability Case Study in Chile. Agronomy, 10.
Yusuf, M. D., Kusumanto, R., Oktarina, Y., Dewi, T., and
Risma, P. (2018). Blob analysis for fruit recognition
and detection. Computer Engineering and Applica-
tions Journal, 7(1):23–32.
DATA 2023 - 12th International Conference on Data Science, Technology and Applications
380
