
BeeHIVE: Behavioral Biometric System Based on Object Interactions in
Smart Environments
Klaudia Krawiecka, Simon Birnbach, Simon Eberz and Ivan Martinovic
University of Oxford, Oxford, U.K.
{firstname.lastname}@cs.ox.ac.uk
Keywords:
Smart Home, Security, Biometrics.
Abstract:
The lack of standard input interfaces in Internet of Things (IoT) ecosystems presents a challenge in securing
such infrastructures. To tackle this challenge, we introduce a novel behavioral biometric system based on nat-
urally occurring interactions with objects in smart environments. This biometric leverages existing sensors to
authenticate users without requiring any hardware modifications of existing smart home devices. The system
is designed to reduce the need for phone-based authentication mechanisms, on which smart home systems
currently rely. It requires the user to approve transactions on their phone only when the user cannot be authen-
ticated with high confidence through their interactions with the smart environment. We conduct a real-world
experiment that involves 13 participants in a company environment. We show that this system can provide
seamless and unobtrusive authentication while still remaining highly resistant to zero-effort, video, and in-
person observation-based mimicry attacks. Even when at most 1% of the strongest type of mimicry attacks
are successful, our system does not require the user to take out their phone to approve legitimate transactions
in more than 84% of cases for a single interaction. This increases to 93% of transactions when interactions
with more objects are considered.
1 INTRODUCTION
The growing number of smart devices that are in-
corporated into smart environments leads to a wider
presence of a variety of sensors. These sensors can
be leveraged to improve the security of such environ-
ments by providing essential input about user activi-
ties. In many environments, the control over specific
devices or financial transactions should only be avail-
able for an authorized group of users. For example,
smart windows in a child’s bedroom should not open
when the parent is not present, and the child should
not be able to order hundreds of their favorite candy
bars using a smart refrigerator. Similarly, not all of-
fice workers should have access to a smart printer’s
history, nor should the visitors in a guesthouse be
able to change credentials on smart devices that do
not belong to them. But while there is a need for au-
thentication, smart devices offer limited interfaces for
implementing security measures. This can be miti-
gated by requiring that the user initiates or approves
every transaction through a privileged companion app
running on the user’s smartphone. However, this can
be very cumbersome as the user needs to have their
phone at hand and thus negates many advantages that
Figure 1: An overview of the BeeHIVE system. As the user
interacts with the printer, sensors embedded in smart ob-
jects surrounding the user and the printer record these inter-
actions. Physical signals generated from the user’s move-
ments are picked up by sensors such as accelerometers,
pressure sensors and microphones, and are used to profile
them. The system authenticates the user before allowing
them to perform certain actions, such as payments.
smart environments offer in the first place.
On-device sensors such as microphones, passive
infrared (PIR) sensors, and inertial measurement units
(IMUs) have been extensively used to recognize dif-
ferent activities performed by users in the area of Hu-
man Activity Recognition (HAR) (Irvine et al., 2020).
Prior work has focused on using one type of input
data to authenticate users, such as voice, breath, heart-
beats or gait (Saleema and Thampi, 2018; Meng et al.,
Krawiecka, K., Birnbach, S., Eberz, S. and Martinovic, I.
BeeHIVE: Behavioral Biometric System Based on Object Interactions in Smart Environments.
DOI: 10.5220/0012088900003555
In Proceedings of the 20th International Conference on Security and Cryptography (SECRYPT 2023), pages 135-146
ISBN: 978-989-758-666-8; ISSN: 2184-7711
Copyright
c
2023 by SCITEPRESS – Science and Technology Publications, Lda. Under CC license (CC BY-NC-ND 4.0)
135

2018; Chauhan et al., 2018; Sun et al., 2018; Barros
et al., 2019).
Several systems that rely on diverse types of in-
puts have been proposed to make attacks more dif-
ficult (Abate et al., 2011; Castiglione et al., 2017;
Ma
ˇ
cek et al., 2016; Olazabal et al., 2019; Cherifi
et al., 2021). While these approaches are promis-
ing, they often do not utilize the full potential of co-
located heterogeneous devices in smart environments.
In this paper, we propose the BeeHIVE system that
uses sensor data collected during day-to-day interac-
tions with physical objects to implicitly authenticate
users without requiring users to change smart home
hardware or adapt their behavior. This system can
be used to complement phone-based authentication
methods that require users to explicitly approve trans-
actions through privileged apps. By using BeeHIVE
together with a phone-based authentication method
as a fallback, smart environments can become more
seamless and unobtrusive for users without sacrific-
ing their security.
We conducted a 13-person experiment in a com-
pany environment to validate the performance of Bee-
HIVE and explore the effectiveness of imitation at-
tacks. The proposed technique is assessed in three
modes of operation to use (1) features from sensors
placed on the object with which the user interacts,
(2) features only from sensors on co-located objects,
and (3) features from both on-device and co-located
sensors. Overall, our analysis proves that the system
achieves desirable security properties, regardless of
the amount of smart office users or the environment
configuration. We make the following contributions
in the paper:
• We propose a novel biometric based on interac-
tions with physical objects in smart environments.
• We collect a 13-person dataset in a company set-
ting to evaluate the authentication performance of
the proposed system.
• We make all data and code needed to reproduce
our results available online
1
.
2 BACKGROUND AND RELATED
WORK
Existing biometric authentication systems that uti-
lize data collected from mobile and smart devices are
generally categorized into single-biometric or multi-
biometric approaches (Castiglione et al., 2017; Abate
et al., 2011; Yang et al., 2021). The systems from the
1
https://github.com/ssloxford/beehive
first category collect inputs of a specific type (e.g.,
sounds, images, acceleration readings) and search for
unique patterns. On the other hand, multi-biometric
systems combine the data extracted from multiple
sources to create unique signatures based on different
sensor types. Such systems are less prone to mimicry
attacks due to the complexity of spoofing multiple
modals simultaneously (Yampolskiy, 2008).
Single-Biometric Systems. The vast majority of ex-
isting commercial and non-commercial systems used
in smart environment contexts (Barra, 2013; Saleema
and Thampi, 2018; Meng et al., 2018; Blue et al.,
2018) primarily rely on voice recognition to authen-
ticate users. Since these systems are often vulnerable
to voice spoofing and hijacking attacks (Carlini et al.,
2016; Zhang et al., 2017; Diao et al., 2014; Zhang
et al., 2018), research efforts shifted towards hard-
ening voice recognition systems by leveraging anti-
spoofing mechanisms like proximity detection or sec-
ond factors (Blue et al., 2018; Meng et al., 2018).
The built-in sensors of IoT devices also enable the
use of more unconventional traits, such as breathing
acoustics (Chauhan et al., 2018), heartbeats (Barros
et al., 2019), gait or human body movements (Musale
et al., 2018; Sun et al., 2018; Musale et al., 2019;
Batool et al., 2017) in smart environments.
Multi-Biometric Systems. To improve adaptabil-
ity and accuracy of single-biometric systems, various
multi-biometric systems have been proposed (Abate
et al., 2011; Castiglione et al., 2017; Kim and Hong,
2008; Ma
ˇ
cek et al., 2016; Gofman et al., 2018; Cher-
ifi et al., 2021). For example, Olazabal et al. (Olaza-
bal et al., 2019) proposed a biometric authentication
system for smart environments that uses the feature-
level fusion of voice and facial features. These so-
lutions, however, still require users to actively par-
ticipate (e.g. by shaking devices or repeating spe-
cific hand wave patterns) in the authentication pro-
cess and rely on the presence of specific sensors in the
smart environment. To address such limitations, the
MUBAI system (Abate et al., 2011) employs multiple
smart devices to extract various behavioral and con-
textual features based on well-known biometric traits
such as facial features and voice recognition.
Interaction-Based Biometric Systems. Such sys-
tems have been widely discussed for mobile plat-
forms (Teh et al., 2016). Typically, on-device sensors
are employed to measure touch dynamics or user ges-
tures (Tafreshi et al., 2017; Lee et al., 2017; Ellavara-
son et al., 2020; Shrestha et al., 2016; Sturgess et al.,
2022; Verma et al., 2022). For example, users can be
profiled based on how they pick up their phones or
how they hold them (Attaullah et al., 2016). Similar
techniques have been used in smart environments (Al-
SECRYPT 2023 - 20th International Conference on Security and Cryptography
136

mohamade et al., 2021); however, most of the ex-
isting solutions not only require the user to actively
participate in the authentication process but also rely
on a specific setup. Our goal is to introduce a bio-
metric system that continuously and seamlessly au-
thenticates the users while they are interacting with
the devices around them without restrictions on sen-
sor placement.
SenseTribute. Closest to our work is
SenseTribute (Han et al., 2018), which performs
occupant identification by extracting signals from
physical interactions using two on-device sensors—
accelerometers and gyroscopes. Its main objective is
to attribute physical activities to specific users. To
cluster such activities, SenseTribute uses supervised
and unsupervised learning techniques, and segments
and ensembles multiple activities. There is a palpable
risk in real-world smart environments that users
will attempt to execute actions that they are not
authorized for. This requires means for not just
identification, but also authentication. Therefore—in
contrast to SenseTribute, which focuses on user
identification—the main objective of our system is
user authentication, for which we conduct a more
extensive experiment evaluating various types of
active attacks. In office and home environments, it
is easy for anyone to observe interactions made by
authorized users, and it is natural that, for example,
kids may seek to imitate their parents. Going beyond
previous work, we therefore evaluate the robustness
of our system against mimicry attacks based on
real-time observation or video recordings.
Furthermore, SenseTribute expects all objects to
be equipped with sensors. Yet, this is not always a re-
alistic assumption, as sensors are often deployed only
near (but not on) interaction points. Thus, we pro-
pose a system that uses nearby sensors present in co-
located IoT devices to authenticate user interactions.
3 SYSTEM DESIGN
Figure 1 shows an overview of the system design. The
proposed BeeHIVE system is meant to complement
existing app-based authentication mechanisms used
to secure current smart home platforms. Our system
authenticates the user through their interactions with
the smart environment and only requires the user to
approve transactions through the app as a fallback if
it cannot authenticate the user with confidence itself.
This way, BeeHIVE can reduce the reliance on these
app-based authentication mechanisms without com-
promising on the security of the smart home platform.
3.1 Design Goals
In order to support the system design and evaluation
methodology, we define the following design goals:
Unobtrusiveness. The system should not require
users to perform explicit physical actions for the pur-
pose of authentication nor require them to modify
their usual behavior.
Low False Accept Rate. As the system is designed to
be used alongside app-based authentication, it should
prioritize low false accept rates to avoid significantly
weakening the security of the overall smart environ-
ment system.
Low Friction. The system should provide a seamless
experience to the user wherever possible. This means
that false reject rates should be kept low to reduce the
need of falling back on the usual app-based authenti-
cation of the underlying smart environment platform.
However, this should not come at the cost of higher
false accept rates.
No Restrictions on Sensor Placement. The system
should use data from existing sensors without mak-
ing restrictions on their placement or orientation. This
ensures that the system can be applied to existing de-
ployments purely through software. In addition, the
system should not require sensors on each object but
instead use sensors on other nearby devices.
Robustness to Imitation Attacks. Due to the ease of
observation in home environments, the system’s er-
ror rates should not increase significantly even when
subjected to imitation attacks.
3.2 System Model
In this paper, we consider smart environments where
objects such as fridges or cupboards are augmented
by smart devices that monitor their state and provide
access to enhanced functionality. People naturally
interact with many of these smart objects during their
daily activities. Each activity consists of a set of
tasks. For instance, to prepare a meal, a user has to
walk to the fridge and open it to collect ingredients.
The user then has to walk to the cupboard to pick
up the plates. Behavioral data of these tasks are
measured with different types of sensors with which
smart devices are frequently equipped. As some
objects might not have any suitable sensors attached
to them, we also consider nearby sensors to profile
object interactions. This is particularly true for
physical objects without smart capabilities (e.g.,
cupboards or drawers). In order to illustrate these
different possible deployment settings, we consider
three system configurations:
BeeHIVE: Behavioral Biometric System Based on Object Interactions in Smart Environments
137

• ON-OBJECT, where sensors are mounted directly
on the object
• OFF-OBJECT, where only co-located sensor data
are considered
• COMBINED, which uses sensor data of both the
device on the object as well as from co-located
devices
We use sequences of interactions to increase confi-
dence in system decisions. This way, the user can be
better authenticated if they perform several tasks in
succession. As a simplification, we focus on authen-
ticating one user at a time and do not consider multi-
ple users interacting with objects simultaneously. It is
important to note that in our system a failed authen-
tication does not mean that the user is barred from
making transactions. Instead, they are required to use
their phone to approve the requested transaction.
3.3 Adversary Model
An adversary’s (A ) main objective is to convince the
smart environment that they are a legitimate user (U
L
).
Such a misclassification can result in permitting A to
execute on-device financial transactions or any other
types of sensitive operations on behalf of U
L
. We as-
sume that A has physical access to the environment,
but is otherwise an unprivileged user such as a child or
a visitor. Moreover, A cannot tamper with the smart
devices by, for example, connecting to the debug port
to flash the device firmware. We also assume that
smart devices and the user’s smartphone are not com-
promised; thus, they can be considered a reliable data
source. Based on these assumptions, we also exclude
the possibility of the attacker interrupting the training
phase, which could result in the generation of incor-
rect biometric signatures of authorized users.
In order to achieve their goal, A may attempt to
mimic the behavior of U
L
to generate a matching bio-
metric fingerprint. Successful mimicry attacks on var-
ious biometric systems have been previously demon-
strated (Khan et al., 2018). In our scenarios, we con-
sider three types of such attacks: (1) zero-effort at-
tackers who interact with the environment naturally
without attempting to change their behavior, (2) in-
person attacks in which A can observe legitimate
users interacting with IoT devices in person, and (3)
video-based attacks in which A possesses a video
recording of the user interacting with the IoT devices
in a smart environment. While in-person attacks give
A a chance to inspect U
L
’s interactions more closely
and potentially capture more details, recordings can
provide additional time to learn U
L
’s behavior.
Figure 2: Raspberry Pi on a kitchen cupboard. The contact
switch detects the opening and closing of the cupboard; the
microphone and the IMU record sensor measurements of
the interaction.
4 EXPERIMENTAL DESIGN
In order to evaluate the feasibility of authenticat-
ing users seamlessly based on their interactions with
smart devices, we conducted an experiment in a smart
office environment with thirteen participants. This ex-
periment is further used to study attackers that attempt
to copy the behavior of the legitimate user to execute
mimicry attacks.
Data Collection. For our experiment, we collected
data from a wide range of typical smart home inter-
actions using sensors similar to those already present
in most smart environments. Since raw sensor data
in smart devices are typically inaccessible to devel-
opers, we deploy Raspberry Pi 3 devices equipped
with the same types of sensors to simulate such an
environment and study object interactions. We use a
total of 8 Raspberry Pi devices equipped with mag-
netic contact switches, USB microphones (recording
sound pressure levels), and ICM20948 inertial mea-
surement units (IMUs) (providing an accelerometer,
a gyroscope, and a magnetometer) to collect the data
for the experiments. The Raspberry Pi devices are
fitted to typical home appliances (e.g., fridge or cof-
fee machine) and kitchen furniture (e.g., drawers or
cupboards). The magnetic contact switches are used
in place of a typical type of smart office device (i.e.,
a door/window contact sensor) and they provide the
ground truth for the occurrence of interactions with
smart objects (e.g., the opening of a kitchen cup-
board augmented with a contact sensor). The IMUs
measure the motion sensor data from the interaction
(i.e., acceleration, gyroscopic motion, and orienta-
tion) and are being polled through the I
2
C interface of
the Raspberry Pi devices. We note that, beyond their
primary purpose, many common smart devices em-
SECRYPT 2023 - 20th International Conference on Security and Cryptography
138

O3
O1
O4
O5
O7
O8
O2
O6
O1 - Right cupboard door
O2 - Wide cupboard
O3 - Left cupboard door
O4 - Narrow cabinet
O5 - Oven door
O6 - Coffee machine
O7 - Pull-out drawer
O8 - Microwave door
Figure 3: A simplified layout of the room and the arrange-
ment of the objects O1−O8 the participants interacted with
during the experiment.
ploy IMUs to protect against tampering
2
. The inputs
from the USB microphones are only used to calculate
sound pressure levels, but no actual audio data is be-
ing stored. See Figure 2 for an example deployment
of one of our measurement devices.
Mimicry Attacks. This project has been reviewed
and approved by the research ethics committee at our
university, reference number CS C1A 20 014-1. The
experiment is conducted in the office kitchen of a ho-
tel company. An overview of the deployment and the
room layout are shown in Figure 3. As object interac-
tions, we consider in this experiment: 4 cupboards, 1
mini oven, 1 pull-out drawer, 1 microwave, and 1 cof-
fee machine. Apart from the coffee machine, all of
these interactions involve the opening and closing of
the doors of the interaction point. To get the ground
truth for the coffee machine interaction, the user first
opens a lid on top of the coffee machine which is out-
fitted with a magnetic contact switch. The user then
proceeds with pressing buttons on the coffee machine,
before they end the interaction by closing the lid on
top of the machine again.
Each of the participants performs 20 runs of in-
teractions. Then, one of the participants is randomly
chosen as the legitimate user and victim of the attack.
The rest of the participants are split into two groups
of six attackers who can observe the user’s interac-
tions with the smart environment and try to mimic the
victim’s behavior. The first group can only observe
the victim in-person, whereas the second group has
access to video recordings of previous object interac-
tions which they can study in their own time.
5 METHODS
In this paper, we define a task T as a physical inter-
action initiated by user U
L
with an object O. Each
2
https://www.arrow.com/en/research-and-events/
articles/mems-and-iot-applications
task is represented by a time series, which is con-
structed from the data collected by on-device sensors,
including microphones, accelerometers, gyroscopes,
and magnetometers. This data represents the physical
signal generated by the user while they interact with
the smart object.
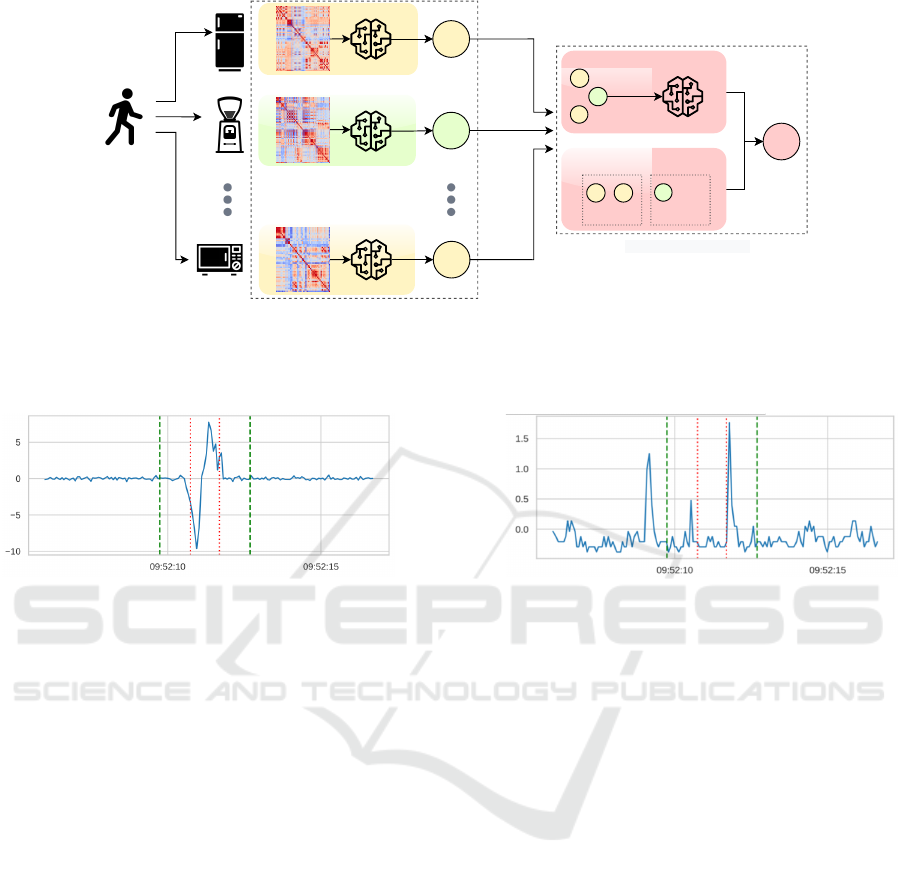
Figure 4 presents the system overview and ex-
plains its processing pipeline. Base-learners are weak
classifiers that are combined to form an ensemble to
facilitate the decision-making process. When the user
performs a sequence of tasks on several smart ob-
jects, the system extracts the features for these tasks
from on-object sensors as well as sensors in prox-
imity. Next the features become an input to the n
base-learners corresponding to those tasks—resulting
in predictions P
1
to P
n
. Finally, the meta-learner
gathers all predictions made by all the base-learners
and decides on the final prediction P
F
in the second-
level prediction layer. This way, a smart environ-
ment can benefit from the heterogeneous character of
smart devices and their built-in sensors by performing
a decision-level fusion to improve the classification
accuracy.
Preprocessing. Figure 5 presents the sensor read-
ings when U
1
interacts with the narrow cabinet dur-
ing the experiment. While (a) shows the signal that
the gyroscope sensor of the cabinet has captured, (b)
reveals what has been registered by a co-located sen-
sor. Co-located sensors are all sensors in proximity to
an object that can capture physical signals originating
from interaction with this object. The microphone on
the wide cupboard recorded two events—opening and
closing the door of the cabinet. These movements are
part of the task T performed on smart object O. The
start and end of T are time-stamped by the contact
sensors and denoted as t
0
and t
1
respectively (marked
with red dotted lines in Figure 5). The signals from T
are segmented by the values of t
0
−1 and t
1
+1 before
proceeding to the feature extraction phase.
Feature Extraction and Selection. For each physical
interaction with an object O, the system extracts ma-
trices with time series data for the sensor components
of this object and co-located objects. This data is only
extracted between t
0
−1 and t
1
+ 1. We add win-
dows of a second to account for signals that originate
from the start and end motions. We found that this
time window was the most optimal for capturing ini-
tial movement without including any residual effects
of other interactions. The statistical functions are
computed for each column of these matrices, and are
categorized into two groups: time-domain features
(min, max, mean, median, std, var, kurtosis, skew-
ness, shape factor, absolute energy, mean of central
approx. of 2
nd
derivative, mean/sum of abs. change,
BeeHIVE: Behavioral Biometric System Based on Object Interactions in Smart Environments
139
P1
P2
Pn
PF
First-Level Predictions
Stacking
Class 1 Class 2
Voting
Second-Level Predictions
UL
O1
O2
On
Figure 4: The diagram provides an overview of the processing pipeline of a multi-sensor fusion system. The system extracts
relevant features from U
L
’s interactions with objects O
1
to O
n
and supplies them to their base-classifiers. Then, the first-level
predictions P
1
to P
n
are fed into a meta-classifier (i.e., a voting or stacking classifier) that computes the final prediction P
F
.
(a) An interaction measured by the x axis of O
4
’s gyro-
scope.
(b) The same interaction picked up by the microphone
of the co-located O
2
.
Figure 5: As users interact with smart devices, signals from on-device sensors are collected and processed by the system.
Signals (a) and (b) are generated by a participant U
1
that has interacted with the narrow cabinet O
4
. The wide cupboard O
2
picked up additional input from the same interaction with object O
4
as they were co-located. Red dotted lines indicate the
start (t
0
) and end (t
1
) of the T task while the green dashed lines denote ± 1 seconds windows.
peaks) and frequency-domain features (Fourier en-
tropy). These features help to analyze the biome-
chanical effect of a given interaction on physical sig-
nals and identify characteristics of movements (Rosati
et al., 2018). For microphone data, we extract sound
pressure levels (SPLs) instead of actual audio record-
ings. Thus, statistical functions are applied to SPL
values. As for the feature selection process, the sys-
tem selects a subset of extracted features using mutual
information (MI) (Beraha et al., 2019).
Multi-Sensor Fusion. Every node in a smart envi-
ronment extracts different sets of characteristics from
user interactions due to their placement, purpose,
and composition of built-in sensors. Various fusion
approaches exist that can boost the detection accu-
racy and system effectiveness in multi-sensor envi-
ronments (Aguileta et al., 2019). Among these fu-
sion techniques, we focus on decision-level methods
which allow the introduction of multiple classifiers,
base-learners, that independently undertake a classi-
fication task. This gives a certain degree of auton-
omy to individual base-learners trained on specific
smart object interactions. As shown in Figure 4, after
each first-level base-classifier makes a prediction, the
second-level meta-classifier determines the final out-
come. The efficiency and effectiveness of various fu-
sion techniques at the decision level have been exten-
sively studied in the area of Human Activity Recog-
nition (HAR) (Aguileta et al., 2019). While our focus
is on user authentication, we hypothesize that similar
approaches can be just as effective in our case. As
such, we compare two ensemble learning techniques
that use fundamentally different classification meth-
ods but show promise for good performance in multi-
user smart environment scenarios.
Ensemble Learning. A meta-learner is trained us-
ing labels obtained from the first-layer base-learners,
as its features (Wolpert, 1992). Stacking allows com-
bining various classifiers (e.g., k-Nearest Neighbours,
Random Forests, Decision Trees, etc.) using differ-
ent sets of features for each. In our scenario, the
biggest advantage of this approach is that the meta-
classifier learns which object interactions predict la-
bels more accurately. Voting is another ensemble
SECRYPT 2023 - 20th International Conference on Security and Cryptography
140

learning method discussed in this paper. In compari-
son to stacking, this technique does not require a sep-
arate machine learning model to make final predic-
tions. Instead, it uses the deterministic majority vot-
ing algorithm to compute the result.
6 EVALUATION
This section provides a detailed examination of the
data collected during the experiment, along with an
exploration of potential implications for future re-
search.
6.1 Distinctiveness of Sensor Features
In order to judge the distinctiveness of features by
different types of sensors, we use relative mutual in-
formation (RMI). RMI is a well-known measure for
assessing the distinctiveness of different features be-
cause it quantifies the amount of information that one
feature provides about another, while taking into ac-
count the amount of information that each feature pro-
vides individually. RMI is defined as RMI(user, F) =
H(user)−H(user|F)
H(user)
, where H(A) is the entropy of A and
H(A|B) denotes the entropy of A conditioned on B.
Here, user denotes the ground truth of the user per-
forming the object interaction, whereas F is the vector
of extracted features.
Tables 1 and 1b show the RMI for individual sen-
sors that have been placed on multiple objects as part
of our experiment. These scores represent aggregated
maximum values of RMI for a particular sensor on
a specific object O
i
, given different configurations of
the system. Each of these objects introduces a differ-
ent way for a user to interact with the smart environ-
ment. Analysis of the distinctiveness of the features
extracted from these sensors allows us to understand
which ones contribute to better classification perfor-
mance for a specific type of interaction. Each de-
vice has been equipped with an accelerometer (ACC),
a magnetometer (MAG), a gyroscope (GYRO), and
a microphone (MIC). Generally, we observe that the
features extracted from GYRO and ACC exhibit high
distinctiveness for most of the interaction types. For
ON-OBJECT, the most distinctive features originate
from GYRO whereas for OFF-OBJECT, ACC appears
to supply the most distinctive features. We observe
that, in many cases, the inputs from co-located objects
generate higher RMI scores. On the other hand, the
features extracted from MIC appear to have relatively
low distinctiveness in comparison to other attributes
for the majority of interactions.
Despite its generally low distinctiveness for most
interactions, MIC achieves higher RMI values for in-
teractions with the pull-out drawer and is the second
most distinctive sensor for the coffee machine when
we consider features extracted only from its on-device
sensors. This can be explained as the drawer’s con-
tents make sounds continuously, changing based on
how far extended the drawer is, whereas for most
other events the main sounds were caused by the clos-
ing of doors—with little difference between users.
Pressing the buttons of the coffee machine on the
other hand makes faint sounds which differ between
users with regards to the timing of the button presses.
GYRO shows particularly high distinctiveness for
most interactions for ON-OBJECT, with the excep-
tions of the narrow cabinet and the pull-out drawer.
The cabinet used in the experiment has a very stiff
door that leads to abrupt openings with little variation
between users. While this reduces the effectiveness
of the recognition of users by sensors directly placed
on the cabinet, such abrupt openings allow co-located
sensors to capture stronger vibrations, hence, provide
more accurate distinction. The lower RMI values for
GYRO for the pull-out drawer can be explained by a
lack of rotational movement. Instead, the most dis-
tinctive movement characteristics are the sounds and
the acceleration which is why MIC and ACC are the
most distinctive sensor types for this interaction.
ACC appears to provide the most distinctive fea-
tures captured by co-located sensors. Interestingly,
the vibration signals picked up by the co-located sen-
sors exhibit the highest feature distinctiveness during
interactions with the coffee maker. Overall, we notice
that OFF-OBJECT features provide better distinctive-
ness than the features gathered only by ON-OBJECT
sensors. This suggests that the system can accurately
authenticate users by their interactions with objects
that do not have sensors directly placed on them.
6.2 Authentication Performance
In our experiment, we focus on analyzing the sys-
tem performance against three types of attacks. The
first part of the dataset contains the samples from
the victim as well as zero-effort attack samples from
each of the remaining 12 participants. This dataset is
split using 10-fold cross-validation. Each test fold is
used to evaluate a group of zero-effort attacks since
it contains the samples of attackers’ regular interac-
tions with objects. The remaining attack samples
are supplied to the zero-effort attack-trained classi-
fier. To compare and evaluate the effectiveness of dif-
ferent types of attacks on the environment, we report
False Reject Rates (FRRs) at different thresholds of
BeeHIVE: Behavioral Biometric System Based on Object Interactions in Smart Environments
141

Table 1: Aggregated maximum values of RMI in % for different configurations.
(a) ON-OBJECT configuration, given different types of
on-device sensors.
Object Type ACC MAG GYRO MIC
Right cupboard door 30.08 40.58 71.86 18.28
Wide cupboard 50.95 47.30 64.45 25.37
Left cupboard door 62.90 39.50 73.90 9.82
Narrow cabinet 30.39 33.28 19.41 15.78
Oven door 32.24 64.46 48.18 14.33
Coffee machine 34.07 40.64 60.48 41.67
Pull-out drawer 37.20 27.21 21.95 41.00
Microwave door 35.43 54.14 41.12 14.14
(b) OFF-OBJECT configuration, given different types of
co-located sensors.
Object Type ACC MAG GYRO MIC
Right cupboard door 79.21 68.89 72.08 22.80
Wide cupboard 85.86 53.72 59.10 26.57
Left cupboard door 77.69 75.53 74.21 16.26
Narrow cabinet 76.51 73.43 61.28 23.31
Oven door 79.23 73.52 60.76 17.93
Coffee machine 98.19 69.44 90.41 42.96
Pull-out drawer 81.21 73.12 57.56 28.70
Microwave door 86.09 54.00 58.37 20.65
Table 2: False Reject Rates (FRRs) for interactions with different types of objects in respect to three kinds of attacks given
different FAR thresholds. The ON-OBJECT column presents FRRs for the model with features extracted only from on-device
sensors. OFF-OBJECT shows FRRs considering only features from co-located sensors, whereas COMBINED reveals FRRs
for the model that uses the combined features from the co-located and on-device sensors. The results are averaged across all
smart objects in our experiment.
FAR
ON-OBJECT FRR OFF-OBJECT FRR COMBINED FRR
Zero-effort Video In-person Zero-effort Video In-person Zero-effort Video In-person
10% 0.0875 0.3335 0.1875 0.0 0.05 0.1125 0.025 0.2125 0.1688
1% 0.2375 0.5909 0.4938 0.0063 0.0625 0.1563 0.025 0.2375 0.2625
False Acceptance Rates (FARs). The FAR metric al-
lows us to determine how many attempts the attacker
was successful in. On the other hand, FRR specifies
how many legitimate samples from a victim have been
misclassified as an attack. Note that rather than com-
pletely preventing the user from executing a transac-
tion, this merely means that the user will have to ap-
prove the transaction explicitly through their phone.
First, we examine FRRs for individual smart ob-
jects that the user interacts with. Next, we inspect the
performance of ensembles of base-classifiers that are
responsible for interpreting different interactions with
objects. Finally, we compare the performance of vot-
ing and stacking meta-classifiers by examining the re-
ceiver operating characteristic (ROC) curve for an en-
semble of all available object interactions. In Table 2,
we present FRRs at 1% and 10% FAR thresholds av-
eraged across all objects for three types of attacks tar-
geting a dedicated user. Figure 6 shows their averaged
ROC curves. Table 3 presents FRRs for individual
smart objects in respect to zero-effort attacks without
a dedicated victim, i.e., the results are averaged across
all users being considered a victim. For each attack,
we calculate FRRs and FARs using different system
configurations, including ON-OBJECT, OFF-OBJECT,
and COMBINED. For OFF-OBJECT, only the top per-
forming features are selected.
In the training phase, we only use samples col-
lected during participants’ regular interactions with
the smart environment. This is because we consider
an attacker who has access to the facilities—for ex-
ample, a malicious co-worker whose typical interac-
tion samples would be known by the system. A zero-
effort attack, in which the attacker does not attempt to
mimic the behavior of a legitimate user, is an indica-
tion of the baseline performance of the system. Other
types of attacks involve attackers who either watched
the video of the victim interacting with objects or ob-
served the victim personally.
We observe that for authentication using OFF-
OBJECT sensors, we achieve an average false re-
ject rate of less than 1% with a 1% false accep-
tance rate for zero-effort attacks. FRRs increase to
6% for video-based attacks and to 16% for in-person
observation-based attacks, considering the same false
acceptance rate. This means that even when defend-
ing against strong video-based or in-person mimicry
attacks, the system does not require the user to ex-
plicitly approve transactions in more than 84% of
cases, as the system can instead authenticate the user
through their interactions with the smart environment.
For the FAR of 10%, the FRR for zero-effort at-
tacks drops to less than 1%. Similarly, FRRs for
video-based and in-person attacks decrease to 5% and
11% respectively. The ON-OBJECT configuration ex-
hibits the worst performance among all of the con-
figuration types, resulting in false reject rates of 24%
for the zero-effort attacks, 59% and 49% for the other
types of attacks. The COMBINED configuration guar-
antees better performance than ON-OBJECT, how-
ever, it exhibits worse performance than OFF-OBJECT
due to the inclusion of features extracted from on-
device sensors. It is noteworthy that the microwave
door and the narrow cabinet classifiers perform signif-
SECRYPT 2023 - 20th International Conference on Security and Cryptography
142
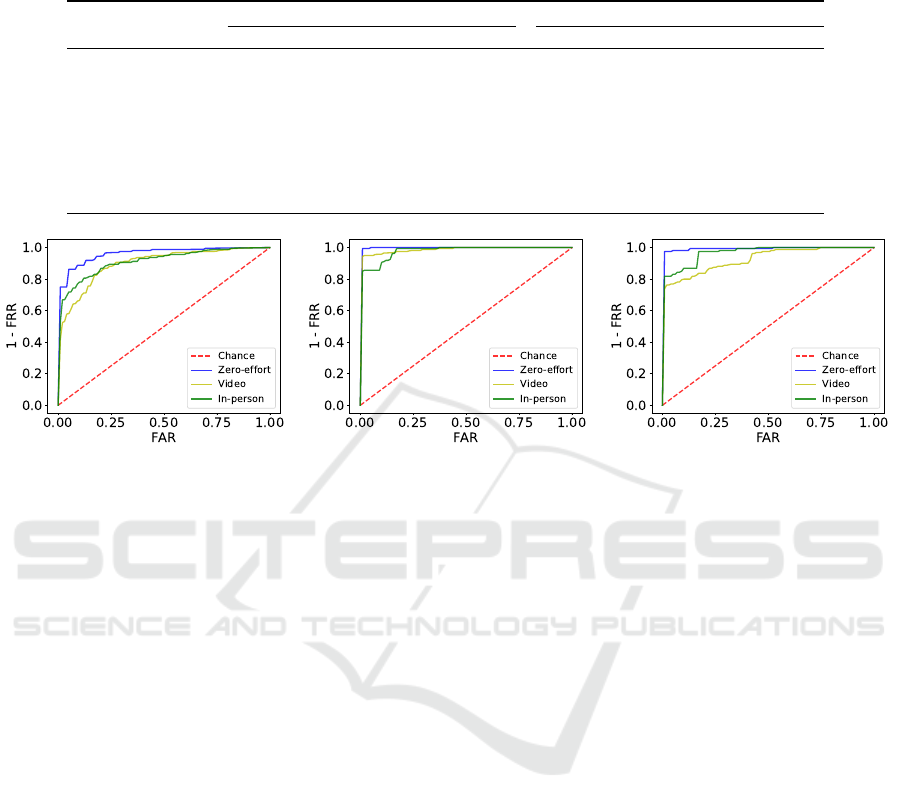
Table 3: FRRs at two distinctive FAR thresholds for interactions with different types of objects in respect to zero-effort at-
tacks given ON-OBJECT and OFF-OBJECT configurations. These configurations are compared to emphasize the improvement
offered by considering co-located sensors. Presented results are averaged across all users being considered a victim.
Object Type
FAR = 10%
FAR = 10%
FAR = 10% FAR = 1%
FAR = 1%
FAR = 1%
ON-OBJECT FRR OFF-OBJECT FRR ON-OBJECT FRR OFF-OBJECT FRR
Right cupboard door 0.0526 0.0039 0.1401 0.0154
Wide cupboard 0.0577 0.000 0.2231 0.0077
Left cupboard door 0.0369 0.0039 0.1077 0.0039
Narrow cabinet 0.1141 0.0 0.2577 0.0039
Oven door 0.0305 0.0 0.1020 0.0
Coffee machine 0.0154 0.0 0.0731 0.0
Pull-out drawer 0.0385 0.0 0.1180 0.0
Microwave door 0.0987 0.0115 0.2962 0.0192
(a) ON-OBJECT. (b) OFF-OBJECT. (c) COMBINED.
Figure 6: The plots above show the ROC curves for three system configurations respectively based on average FARs from
single interaction types. Each curve represents a different group of attacks, i.e., zero-effort (blue), in-person (green), and
video-based (yellow) attacks.
icantly worse than others, which impacts the average
scores. Since this effect is universal across users, this
suggests that poorly-performing objects should be ex-
cluded by the meta-classifier.
Table 3 compares the performance of ON-OBJECT
and OFF-OBJECT configurations across all smart ob-
jects. The narrow cabinet and the microwave door
exhibit the worst FRRs in the ON-OBJECT configu-
ration, resulting in false reject rates of 26% and 30%
given a 1% false acceptance rate for zero-effort at-
tacks. The FRRs drop to 0.4% and 1% when the
model includes features extracted from co-located
sensors. Since the OFF-OBJECT configuration ex-
hibits the best performance, we focus on it for the
remainder of this section.
The attackers from the video group could watch
the video of the victim performing interactions with
objects as often as desired for 24 hours. On the other
hand, the attackers who observed the victim in per-
son could follow them closely and look at the exact
body and hand movements. To understand this phe-
nomenon, we asked the participants to describe their
strategies. The participants from the video-based at-
tack group watched the video three times on average
before attempting to mimic the victim. When viewing
the video, participants report that they paid attention
to the strength with which the victim interacted with
the objects, the use of the hands (left or right), the
speed of the interaction, and the body position. The
participants in the second group, on the other hand,
focused mainly on the pace, strength, and rhythm of
the interaction. All attackers focused their strategy on
mimicking the power and speed with which the victim
interacted with objects. Additionally, most of them
attempted to spend a similar amount of time per in-
teraction as the victim did. One of the attackers even
counted the seconds spent on each interaction.
Considering multiple interactions with various ob-
jects can further improve the system’s performance.
Figure 7 shows averaged FRRs at two FAR thresh-
olds of 10% and 1% for different ensembles of objects
for the voting and stacking meta-classifiers given the
OFF-OBJECT configuration. We focus on the OFF-
OBJECT configuration here, as it exhibits the best
performance out of the three considered configura-
tions, and thus best demonstrates the potential per-
formance gains that can be achieved. This could be
further improved by adjusting the weights, i.e., as-
signing smaller ones to interactions that exhibit worse
performance. Generally, allowing the system to con-
sider more interactions before authenticating the user
results in better performance. Overall, the voting
BeeHIVE: Behavioral Biometric System Based on Object Interactions in Smart Environments
143

Figure 7: Averaged False Reject Rates (FRRs) at different False Acceptance Rates (FARs) thresholds calculated based on
the performance of different ensembles of unique objects for two meta-classifiers and the OFF-OBJECT configuration. Each
such ensemble is trained and tested separately, then the scores are averaged across the ensembles of the same type (e.g., pairs,
triples of unique objects).
method outperforms the stacking meta-classifier in
our scenario. This method is also computationally
less complex since it does not involve training another
classifier with the predictions of the base-classifiers.
The voting meta-classifier achieves a false reject rate
of less than 1% with a FAR of 1% whereas the stack-
ing classifier obtains a FRR of 2% for the zero-effort
attacks. The video-based attacks for the stacking clas-
sifier achieve a FRR of 33% when considering the en-
semble of two unique objects given a FAR of 1%. On
the other hand, the voting classifier obtains 7% FRR
given the same FAR threshold. This means that for
the voting classifier, the system can spare the user an
explicit phone-based authentication in 93% of cases.
We included only four smart objects in this analysis
but considering more unique smart objects results in
further improvements of the system performance.
7 LIMITATIONS
In this section, we discuss BeeHIVE’s limitations:
No Concurrent Device Use. In our experiment, we
limit interactions with any device to a single user at a
time. In the experiments, this was necessary to obtain
accurate identity labels to establish the distinctiveness
of device interactions. This limitation may lead to two
potential problems in practice. If two users are inter-
acting with different devices in the same room simul-
taneously or in short sequence, this may lead to de-
cisions made using multiple device interactions to be
wrong. This can be avoided by only using interactions
with the target device (the device requiring authenti-
cation) to make the decision.
Limited Number of Users and Interactions. Due
to time considerations and the unique requirements of
the ongoing Covid-19 pandemic, we could only cap-
ture device interactions in a single session. This limits
our analysis for different levels of FAR and FRR, as
the total number of samples and attacker/victim pairs
are too low to make a statistically robust analysis of
extremely low FAR levels. Given the promising re-
sults shown by our current analysis, we plan to collect
an additional large-scale dataset in the future.
Contiguous User Sessions. In our experiment, ses-
sions for different users were conducted one after the
other. In theory, it would be possible for environmen-
tal effects to be present during one user’s session but
not for others, thereby leading to classifiers learning
these effects as a proxy for user identity. For exam-
ple, a sound pressure sensor may pick up increased
ambient noise during a user’s session. However, the
fairly strong increase in FAR caused by imitation at-
tacks (video and in-person) suggests that the classi-
fiers capture (somewhat imitable) true user behavior
as it is unlikely users would attempt to match the orig-
inal environmental conditions during their attack.
SECRYPT 2023 - 20th International Conference on Security and Cryptography
144

8 CONCLUSION
In this paper, we have introduced a system to authen-
ticate users in smart environments based on naturally
occurring interactions with objects around them. No-
tably, our system does not require any sensors on the
object itself but makes use of sensors placed arbitrar-
ily in the room. We have conducted an experiment
in real-world settings with a total of 13 participants,
which shows that using these kinds of smart object
interactions for authentication is feasible. This is a
crucial finding because there is a need for stronger au-
thorization controls in such environments, but many
smart devices offer only limited interfaces to imple-
ment security features. Therefore, current systems
often rely on cumbersome app-based authentication
methods that require the user to always have their
phone at hand. Our system can complement such
phone-based authentication methods and reduce how
often a user has to explicitly approve a transaction in
the smart home companion app.
We show that our system demonstrates good au-
thentication performance against zero-effort attacks,
with less than 1% of transactions requiring external
approval at a FAR of 1% when considering a single
object interaction. When attackers attempting to im-
itate the victim’s behavior after observing them in-
person or through video footage are considered, the
user has to approve more transactions explicitly to
maintain a 1% FAR. However, the system can still
authenticate more than 84% of transactions unobtru-
sively when considering in-person attackers, rising to
94% of transactions for video-based attacks. We also
show that the system’s confidence in the authentica-
tion decision can be significantly improved if more
than one object interaction is considered.
These promising results and the potential for easy
deployment make this behavioral biometric system a
good candidate to improve the security of smart envi-
ronments in a seamless and unobtrusive manner. We
make our entire dataset and the code needed to repro-
duce our results available online to allow researchers
to build on our work.
ACKNOWLEDGEMENTS
The authors would like to thank Mastercard as well as
the PETRAS National Centre of Excellence for IoT
Systems Cybersecurity, which has been funded by the
UK EPSRC under grant number EP/S035362/1 for fi-
nancial support for this work.
REFERENCES
Abate, A. F., De Marsico, M., Riccio, D., and Tortora, G.
(2011). Mubai: multiagent biometrics for ambient in-
telligence. Journal of Ambient Intelligence and Hu-
manized Computing, 2(2):81–89.
Aguileta, A. A., Brena, R. F., Mayora, O., Molino-Minero-
Re, E., and Trejo, L. A. (2019). Multi-sensor fu-
sion for activity recognition—a survey. Sensors,
19(17):3808.
Almohamade, S. S., Clark, J. A., and Law, J. (2021).
Behaviour-based biometrics for continuous user au-
thentication to industrial collaborative robots. In
Maimut, D., Oprina, A.-G., and Sauveron, D., editors,
Innovative Security Solutions for Information Tech-
nology and Communications, pages 185–197, Cham.
Springer International Publishing.
Attaullah, B., Crispo, B., Del Frari, F., and Wrona, K.
(2016). Hold & sign: A novel behavioral biometrics
for smartphone user authentication.
Barra, H. B. (2013). Voice authentication and command.
US Patent 8,543,834.
Barros, A., Ros
´
ario, D., Resque, P., and Cerqueira, E.
(2019). Heart of iot: Ecg as biometric sign for authen-
tication and identification. In 2019 15th International
Wireless Communications & Mobile Computing Con-
ference (IWCMC), pages 307–312.
Batool, S., Saqib, N. A., and Khan, M. A. (2017). Internet
of things data analytics for user authentication and ac-
tivity recognition. In 2017 Second International Con-
ference on Fog and Mobile Edge Computing (FMEC).
Beraha, M., Metelli, A. M., Papini, M., Tirinzoni, A., and
Restelli, M. (2019). Feature selection via mutual in-
formation: New theoretical insights.
Blue, L., Abdullah, H., Vargas, L., and Traynor, P. (2018).
2ma: Verifying voice commands via two microphone
authentication. In Proceedings of the 2018 Asia Con-
ference on Computer and Communications Security.
Carlini, N., Mishra, P., Vaidya, T., Zhang, Y., Sherr, M.,
Shields, C., Wagner, D., and Zhou, W. (2016). Hidden
voice commands. In 25th U SENIX Security Sympo-
sium (USENIX Security 16), pages 513–530.
Castiglione, A., Choo, K. R., Nappi, M., and Ricciardi, S.
(2017). Context aware ubiquitous biometrics in edge
of military things. IEEE Cloud Computing, 4(6):16–
20.
Chauhan, J., Seneviratne, S., Hu, Y., Misra, A., Seneviratne,
A., and Lee, Y. (2018). Breathing-based authentica-
tion on resource-constrained iot devices using recur-
rent neural networks. Computer, 51(5):60–67.
Cherifi, F., Amroun, K., and Omar, M. (2021). Robust mul-
timodal biometric authentication on iot device through
ear shape and arm gesture. Multimedia Tools Appl.,
80(10):14807–14827.
Diao, W., Liu, X., Zhou, Z., and Zhang, K. (2014). Your
voice assistant is mine: How to abuse speakers to steal
information and control your phone. In Proceedings
of the 4th ACM Workshop on Security and Privacy in
Smartphones & Mobile Devices, pages 63–74.
Ellavarason, E., Guest, R., Deravi, F., Sanchez-Riello, R.,
and Corsetti, B. (2020). Touch-dynamics based be-
havioural biometrics on mobile devices – a review
BeeHIVE: Behavioral Biometric System Based on Object Interactions in Smart Environments
145

from a usability and performance perspective. ACM
Comput. Surv., 53(6).
Gofman, M., Sandico, N., Mitra, S., Suo, E., Muhi, S., and
Vu, T. (2018). Multimodal biometrics via discrimi-
nant correlation analysis on mobile devices. In Pro-
ceedings of the International Conference on Security
and Management (SAM), pages 174–181.
Han, J., Pan, S., Sinha, M. K., Noh, H. Y., Zhang, P., and
Tague, P. (2018). Smart home occupant identifica-
tion via sensor fusion across on-object devices. ACM
Transactions on Sensor Networks, 14(3-4):1–22.
Irvine, N., Nugent, C., Zhang, S., Wang, H., and NG, W.
W. Y. (2020). Neural network ensembles for sensor-
based human activity recognition within smart envi-
ronments. Sensors, 20(1).
Khan, H., Hengartner, U., and Vogel, D. (2018). Aug-
mented reality-based mimicry attacks on behaviour-
based smartphone authentication. In Proceedings of
the 16th Annual International Conference on Mobile
Systems, Applications, and Services, pages 41–53.
Kim, D.-S. and Hong, K.-S. (2008). Multimodal biometric
authentication using teeth image and voice in mobile
environment. IEEE Transactions on Consumer Elec-
tronics, 54(4):1790–1797.
Lee, W.-H., Liu, X., Shen, Y., Jin, H., and Lee, R. B. (2017).
Secure pick up: Implicit authentication when you start
using the smartphone. In Proceedings of the 22nd
ACM on Symposium on Access Control Models and
Technologies, pages 67–78.
Ma
ˇ
cek, N., Franc, I., Bogdanoski, M., and Mirkovi
´
c, A.
(2016). Multimodal biometric authentication in iot:
Single camera case study.
Meng, Y., Zhang, W., Zhu, H., and Shen, X. S. (2018).
Securing consumer iot in the smart home: Architec-
ture, challenges, and countermeasures. IEEE Wireless
Communications, 25(6):53–59.
Musale, P., Baek, D., and Choi, B. J. (2018). Lightweight
gait based authentication technique for iot using sub-
conscious level activities. In 2018 IEEE 4th World
Forum on Internet of Things (WF-IoT).
Musale, P., Baek, D., Werellagama, N., Woo, S. S., and
Choi, B. J. (2019). You walk, we authenticate:
Lightweight seamless authentication based on gait in
wearable iot systems. IEEE Access, 7:37883–37895.
Olazabal, O., Gofman, M., Bai, Y., Choi, Y., Sandico, N.,
Mitra, S., and Pham, K. (2019). Multimodal biomet-
rics for enhanced iot security. In 2019 IEEE 9th An-
nual Computing and Communication Workshop and
Conference (CCWC), pages 0886–0893. IEEE.
Rosati, S., Balestra, G., and Knaflitz, M. (2018). Com-
parison of different sets of features for human ac-
tivity recognition by wearable sensors. Sensors,
18(12):4189.
Saleema, A. and Thampi, S. M. (2018). Voice biometrics:
The promising future of authentication in the inter-
net of things. In Handbook of Research on Cloud
and Fog Computing Infrastructures for Data Science,
pages 360–389. IGI Global.
Shrestha, B., Mohamed, M., Tamrakar, S., and Saxena, N.
(2016). Theft-resilient mobile wallets: Transparently
authenticating nfc users with tapping gesture biomet-
rics. In Proceedings of the 32nd Annual Conference
on Computer Security Applications, ACSAC ’16, page
265–276, New York, NY, USA. Association for Com-
puting Machinery.
Sturgess, J., Eberz, S., Sluganovic, I., and Martinovic, I.
(2022). Watchauth: User authentication and intent
recognition in mobile payments using a smartwatch.
In 2022 IEEE 7th European Symposium on Security
and Privacy (EuroS&P), pages 377–391.
Sun, F., Mao, C., Fan, X., and Li, Y. (2018). Accelerometer-
based speed-adaptive gait authentication method for
wearable iot devices. IEEE Internet of Things Journal,
6(1):820–830.
Tafreshi, A. E. S., Tafreshi, S. C. S., and Tafreshi, A. S.
(2017). Tiltpass: using device tilts as an authentication
method. In Proceedings of the 2017 ACM Interna-
tional Conference on Interactive Surfaces and Spaces.
Teh, P. S., Zhang, N., Teoh, A. B. J., and Chen, K. (2016).
A survey on touch dynamics authentication in mobile
devices. Computers & Security, 59:210–235.
Verma, A., Moghaddam, V., and Anwar, A. (2022).
Data-driven behavioural biometrics for continuous
and adaptive user verification using smartphone and
smartwatch. Sustainability, 14(12).
Wolpert, D. H. (1992). Stacked generalization. Neural net-
works, 5(2):241–259.
Yampolskiy, R. V. (2008). Mimicry attack on strategy-based
behavioral biometric. In Fifth International Confer-
ence on Information Technology: New Generations
(itng 2008), pages 916–921. IEEE.
Yang, W., Wang, S., Sahri, N. M., Karie, N. M., Ahmed, M.,
and Valli, C. (2021). Biometrics for internet-of-things
security: A review. Sensors, 21(18).
Zhang, G., Yan, C., Ji, X., Zhang, T., Zhang, T., and Xu, W.
(2017). Dolphinattack: Inaudible voice commands. In
Proceedings of the 2017 ACM SIGSAC Conference on
Computer and Communications Security.
Zhang, N., Mi, X., Feng, X., Wang, X., Tian, Y., and Qian,
F. (2018). Understanding and mitigating the security
risks of voice-controlled third-party skills on amazon
alexa and google home. arXiv:1805.01525.
A CLASSIFIER HYPER
PARAMETERS
Table 4: Search space for classifier hyperparameters. As
each base classifier choses their own parameters, the opti-
mal values given here are the most commonly chosen ones.
(a) Random Forest (RF).
Parameter Search space Optimal value
Number of estimators 10, 50, 100, 200 100
Tree depth 2, 4, 5, 6, 7, 8 7
Number of features
√
N
F
, logN
F
√
N
F
(b) Support-vector Machine (SVM).
Parameter Search space Optimal value
C 0.1, 1, 10, 100 0.1
γ 1., 0.1, 0.01, 0.001 0.01
Kernel function linear, polynomial, rbf, sigmoid rbf
SECRYPT 2023 - 20th International Conference on Security and Cryptography
146
