
Identifying High-Quality Training Data for Misinformation Detection
∗
Jaren Haber
1 a
, Kornraphop Kawintiranon
2 b
, Lisa Singh
2 c
, Alexander Chen
2 d
, Aidan Pizzo
2 e
,
Anna Pogrebivsky
2 f
and Joyce Yang
2 g
1
Quantitative Social Science, Dartmouth College, U.S.A.
2
Massive Data Institute, Georgetown University, U.S.A.
Keywords:
Social Media, Data Labeling, Misinformation, COVID-19.
Abstract:
Misinformation spread through social media poses a grave threat to public health, interfering with the best
scientific evidence available. This spread was particularly visible during the COVID-19 pandemic. To track
and curb misinformation, an essential first step is to detect it. One component of misinformation detection
is finding examples of misinformation posts that can serve as training data for misinformation detection al-
gorithms. In this paper, we focus on the challenge of collecting high-quality training data in misinformation
detection applications. To that end, we demonstrate the effectiveness of a simple methodology and show its
viability on five myths related to COVID-19. Our methodology incorporates both dictionary-based sampling
and predictions from weak learners to identify a reasonable number of myth examples for data labeling. To aid
researchers in adjusting this methodology for specific use cases, we use word usage entropy to describe when
fewer iterations of sampling and training will be needed to obtain high-quality samples. Finally, we present a
case study that shows the prevalence of three of our myths on Twitter at the beginning of the pandemic.
1 INTRODUCTION
Misinformation poses a grave threat to public health,
especially during a health crises like the COVID-19
pandemic. Currently, a large portion of COVID-19
misinformation is shared on social media platforms
like Twitter. Falsehoods that endanger public health
and disseminate through social media include claims
that drinking bleach cures COVID-19, that the virus
can be transmitted through mosquito bites (WHO,
2022), and that 5G networks caused the pandemic
(Ahmed et al., 2020). Detecting misinformation on
these platforms is a necessary precursor to curbing its
spread and ensuring that people are honestly informed
about public health crises.
a
https://orcid.org/0000-0002-5093-8895
b
https://orcid.org/0000-0003-0040-7305
c
https://orcid.org/0000-0002-8300-2970
d
https://orcid.org/0009-0000-5668-3662
e
https://orcid.org/0009-0002-6282-0760
f
https://orcid.org/0009-0006-7966-4812
g
https://orcid.org/0009-0001-9706-710X
∗
This Research Was Supported by National Science
Foundation Awards #1934925 and #1934494 and the Mas-
sive Data Institute.
Researchers have proposed various machine
learning algorithms for identifying misinformation in
newspapers and on social media (Shu et al., 2017;
Wang et al., 2020; Guo et al., 2020; Kawintiranon
and Singh, 2023). Most of these misinformation de-
tection algorithms require a reasonable amount of la-
beled data to build the proposed model. Although
finding high-quality training data is challenging for
any learning task, it is more challenging for tasks
where random sampling of training examples leads
to large class imbalances. This is the case for mis-
information on social media: if researchers randomly
sample posts that contain discussion around a public
health crisis such as COVID-19, it is rare that a suf-
ficiently large fraction of the posts will be about the
myth of interest. This makes finding training data for
myths more labor-intensive than other learning tasks.
Therefore, it is important for researchers to have a
strategy for efficiently identifying high-quality train-
ing examples for building misinformation models.
Research has demonstrated the importance of data
quality for model training: in particular, greater im-
balance between classes and a greater variety of
myths (high myth heterogeneity) in the training data
make it more difficult to train an effective misin-
64
Haber, J., Kawintiranon, K., Singh, L., Chen, A., Pizzo, A., Pogrebivsky, A. and Yang, J.
Identifying High-Quality Training Data for Misinformation Detection.
DOI: 10.5220/0012089000003541
In Proceedings of the 12th International Conference on Data Science, Technology and Applications (DATA 2023), pages 64-76
ISBN: 978-989-758-664-4; ISSN: 2184-285X
Copyright
c
2023 by SCITEPRESS – Science and Technology Publications, Lda. Under CC license (CC BY-NC-ND 4.0)

formation detection model (Kawintiranon and Singh,
2023). We define high-quality training data as 1) con-
sisting of a sufficient number of examples for both
classes and 2) being fairly balanced, with at least 40%
of the posts containing the myth being predicted. As
we will show, using an iterative approach that alter-
nates between a limited keyword dictionary and a
weak learner leads to identification of high-quality
training data for misinformation detectors. Our strat-
egy contrasts with the traditional stratified random
sampling approach, which assumes we know to which
strata each post belongs.
Although research in misinformation de-
tection typically collects data using either
dictionary/keyword-based (Haber et al., 2021;
Singh et al., 2020) or automatic approaches (Hossain
et al., 2020; Helmstetter and Paulheim, 2018),
this paper proposes a methodology that combines
knowledge from myth-related dictionary-based
searches and weak learner predictions to identify
high-quality training examples. When using this
methodology on multiple COVID-19 related myths,
we find that different myths lend themselves to
different combinations of dictionary searches and
predictions from weak learners, and that specific
properties of myth-related conversation influence
the best strategy for generating a sufficient amount
of training data. We extensively study and explain
these strategic differences through variability in a
myth-level characteristic we call word usage entropy.
We show that determining the word usage entropy
can help researchers better understand the level of
complexity associated with their labeling task. This
proposed method thereby enables researchers to
easily make adjustments when identifying training
examples to better exploit the characteristics of a
specific myth.
The Contributions of This Paper Are as Follows:
1) we propose a methodology for identifying high-
quality training examples for building misinformation
detection models; 2) we demonstrate the effectiveness
of our methodology on myths related to the COVID-
19 pandemic; 3) we propose using word usage en-
tropy, a metric for better understanding the proper-
ties of discussion around a specific myth within a do-
main of interest, to allow for better customization of
our proposed methodology for different myths; 4) we
show the amount of discussion on Twitter about three
COVID-19 myths, and describe the relationship be-
tween their prevalence and events of the day; and 5)
we make our code and labeled data available for the
research community.
1
1
Access our codebase at: https://github.com/GU-
DataLab/misinfo-generating-training-data/
The remainder of this paper is organized as fol-
lows. Section 2 presents related literature, and Sec-
tion 3 discusses our proposed methodology. Section
4 describes our experimental design, followed by our
empirical evaluation and discussion in Section 5. We
present a case study showing the prevalence of a sev-
eral myths in Section 6. Finally, we present conclu-
sions and future directions in Section 7.
2 RELATED LITERATURE
This section begins by describing the data collec-
tion methods researchers have developed for identi-
fying misinformation on social media (Section 2.1).
We then present relevant literature about misinforma-
tion on social media, focusing on COVID-19 (Section
2.2).
2.1 Data Collection for Misinformation
Detection
Most studies of COVID-19 misinformation have fo-
cused on detection algorithms and/or describing the
spread of specific myths (Wang et al., 2020; Helm-
stetter and Paulheim, 2018; Ma et al., 2016), but there
has been little discussion about how misinformation
training data can be efficiently collected for different
kinds of misinformation.
Because misinformation makes up a small slice of
social media content, most misinformation detection
studies describe the process of obtaining misinforma-
tion posts (Cui and Lee, 2020; Hayawi et al., 2022;
Weinzierl and Harabagiu, 2022; Nielsen and Mc-
Conville, 2022). Cui and Lee (Cui and Lee, 2020) ob-
tained tweets containing misinformation by using the
titles of fake news articles as search queries. While
this approach is promising, it requires access to news-
paper data as well as social media data. Similarly,
Hayawi et al. (Hayawi et al., 2022) manually para-
phrased the titles of newspaper articles into easily un-
derstandable sentences that were used to search for
tweets. Medical experts then manually labeled mis-
information in 15,000 tweets, of which 38% were
misinformation-related. In a more fine-grained ap-
proach, the COVIDLies data set (Hossain et al., 2020)
used fact-checkers’ claims to manually build a list
of misinformation statements and hand-label the 100
most similar tweets for each,
2
resulting in approxi-
mately 15% being misinformation-related.
2
They used BM25 (Beaulieu et al., 1997) and
BERTSCORE (Zhang et al., 2019) to compute similarities
between false claims and candidate tweets.
Identifying High-Quality Training Data for Misinformation Detection
65

CoVaxLies data set (Weinzierl and Harabagiu,
2022) was created using the method proposed by the
authors of COVIDLies (Hossain et al., 2020) by hand-
labeling 7,346 misinformation-related statements.
3
These previous studies used resource-intensive hu-
man labeling in an inefficient way, finding myths
within their data set between 15% to 40% of the time.
Our goal is to develop an evaluation strategy that com-
bines keyword searches and weak learner predictions
to improve on the myth hit rate of previous studies.
A more efficient method developed by Nielsen
& McConville (Nielsen and McConville, 2022) uses
keyword extraction algorithms (Grootendorst, 2021)
together with a sentence transformer model (Reimers
and Gurevych, 2019) to build a set of keyword-based
phrases for each COVID-19-related claim from fact
checkers. The authors compute a similarity score be-
tween fact-checked claims and tweets that were cre-
ated at a similar time to determine whether or not
tweets contain misinformation. While this approach
has a reasonable recall, its precision is still low,
4
po-
tentially leading to a large amount of poorly labeled
data. For this reason, our proposed methodology uses
a hybrid, iterative approach to collect training data in-
stead of a fully automated one.
Another promising approach is active learning,
which intentionally samples cases with uncertain pre-
dictions for iterative model training—an approach
that has been combined with deep learning for misin-
formation detection (Das Bhattacharjee et al., 2017;
Hasan et al., 2020). While active learning strate-
gies share our goal of efficient sampling and multi-
ple stages of model development, they typically start
from large labeled data sets or pretrained models, and
thus are poorly suited to our goal of collecting train-
ing data with minimal manual labeling.
Despite the public importance of misinformation
and the significant scholarly effort devoted to its iden-
tification, we are aware of no study that has compared
strategies for obtaining training data for misinforma-
tion detection in specific domains. This paper fills that
gap.
2.2 COVID-19 Misinformation on
Social Media
Misinformation and disinformation continue to
spread widely and have even become commonplace
(EUvsDisinfo, 2020). Social media sites are par-
ticularly vulnerable to false or misleading claims
3
The authors do not share the number of non-
misinformation-related statements labeled.
4
The authors do not share specific numbers quantifying
recall and precision.
(Vosoughi et al., 2018). Researchers have shown
the virality of myths in online communities (Barthel
et al., 2016; Vosoughi et al., 2018) and the impor-
tance of social media platform policies for mitigat-
ing the reach of misinformation (Allcott et al., 2019;
Bode and Vraga, 2015). Data mining research on
social media misinformation has focused on under-
standing author stance (Hossain et al., 2020; Kawin-
tiranon and Singh, 2021) or sentiment (Heidari and
Jones, 2020; Kucher et al., 2020), semantic patterns
in users’ posts (Yang et al., 2019), or content producer
networks and how they spread links to low-quality in-
formation (Shao et al., 2018). While some of these
tasks can use dictionaries, most require some form of
labeled training data. Our focus is on effectively iden-
tifying myth-related data to help researchers advance
methods for detecting misinformation on social me-
dia.
Research documenting the impacts of widespread
social media misinformation (Budak et al., 2011; Ku-
mar and Shah, 2018; Guo et al., 2020) has largely fo-
cused on the domains of politics (Haber et al., 2021;
Bozarth and Budak, 2020) and health (Hossain et al.,
2020; Singh et al., 2020). For example, a recent anal-
ysis of misinformation-related discussion during the
U.S. 2020 presidential election (Haber et al., 2021)
shows that personal attacks on Joe Biden and election
integrity were the most prevalent topics on social me-
dia, echoing other media streams and ultimately shift-
ing public memory about the candidates up to election
day. Misinformation and disinformation were also
pervasive during the 2016 US presidential election on
social media sites, particularly Twitter and Facebook
(Bode et al., 2020; Grinberg et al., 2019).
While political lies may shape elections, the rapid
sharing of low-quality information on social media re-
lated to health and COVID-19 in particular (Ahmed
et al., 2020; Hossain et al., 2020; McGlynn et al.,
2020; Singh et al., 2020) can cost lives (Kumar and
Shah, 2018). During the Ebola outbreak in 2014, vi-
ral claims that drinking salt water wards off the virus
led to numerous deaths (Oyeyemi et al., 2014). More
recently, the World Health Organization (WHO) has
raised alarms about a COVID-19 “infodemic”, which
they defined as an epidemic-related “overabundance
of information”—accurate or not—–that can lead to
confusion and mistrust and disrupt governments’ pub-
lic health responses, putting public health at signif-
icant risk (WHO, 2021). Indeed, within the first
three months of 2021, misinformation about COVID-
19 (e.g., ingesting disinfectants as a way of “clean-
ing” the virus) led to hundreds of deaths around the
world (Coleman, 2021). Given the speed and spread
of misinformation on social media and the serious
DATA 2023 - 12th International Conference on Data Science, Technology and Applications
66

effects of health-related misinformation, the ability
to track misinformation in social media is essential.
Therefore, assessing strategies for identifying high-
quality labeled data is an important step.
3 METHODOLOGY
We present our high-level methodology in Fig. 1. For
each myth of interest, we first identify a small num-
ber of seed words to create a base dictionary (a list
of conceptually related keywords). We then use the
dictionary to search for approximately 100 relevant
posts.We label those posts using human coders, defin-
ing the myth hit rate as the fraction of labeled posts
that contain the myth. If the myth hit rate is suffi-
ciently high, we build a set of weak learners using
the labeled data as training data and use the best-
performing weak learner to identify a new set of rele-
vant posts. Otherwise, we use the same dictionary to
collect more posts or add more keywords to the dictio-
nary if necessary. This process of switching between
using weak learners and a keyword-based dictionary
to collect posts continues until we have a sufficient
amount of training data to build a strong classifier. In
the remainder of this section, we discuss each compo-
nent in more detail.
3.1 Training Data Collection Method
We consider two strategies for identifying relevant
posts, the first of which is keyword-based. For each
myth of interest, we start with a set of keywords
and/or phrases that we believe will be in posts dis-
cussing the myth, i.e., keywords that have high preci-
sion. We refer to the initial set of keywords as seed
words, and consider them to be the base words for a
myth dictionary.
While we could just use the seed words to collect
posts, continually adding more keywords as needed or
using synonyms—such as by using word embedding
spaces to increase the word set—will likely lead to
an increase in precision and a loss in generalizability
and coverage. In other words, any model built using
only these seeds (and related seeds) may overfit the
data and fail to capture other language expressing that
myth, i.e., have low recall. Therefore, we consider
a second strategy for identifying myth-related posts:
building weak learners. Weak learners produce ma-
chine learning models that perform a little better than
a random guess. We use a small set of labeled posts to
build a set of weak learners and then use the best weak
learner to identify myth-related posts.
5
Our intuition
5
Note that we use the classifier to identify the myth-
is that if more than 50% of the posts are about the
myth of interest, then the weak learner will be capa-
ble of identifying posts that are of higher quality than
using only a keyword-based method. More specifi-
cally, the weak learners’ model may incorporate infor-
mation outside the seed words, helping them identify
posts that dictionaries might have missed. However,
if the weak learner is not performing well, we con-
duct additional iterations of the keyword-based post
search.
3.2 Post Search
Different social media platforms have Application
Program Interfaces (APIs) that are used to collect
data. Some APIs are keyword- or user-based, while
others are based on random samples. Irrespective of
the API being used, the process we propose assumes
that either a random set of data (e.g., the Twitter Dec-
ahose) or data associated with a general area of inter-
est (e.g., posts about COVID-19) have been collected
using an API. We assume that the number of posts
is large and that they are stored efficiently as JSON
files or as a table in a database, allowing for efficient
random or SQL-based sampling to identify posts for
labeling.
3.3 Post Labeling
Once the posts have been identified for labeling, any
strategy for labeling can be used. The most com-
mon are manual labeling within a research team,
crowdsourced labeling (e.g., Amazon’s Mechanical
Turk), or labeling using an existing strong classifier.
Given the importance of accurate labels for train-
ing classifiers—especially for public-health related
tasks—we focus on small amounts of manual labeling
and crowdsourced labeling options to provide high-
quality data for model building.
4 EXPERIMENTAL DESIGN
This section describes our specific implementation of
the methodology presented in the previous section.
We begin by explaining our data set (Section 4.1.
Then we describe the details of the dictionary-based
search and the construction of the weak learners (Sec-
tions 4.2 and 4.3), followed by a discussion of the
data labeling process in Section 4.4). Finally, in Sec-
tion 4.5 we discuss evaluation criteria for assessing
related posts for labeling, not the non-myth related posts,
because the latter are more prevalent and easy to identify.
Identifying High-Quality Training Data for Misinformation Detection
67

Figure 1: This diagram shows our workflow for collecting myth-related training data.
the level of complexity associated with finding high-
quality training data.
4.1 Data Set
We collect COVID-19-related data using the Twitter
Streaming API. We collected our data for this study
between March 1, 2020 and August 30, 2020 using
general COVID-19 related hashtags: #coronavirus
or #COVID19. Our data set contains over 20 mil-
lion original English tweets—excluding quotes and
retweets—preprocessed by removing punctuation and
capitalization. We store our data in Cloud storage and
process it with PySpark.
For this analysis, we identified COVID-19 myths
using expert health sources: the World Health Orga-
nization and Johns Hopkins Medicine, both of which
maintain lists of false claims/myths (WHO, 2022;
Maragakis and Kelen, 2021). We identified claims
that appeared in both sources and grouped them into
six broader categories of myths: home remedies, dis-
infectants, weather, spread, medicine for treatment,
and technology for treatment. Each of these myth cat-
egories include different ideas and contexts of usage
under the same conceptual umbrella. Table 1 shows
each myth category and examples of keywords associ-
ated with specific myths within that category. For ex-
ample, the home remedies category includes the more
specific notions of drinking alcohol, eating garlic, or
sipping water to combat the virus.
To test the sensitivity of our pipeline for differ-
ent levels of myth specificity, we test our method-
ology on myth categories as well as specific myths
within several of these categories. We consider the
following specific myths: 5G and mosquitoes from
the spread category, hydroxychloroquine and antibi-
otics from the medicines for treatment category, and
Table 1: Myth categories and example keywords.
Home reme-
dies
home remedy, drink alcohol, eat gar-
lic, hot bath, saline, sip water, turmeric
Disinfectants
bleach, disinfectant, methanol,
ethanol
Weather
warm weather, cold weather, heat
kills, higher humidity, weather stops
Spread
5g, mosquito spread, mosquito trans-
mit, mosquito infect, house flies
spread, house flies transmit, house
flies infect
Medicines for
treatment
hydroxychloroquine, chloroquine, an-
tibiotics, medicines treat, flu shot cure,
flu vaccine treat
Technology
for treatment
hand dryers, hair dryers, uv, u-v, ultra
violet, ultra-violet, uvc radiation
UV light from the technology for treatment category.
4.2 Dictionary-Based Search
We manually generate a set of keywords or seeds to
represent each myth to create a myth-specific dictio-
nary.
6
The goal is to identify a small number of seed
words or short phrases commonly found in tweets
spreading the myth of interest. For example, for the
myth UV light eradicates COVID-19, we focus on the
phrases: “uv”, “ultra violet” and “uvc radiation”. For
the myth Hydroxychloroquine prevents illness, hospi-
talization and death from COVID-19, seed words in-
clude “hydroxychloroquine” and the similar “chloro-
quine”. To support future research, we share the final
list of keywords used for identifying posts for each
myth.
7
6
For ease of exposition, we will use the term “myth”
when laying out the experimental design. However, we use
the same design for the myth categories we test.
7
https://github.com/GU-DataLab/misinfo-generating-
training-data/
DATA 2023 - 12th International Conference on Data Science, Technology and Applications
68

We searched for the dictionary words in our
COVID-19 tweet data set to select an initial sample
of tweets related to each myth. During each iteration
of our methodology, our sample sizes range from 50
to 200 posts. We limit the posts in each iteration to
test our mixed-mode strategy for identifying relevant
tweets.
4.3 Search Using Weak Learners
Because positive labels are much more rare than nega-
tive labels (misinformation is less prevalent than other
topics of discussion), our focus is obtaining a suffi-
cient number of positive labels to train the weak learn-
ers. Once we collect approximately 50 tweets that are
labeled as being about a specific myth, we attempt to
build weak classifiers using a balanced training data
set. We use the following machine learning algo-
rithms to build our weak learners: k-Nearest Neigh-
bors, Decision Tree, Random Forest, Multinomial
Naive Bayes, Logistic Regression, and Multi-Layer
Perceptron. We use the scikit-learn (Pedregosa et al.,
2011) implementations of each model, with their de-
fault settings, and train using 10-fold cross validation.
To evaluate modeling performance, we consider three
metrics: accuracy, F1 score,
8
and F1 score for pos-
itive cases only, hereafter “positive F1 score”. The
misinformation literature uses the positive F1 score to
prioritize the accurate identification of myths.
We then select the best classifier using the positive
F1 score. We use this best-performing weak learner
to identify a sample of myth-related tweets from the
COVID-19 data set. At times, the best models are
barely better than random. In those cases, we attempt
to optimize parameters. In cases where model per-
formance does not improve, we return to dictionary-
based searches (adding new keywords and phrases if
needed) to increase the size of the training set before
building more weak learners. As more positive tweets
are labeled, we rebuild our weak learners and iterate
through this process until our training set is a reason-
able size.
4.4 Data Labeling
Amazon Mechanical Turk is a crowdsourcing plat-
form with multiple uses, including data labeling.
9
Data labeling tasks range from identifying objects in
images to confirming statements in text to interpreting
different forms of data.
8
The F1 score is the harmonic mean of precision and
recall, a standard evaluation metric in machine learning.
9
http://www.mturk.com
We employed Mechanical Turk workers to label
tweets as being about a specific myth or not. A tweet
was labeled by three workers, and each worker was
paid $0.20 per labeling task. Each task took workers
between 30 seconds and 4 minutes to complete. Data
labelers were provided instructions, examples, and
definitions to improve labeling consistency among
them.
When labelers disagreed on the tweet label, we
labeled the tweet with the majority vote. Labelers
were given the option of “uncertain”, a label we in-
terpret as not being about a myth (i.e., a negative
case). To create a high-quality data set, we remove
under-performing labelers who have a disagreement
rate over 50%, i.e., who disagree with the majority
votes for more than 50% of all the posts they have
labeled. We removed five out of a total of over 100
labelers based on this performance criterion. More-
over, we compute inter-annotator agreement scores
to assess the quality of our labeled data.
10
. For our
labeled data, both the task-based and worker-based
scores ranged from 90% to 97% for different data sets,
indicating high inter-rater reliability.
4.5 Decision Point
The methodology has an important decision point
each iteration: whether or not to continue to use pre-
dictions from weak learners to collect new tweets
for labeling, or whether to switch back to using a
dictionary-based search. To guide this decision, we
consider two pieces of information about a weak
learner:
• Test performance: the number of true positives
and false negatives identified by the weak learner
on the labeled test set.
• Myth hit rate: the proportion of posts identified by
the weak learner that were labeled as being about
the myth.
These are standard evaluation criteria for machine
learning model analysis. However, because of the
large class imbalance associated with our task, we fo-
cus on true positives and false positives more than
false negatives. In other words, missing a post that
mentions a myth is less costly than mislabeling a post
as containing myth content when it does not. This dis-
tinction makes our estimates more conservative, mo-
tivated by the rarity of myths and the greater cost of
10
The task-based and worker-based metrics are recom-
mended by the Amazon Mechanical Turk official site based
on their annotating mechanism. See the official document
at https://docs.aws.amazon.com/AWSMechTurk/latest/
AWSMturkAPI/ApiReference HITReviewPolicies.html
Identifying High-Quality Training Data for Misinformation Detection
69

over-estimating their numbers.
11
Finally, as part of our evaluation, we introduce the
concept of word usage entropy, a variant of word en-
tropy (Shannon, 1951). Word usage entropy measures
the number of contexts associated with the seed words
for a specific myth, where “context” refers to discus-
sion around a specific topic within a domain (here,
discussion around COVID-19). A term with a sin-
gle context has a single meaning easy to capture in
text data, while the meaning of a term common across
multiple contexts is more difficult to infer. Likewise,
the greater the total number of contexts in which a
myth’s component terms are used, the more difficult
that myth is to detect.
For example, the word weather is used not only
in the context of discussing COVID-19 misinforma-
tion, but also in general conversation unrelated to
health information, such as missing out on good
weather when someone is sick. Thus, weather has
at least two contexts, with the consequence that any
occurrence of that word could refer to myths around
COVID-19 or to something else. In contrast, the word
hydroxychloroquine only describes a controversial
medication, allowing the analyst to be confident that
each occurrence relates to the context of a COVID-19
myth.
We compute word usage entropy E of myth M as
follows:
E(M) =
k
∑
i=1
(c(
i
) × log(c
i
)) (1)
where k is the number of seeds for a specific myth M
and c
i
is the number of contexts associated with a spe-
cific seed. Word usage entropy is a continuous mea-
sure with a minimum of zero, where zero indicates
a myth whose ingredient terms are used only in the
context of discussing that myth. We will show that
our methodology requires fewer iterations and has a
higher myth hit rate when the word usage entropy is
low.
5 EMPIRICAL EVALUATION
This section describes our experimental results. We
begin by considering myth labeling for different it-
erations of the methodology, focusing on the myth hit
rate. We then compare the myth hit rate for each myth
11
We use positive F1 score to favor true positives and
avoid false positives (rather than false negatives), as is com-
mon in misinformation detection. However, our methodol-
ogy works the same for a different evaluation criterion such
as overall F1 score—though we anticipate this approach
would require more iterations to identify a sufficient num-
ber of true positives.
using both the keywords and the weak learners. This
is followed by an analysis of the results using word
usage entropy.
5.1 Myth Labeling Precision
We begin by comparing the labeling precision of
the dictionary-based sampling and the weak learners
sampling. Fig. 2 shows myth hit rate by sampling
method for the myth categories. Each bar represents
a sampling approach. The x-axis shows the myth cat-
egories and the y-axis the myth hit rate, i.e., the pro-
portion of posts labeled by Mechanical Turk work-
ers that were determined to be about the myth. We
see that with the exception of dictionary sampling for
weather, all of the strategies perform poorly. This was
an indication that the diversity of the myths in the
category had a strong impact on the ability to iden-
tify myth-related posts. The weather myth category
is less diverse than the other categories, perhaps ex-
plaining why the dictionary approach was more suc-
cessful. Given this initial result, we focus the rest of
our empirical evaluation on specific myths and sug-
gest that focusing on myth categories instead of spe-
cific myths may lead to lower myth hit rates than ex-
pected.
Fig. 3 shows the myth hit rate by sampling
method. Once again, each bar represents a sampling
approach. The x-axis shows the myth and the y-axis
the myth hit rate. The 5G, Hydroxychloroquine, and
Mosquitoes myths had high myth hit rates for both
dictionary-based sampling and sampling using weak
learners. Antibiotics performed above 50% for both
sampling strategies. While above 50% is much bet-
ter than the strategies proposed in prior literature, we
hypothesize that the difference between this myth and
the ones that performed better has to do with the myth
specificity. There were discussions in our data set
about drug treatments for COVID-19 that were not
specific to the myth, including discussions about vac-
cinations. Finally, the UV Light myth has a very high
dictionary-based sampling myth hit rate. However,
when building weak classifiers, even though the pos-
itive F1 score was high, it was not able to find sam-
ples for labeling. We hypothesize that this occurred
because the limited training data was insufficient for
building even a weak model that contained new fea-
tures that were as reliable than the dictionary. We ex-
plore this idea in the next section.
5.2 Weak Learner Performance
Focusing on the weak learners, we are interested
in understanding their performance, and whether or
DATA 2023 - 12th International Conference on Data Science, Technology and Applications
70

Figure 2: This plot compares the overall proportion of
tweets labeled by MTurk as being about a given myth cate-
gory for both keyword-based and weak learner sampling.
Figure 3: This plot compares the overall proportion of
tweets labeled by MTurk as being about a given specific
myth for both keyword-based and weak learner sampling.
not they are able to learn different features from the
dictionary-based models. Fig. 4 shows the range of
positive F1 scores for each myth across different iter-
ations of data labeling process. The x-axis is the myth
and the y-axis shows the positive F1 scores. Overall,
the scores are very high across classifiers, typically
ranging from 0.85 to 0.97. The UV Light classifier
has the highest average positive F1 score of 0.965.
The Hydroxychloroquine, Mosquitoes, 5G, and An-
tibiotics myths has mean accuracy scores of 0.951,
0.934, and 0.927, respectively, while the Antiobitics
Figure 4: These boxplots illustrate the range of positive
F1 scores for each myth. The scores displayed include K-
Nearest Neighbors, Decision Tree, Random Forest, Multi-
nomial Naive Bayes, Logistic Regression, and Multi-Layer
Perceptron algorithms for original and retrained models.
myth has lower positive F1 score of 0.884.
Table 2 shows the best performance of the differ-
ent models for each myth.
12
While Random Forest
typically has the highest positive F1 score, Logistic
Regression and Multi-Layer Perceptron also had sim-
ilar positive F1 scores. Therefore, any of them would
be reasonable options, and depending on the data set,
it may be the case that certain models tends to per-
form better in terms of myth hit rate. For example, for
some myths like Hydroxychloroquine, Random Forest
produced samples with lower quality on manual in-
spection. Therefore, we chose to use a different com-
parable model (Logistic Regression). In general, for
our data set, we found that Logistic Regression had a
higher myth hit rate when compared to other models.
We note that myths like UV Light were so spe-
cific that we were not able to pull a large enough
initial sample for successful weak learner sampling.
Even though the F1 score was high, we could not
find examples to label using the weak learners. In
other words, the features identified as important by
the weak learners were not sufficiently present in our
sample to expand our training data set.
Finally, Fig. 5 shows the proportion of positive la-
bels (myth hit rate) and the performance of the weak
12
Table 2 shows the highest scores in bold and abbre-
viates these model names to save space: KNN means k-
Nearest Neighbors, DT means Decision Tree, RF means
Random Forest, MNB means Multinomial Naive Bayes, LR
means Logistic Regression, and MLP means Multi-Layer
Perceptron.
Identifying High-Quality Training Data for Misinformation Detection
71

Table 2: Best positive F1 scores for each myth and model combination.
Myth KNN DT RF MNB LR MLP
5G 0.87 0.96 0.96 0.92 0.94 0.92
Antibiotics 0.81 0.89 0.9 0.83 0.89 0.83
Hydroxychloroquine 0.89 0.99 0.99 0.95 0.98 0.94
Mosquitoes 0.87 0.96 0.96 0.93 0.94 0.92
UV Light 0.91 0.94 0.99 0.97 0.99 0.99
Figure 5: This plot compares the positive F1 score of vari-
ous models to the proportion of positive labels for the sam-
ples they were used to collect. The number next to each
point indicates the iteration of labeling and model training:
“1” indicates models trained using data collected with key-
words, “2” indicates models retrained once with labeled ex-
amples from both sampling approaches, “3” indicates mod-
els retrained twice in this way, and “4” indicates models
retrained three times.
learners across different iterations. The color of each
point indicates the myth and each number represent
the iteration of data collected using a weak learner.
The figure shows very high positive F1 scores for
all models, suggesting that the models are overfit-
ting the data. However, declining positive F1 scores
for the Mosquitoes and 5G myths across training it-
erations suggests that overfitting declines with train-
ing. Moreover, markedly improving myth hit rates
for Mosquitoes and Antibiotics across iterations—a
trend also true but smaller in scale for Antibiotics
and Hydroxychloroquine—also suggests that addi-
tional training decreases overfitting and improves the
models’ ability to accurately identify new cases.
Notably, for all of our data sets, the overall F1
score was comparable to the positive F1 score and the
conclusions drawn are the same.
5.3 Analysis of Findings
We found that weak learning worked well for some
myths, while for others a more targeted dictionary-
based approach containing a small number of seed
words led to better performance capturing the myth
of interest. While we found relatively little variation
in statistical validity—most myths produced models
with F1 scores at 0.90 or higher—myths varied a good
deal in external validity, especially in terms of myth
hit rate. Thus, our workflow uses myth hit rate as
a main heuristic to guide analytical decisions. When
the myth hit rate is high—at least 50% success in cap-
turing new relevant tweets—the process is straightfor-
ward: we use the model to collect new tweets, label
them, and then retrain the model to improve its gener-
alizability. We iterate on this process until we have a
sufficient amount of training data, approximately 500
posts about the myth and 500 not about the myth.
In contrast, when the myth hit rate is low—less
than 50% success in capturing new relevant tweets—
we return to the dictionary-based search. We use the
labeled tweets to expand by adding keywords to the
dictionary, collecting additional tweets using the ex-
panded dictionary, and labeling them.
We found that the performance of our weak
learner varied greatly depending on the contextual
specificity of the words describing the myth. If the
seeds we use or the features we construct have a sin-
gle meaning in the context of our COVID-19 data set,
then the samples we identify for manual labeling will
be of higher quality. In other words, as the number
of contexts associated with the seed words within the
COVID-19 domain increases, we expect noisier sam-
ples (lower myth hit rate) for both sampling strategies.
We measure this intuitive notion using word usage en-
tropy as described in Section 4.
Table 3 shows the word usage entropy for our five
myths. We expect that the lower the entropy, the
higher the myth hit rate will be across all iterations for
both the dictionary-based and weak learner sampling
strategies. We see that this is the case for the Hydrox-
ychloroquine myth, which has the lowest word usage
entropy and also achieved a very high myth hit rate
on the first training iteration (see Fig. 5). Conversely,
DATA 2023 - 12th International Conference on Data Science, Technology and Applications
72

Table 3: Word usage entropy for myths.
Myth Word usage entropy
Hydroxychloroquine 0
Mosquitoes 2
5G 2
UV Light 2
Antibiotics 4.75
we expect that the higher the word usage entropy,
the more iterations of both dictionary-based and weak
learner sampling will be necessary to get a sufficient
number of high-quality labels and the lower the myth
hit rate will be in earlier iterations. In this case, more
dictionary sampling may be needed to build a reason-
able weak learner. The Antibiotics myth exemplifies
such high-entropy myths: it has the highest word us-
age entropy here and also the lowest overall myth hit
rate for both sampling strategies (see Fig. 5).
As our examples illustrate, differences in word us-
age entropy can help researchers understand the com-
plexity of their labeling task and thus the number of
training iterations required for our proposed method-
ology to deliver high-quality training data.
6 CASE STUDY
Ultimately, our goal in collecting and labeling Twit-
ter posts is to understand the amount of conversa-
tion taking place about a given set of myths. Us-
ing the machine learning classifiers iteratively trained
on our COVID-19 myths, here we track the preva-
lence of three of them: 5G, Hydroxychloroquine and
Antibiotics. We use our models to predict the men-
tion of each myth in over 20 million original English
tweets, excluding quotes and retweets. Because many
of our myths emerged in April or May 2020 along-
side COVID-related shelter-in-place orders, we ob-
serve the three selected myths starting in April 2020
and continue through August 2020.
Fig. 6 shows that a surprising proportion of tweets
contain these three myths. On a daily basis, at least
1.8% of tweets in our data contained one or more
of these myths, with a peak of 6.9% and an aver-
age of 3.4%. In other words, we find that tweets
related to these few myths alone comprise 2-7% of
the COVID-19 related conversation on Twitter in the
middle half of 2020. Given that many more myths
exist than we test here, our results suggest that a sig-
nificant amount of poor-quality information was be-
ing discussed about COVID-19 during that time pe-
riod. Such discussion does not imply endorsement.
Indeed, an important topic for future work is to de-
termine post-level stance toward myths (whether sup-
porting or refuting) in those social media posts that
engage them.
To demonstrate how our estimates of myth preva-
lence relate to political and/or online events that may
have influenced their spread, we investigate the myth
that was most common—with a daily average of 1.4%
of tweets mentioning this myth, compared to 1.1%
for antibiotics and 0.92% for 5G—and seems to fluc-
tuate most: hydroxychloroquine. Fig. 7 shows the
daily number of tweets containing this myth over
time. The surges in discussion around this myth cor-
respond to statements or posts made by former Pres-
ident Trump and other prominent Republicans. For
example, in a March 19 press briefing, former Pres-
ident Trump advocates for hydroxychloroquine as a
COVID-19 treatment (Liptak and Klein, 2020). On
March 28, the FDA provides emergency approval of
the drug for this purpose (Caccomo, 2020) and Gov-
ernor Ron DeSantis announces a massive order of
the drug for Florida hospitals (Morgan, 2020). In
an April 5th press briefing, Trump asserts hydroxy-
chloroquine “doesn’t kill people” and “what do we
have to lose?” (Cathey, 2020). In mid-May, Trump
announces he’s been taking hydroxychloroquine for
“about a week and a half” with “zero symptoms”
(Cathey, 2020; Karni and Thomas, 2020). Finally,
Trump retweets a conservative-backed video of doc-
tors promoting hydroxychloroquine as a COVID-19
“cure” on July 28—the same day that Anthony Fauci
tells Good Morning America the drug is “not effec-
tive” (Funke, 2020; Cathey, 2020).
The alignment between spikes in our estimates
of the hydroxychloroquine myth’s prevalence, on the
one hand, and politically salient events, on the other,
supports the robustness of our results and the valid-
ity of our method for identifying and labeling high-
quality training data.
7 CONCLUSIONS
Our methodology combines keyword dictionary-
based searches and weak learner predictions to gen-
erate high-quality labeled data for training machine
learning models. Our goal is to minimize costly man-
ual labeling and optimize the myth hit rate when iden-
tifying myths in social media discussion, improving
efficiency in terms of both human and computational
resources. Indeed, while previous studies detected
misinformation in large COVID-19-related data sets
from 15% to 40% of the time (Cui and Lee, 2020;
Hayawi et al., 2022; Hossain et al., 2020), the myth
hit rate in our iterative method ranges from 60% to
100% for specific myths (see Fig. 3). Our findings
Identifying High-Quality Training Data for Misinformation Detection
73
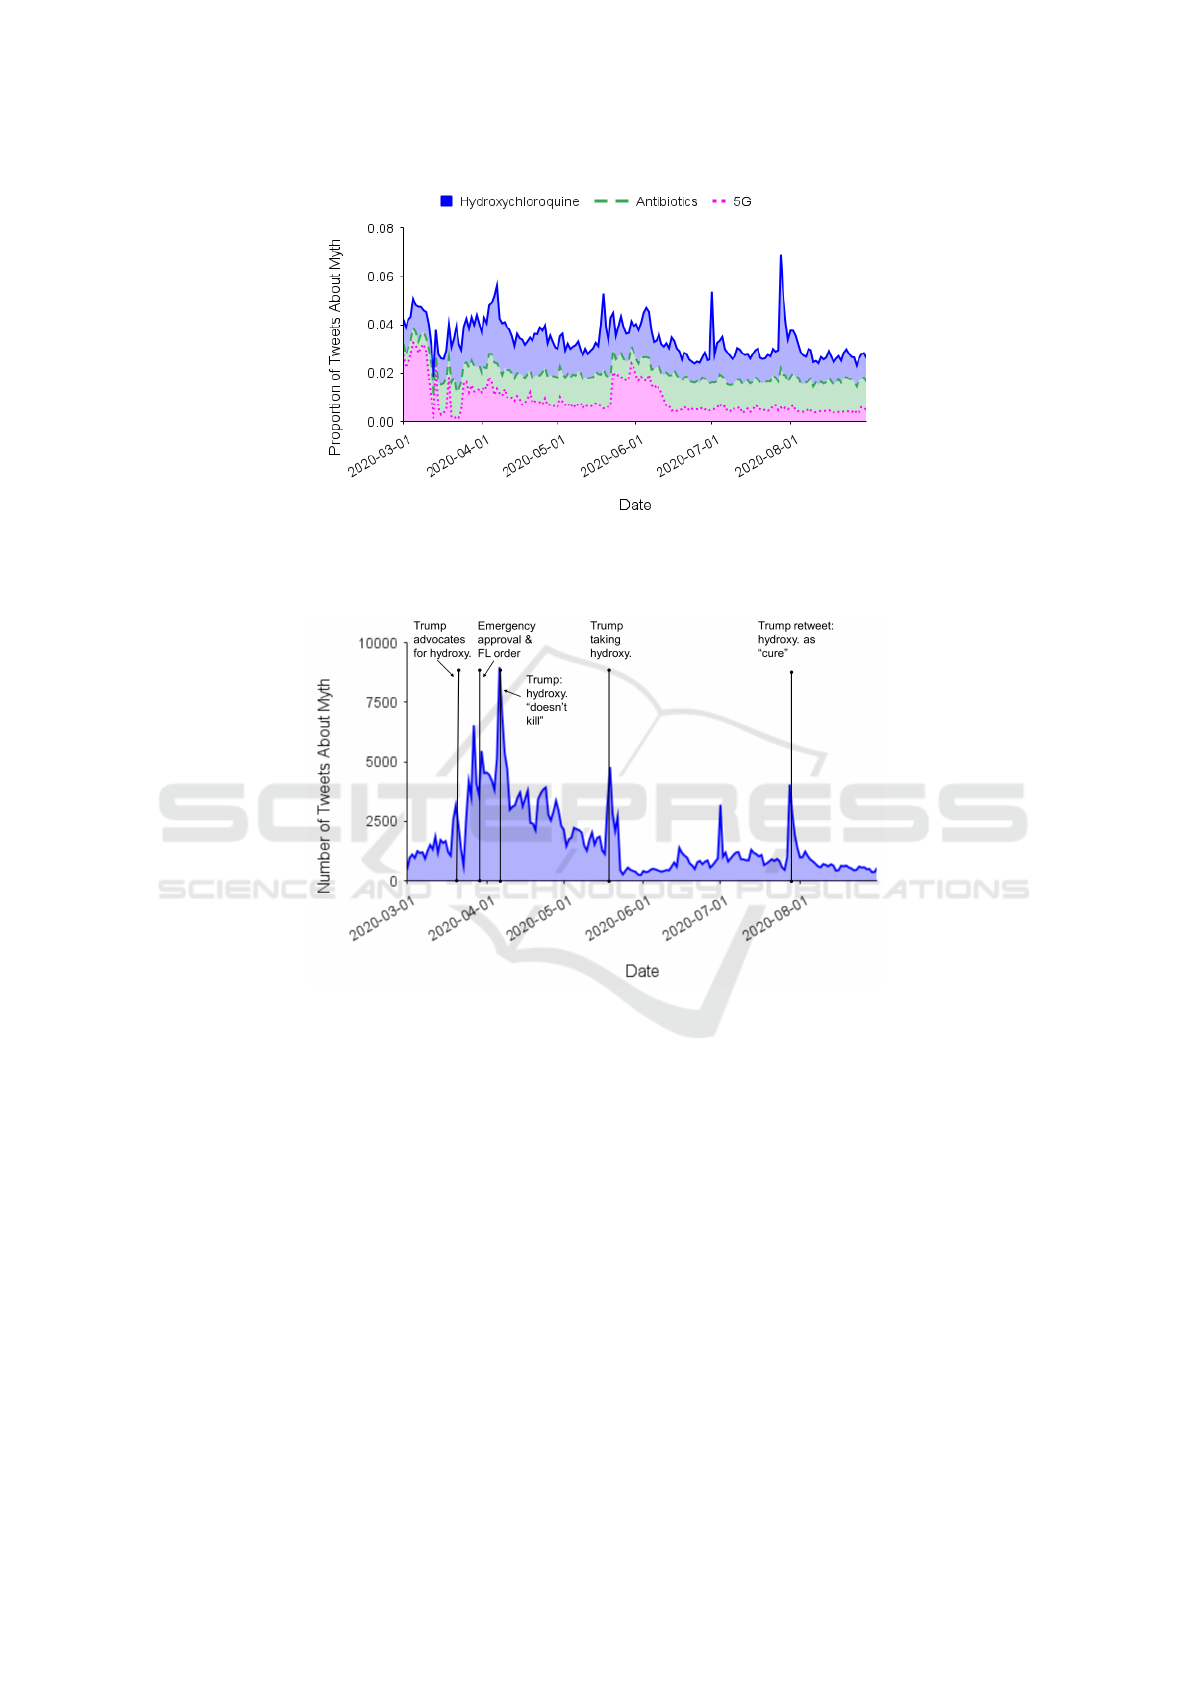
Figure 6: This graph shows the daily ratio of tweets related to the Hydroxychloroquine, Antibiotics, and 5G myths. We used
the machine learning model trained for each myth to classify tweets as being about that myth or not. To calculate each daily
ratio, our numerator is the number of tweets the model predicts are more likely to be about the myth than not, while our
denominator is the total number of tweets in our COVID-19 Twitter data set for that day.
Figure 7: This graph shows the daily volume of tweets related to the Hydroxychloroquine myth. We used the machine learning
model trained for this myth to classify tweets as mentioning it or not.
of several myths’ prevalence over time suggest that
conversation about myths is commonplace, and we
support the robustness of our estimates by showing
their sensitivity to high-profile political and/or online
events. In addition, our method can be easily adapted
to track different kinds of misinformation-related dis-
cussion through consideration of our proposed metric,
word usage entropy.
Given that new topics of misinformation are com-
monplace and spread quickly, we hope our workflow
will help researchers identify and label myths in so-
cial media in other misinformation domains, includ-
ing politics, other public health issues like vaccine
hesitancy and reproductive rights, and previous pan-
demics like HIV/AIDS. Our study suggests that our
approach for tracking emerging myths is less costly
and more efficient than randomly sampling posts for
labeling. However, given that our dictionary-based
sampling approach iteratively expands the initial dic-
tionary with additional keywords identified during
data labeling, we acknowledge that there is a bias
toward precise estimates of seed terms and against
coverage of unexpected terms. While we focus on
precise detection of emerging misinformation, future
work should investigate this trade-off between preci-
sion and coverage in terms of dictionary development.
Future work can also improve on our methodology by
integrating our methods into database searches and
extending the methodology to incorporate database
query and indexing strategies. Finally, exploring
other ways of modeling myth specificity and other
forms of lexical variability that shape the optimal ap-
proaches for identifying examples of various myths is
another important direction. Replicating this type of
DATA 2023 - 12th International Conference on Data Science, Technology and Applications
74

study is important for advancing our understanding of
how best to find and label training data in noisy envi-
ronments like social media.
ACKNOWLEDGEMENTS
We would like to thank the staff of the Massive Data
Institute and the members of the Georgetown Uni-
versity DataLab for their support. We also thank the
anonymous reviewers for giving detailed and thought-
ful reviews.
REFERENCES
Ahmed, W., Vidal-Alaball, J., Downing, J., and Segu
´
ı, F. L.
(2020). Covid-19 and the 5G conspiracy theory: So-
cial network analysis of Twitter data. Journal of Med-
ical Internet Research, 22(5):e19458.
Allcott, H., Gentzkow, M., and Yu, C. (2019). Trends in the
diffusion of misinformation on social media. Research
& Politics, 6(2).
Barthel, M., Mitchell, A., and Holcomb, J. (2016). Many
Americans believe fake news is sowing confusion.
https://www.pewresearch.org/journalism/2016/12/
15/many-americans-believe-fake-news-is-sowing-
confusion/. Accessed: 2022-05-27.
Beaulieu, M., Gatford, M., Huang, X., Robertson, S.,
Walker, S., and Williams, P. (1997). Okapi at trec-5.
Nist Special Publication SP, pages 143–166.
Bode, L., Budak, C., Ladd, J. M., Newport, F., Pasek, J.,
Singh, L. O., Soroka, S. N., and Traugott, M. W.
(2020). Words that matter: How the news and social
media shaped the 2016 presidential campaign. Brook-
ings Institution Press.
Bode, L. and Vraga, E. K. (2015). In related news, that
was wrong: The correction of misinformation through
related stories functionality in social media. Journal
of Communication, 65(4):619–638.
Bozarth, L. and Budak, C. (2020). Toward a better perfor-
mance evaluation framework for fake news classifica-
tion. In Proceedings of the International AAAI Con-
ference on Web and Social Media.
Budak, C., Agrawal, D., and El Abbadi, A. (2011). Limiting
the spread of misinformation in social networks. In
Proceedings of the International Conference on World
Wide Web.
Caccomo, S. (2020). Coronavirus (COVID-19) update:
Daily roundup March 30, 2020. U.S. Food and Drug
Administration (FDA) Press Announcements.
Cathey, L. (2020). Timeline: Tracking Trump alongside
scientific developments on hydroxychloroquine. ABC
News.
Coleman, A. (2021). ’hundreds dead’ because of covid-19
misinformation. https://www.bbc.com/news/world-
53755067. Accessed: 2022-05-17.
Cui, L. and Lee, D. (2020). Coaid: Covid-19
healthcare misinformation dataset. arXiv preprint
arXiv:2006.00885.
Das Bhattacharjee, S., Talukder, A., and Balantrapu, B. V.
(2017). Active learning based news veracity detection
with feature weighting and deep-shallow fusion. In
2017 IEEE International Conference on Big Data (Big
Data), pages 556–565.
EUvsDisinfo (2020). EEAS Special Report up-
date: Short assessment of narratives and dis-
information around the COVID-19 pandemic.
https://euvsdisinfo.eu/eeas-special-report-update-
short-assessment-of-narratives-and-disinformation-
around-the-covid19-pandemic-updated-23-april-18-
may/.
Funke, D. (2020). Don’t fall for this video: Hydroxychloro-
quine is not a COVID-19 cure. https://www.politifact.
com/factchecks/2020/jul/28/stella-immanuel/dont-
fall-video-hydroxychloroquine-not-covid-19-cu/.
Accessed: 2022-05-17.
Grinberg, N., Joseph, K., Friedland, L., Swire-Thompson,
B., and Lazer, D. (2019). Fake news on Twitter
during the 2016 US presidential election. Science,
363(6425):374–378.
Grootendorst, M. (2021). KeyBERT: Minimal keyword ex-
traction with BERT. https://doi.org/10.5281/zenodo.
4461265. v. 0.1.3.
Guo, B., Ding, Y., Yao, L., Liang, Y., and Yu, Z. (2020). The
future of false information detection on social media:
New perspectives and trends. ACM Computing Sur-
veys, 53(4):1–36.
Haber, J., Singh, L., Budak, C., Pasek, J., Balan, M., Calla-
han, R., Churchill, R., Herren, B., and Kawintira-
non, K. (2021). Research note: Lies and presidential
debates: How political misinformation spread across
media streams during the 2020 election. Harvard
Kennedy School Misinformation Review.
Hasan, M. S., Alam, R., and Adnan, M. A. (2020). Truth
or lie: Pre-emptive detection of fake news in differ-
ent languages through entropy-based active learning
andm ulti-model neural ensemble. In 2020 IEEE/ACM
International Conference on Advances in Social Net-
works Analysis and Mining, pages 55–59. ISSN:
2473-991X.
Hayawi, K., Shahriar, S., Serhani, M. A., Taleb, I., and
Mathew, S. S. (2022). ANTi-Vax: a novel Twitter
dataset for covid-19 vaccine misinformation detec-
tion. Public Health, 203:23–30.
Heidari, M. and Jones, J. H. (2020). Using BERT to ex-
tract topic-independent sentiment features for social
media bot detection. In Proceedings of the IEEE An-
nual Ubiquitous Computing, Electronics Mobile Com-
munication Conference.
Helmstetter, S. and Paulheim, H. (2018). Weakly super-
vised learning for fake news detection on Twitter.
In 2018 IEEE/ACM International Conference on Ad-
vances in Social Networks Analysis and Mining.
Hossain, T., Logan IV, R. L., Ugarte, A., Matsubara, Y.,
Young, S., and Singh, S. (2020). COVIDLies: Detect-
ing COVID-19 misinformation on social media. In
Identifying High-Quality Training Data for Misinformation Detection
75

Proceedings of the Workshop on NLP for COVID-19
(Part 2) at EMNLP.
Karni, A. and Thomas, K. (2020). Trump says he’s taking
hydroxychloroquine, prompting warning from health
experts. The New York Times.
Kawintiranon, K. and Singh, L. (2021). Knowledge en-
hanced masked language model for stance detection.
In Proceedings of the Conference of the North Amer-
ican Chapter of the Association for Computational
Linguistics: Human Language Technologies.
Kawintiranon, K. and Singh, L. (2023). DeMis: Data-
efficient misinformation detection using reinforce-
ment learning. In Proceedings of the European
Conference on Machine Learning and Principles
and Practice of Knowledge Discovery in Databases
(ECML-PKDD), pages 224–240. Springer.
Kucher, K., Martins, R. M., Paradis, C., and Kerren, A.
(2020). StanceVis Prime: Visual analysis of sentiment
and stance in social media texts. Journal of Visualiza-
tion, 23(6):1015–1034.
Kumar, S. and Shah, N. (2018). False information on web
and social media: A survey. CRC Press.
Liptak, K. and Klein, B. (2020). Trump says FDA will fast-
track treatments for novel coronavirus, but there are
still months of research ahead. CNN.
Ma, J., Gao, W., Mitra, P., Kwon, S., Jansen, B. J., Wong,
K.-F., and Cha, M. (2016). Detecting rumors from mi-
croblogs with recurrent neural networks. In Proceed-
ings of the International Joint Conference on Artificial
Intelligence.
Maragakis, L. and Kelen, G. D. (2021). COVID-19—myth
versus fact. https://www.hopkinsmedicine.org/health/
conditions-and-diseases/coronavirus/2019-novel-
coronavirus-myth-versus-fact.
McGlynn, J., Baryshevtsev, M., and Dayton, Z. A. (2020).
Misinformation more likely to use non-specific au-
thority references: Twitter analysis of two covid-19
myths. Harvard Kennedy School Misinformation Re-
view, 1(3).
Morgan, I. (2020). Florida orders controver-
sial anti-malaria drug touted by President
Trump as treatment for COVID-19. https:
//floridaphoenix.com/2020/03/28/florida-orders-
controversial-anti-malaria-drug-touted-by-president-
trump-as-treatment-for-covid-19/.
Nielsen, D. S. and McConville, R. (2022). MuMiN: A
large-scale multilingual multimodal fact-checked mis-
information social network dataset. In Proceedings of
the International ACM SIGIR Conference on Research
and Development in Information Retrieval.
Oyeyemi, S. O., Gabarron, E., and Wynn, R. (2014). Ebola,
Twitter, and misinformation: a dangerous combina-
tion? Bmj, 349.
Pedregosa, F., Varoquaux, G., Gramfort, A., Michel, V.,
Thirion, B., Grisel, O., Blondel, M., Prettenhofer, P.,
Weiss, R., Dubourg, V., et al. (2011). Scikit-learn:
Machine learning in Python. Journal of Machine
Learning Research, 12:2825–2830.
Reimers, N. and Gurevych, I. (2019). Sentence-bert: Sen-
tence embeddings using siamese bert-networks. In
Proceedings of the Conference on Empirical Methods
in Natural Language Processing.
Shannon, C. E. (1951). Prediction and entropy of printed
english. Bell System Technical Journal, 30(1):50–64.
Shao, C., Ciampaglia, G. L., Varol, O., Yang, K., Flam-
mini, A., and Menczer, F. (2018). The spread of
low-credibility content by social bots. Nature Comm.,
9(1):1–9.
Shu, K., Sliva, A., Wang, S., Tang, J., and Liu, H. (2017).
Fake news detection on social media: A data mining
perspective. ACM SIGKDD Explorations Newsletter,
19(1):22–36.
Singh, L., Bode, L., Budak, C., Kawintiranon, K., Padden,
C., and Vraga, E. (2020). Understanding high- and
low-quality URL sharing on covid-19 Twitter streams.
Journal of Comp. Social Science, 3(2):343–366.
Vosoughi, S., Roy, D., and Aral, S. (2018). The spread of
true and false news online. Science, 359(6380):1146–
1151.
Wang, Y., Yang, W., Ma, F., Xu, J., Zhong, B., Deng, Q.,
and Gao, J. (2020). Weak supervision for fake news
detection via reinforcement learning. In Proceedings
of the AAAI Conference on Artificial Intelligence.
Weinzierl, M. and Harabagiu, S. (2022). Identifying
the adoption or rejection of misinformation targeting
covid-19 vaccines in Twitter discourse. In Proceed-
ings of the ACM Web Conference.
WHO (2021). Steps towards measuring the burden of info-
demics. In Infodemic Management Conference. World
Health Organization.
WHO (2022). Coronavirus disease (COVID-
19) advice for the public: Mythbusters.
https://www.who.int/emergencies/diseases/novel-
coronavirus-2019/advice-for-public/myth-busters.
Yang, F., Pentyala, S. K., Mohseni, S., Du, M., Yuan, H.,
Linder, R., Ragan, E. D., Ji, S., and Hu, X. (2019).
XFake: Explainable fake news detector with visual-
izations. In Proceedings of the International Confer-
ence on World Wide Web. Association for Comp. Ma-
chinery.
Zhang, T., Kishore, V., Wu, F., Weinberger, K. Q., and
Artzi, Y. (2019). BERTScore: Evaluating text gener-
ation with BERT. In Proceedings of the International
Conference on Learning Representations.
DATA 2023 - 12th International Conference on Data Science, Technology and Applications
76
