
Detection of Drowsy Driving Using Wearable Sensors
Duarte Pereira
1
, Brigida Monica Faria
2,3 a
and Luis Paulo Reis
1,3 b
1
Faculty of Engineering, University of Porto (FEUP), Rua Dr. Roberto Frias, sn, 4200-465 Porto, Portugal
2
ESS, Polytechnic of Porto (ESS-P.PORTO), Rua Dr. Antonio Bernardino de Almeida, 400 4200 - 072 Porto, Portugal
3
Artificial Intelligence and Computer Science Laboratory (LIACC- Member of LASI LA),
Rua Dr. Roberto Frias, sn 4200-465 Porto, Portugal
Keywords: Sleep Prevention, Driving Simulation, Biosignal Acquisition, Signal Processing.
Abstract: Drowsy driving is one of the leading causes of traffic accidents. Some solution provides feedback when the
driver is drowsy, however, few tackle the issue in a way that allows for portability and early prevision. This
study focuses on drowsiness detection during driving. Wearable sensors are used, for a low-cost, portable,
automated, and non-intrusive solution. The wearable sensors chosen for biosignal acquisition are Empatica's
E4 wristband for heart activity acquisition and Brainlink Pro for brain activity. Features were mainly in the
time domain and time-frequency, and algorithms, such as Nearest Neighbours, Radial Basis Function, Support
Vector Machine, Decision Tree, Random Forest, Multi-layer Perceptron, Naive Bayes, and Logistic
Regression were trained and validated through the use of a database developed for this study (11 adults with
normal last-night sleep, and 2 without any last-night sleep). Participants answered Pittsburgh, and Satisfaction,
Alertness, Timing, Efficiency and Duration questionnaires, after which photoplethysmography and
electroencephalography physiological signals were acquired during driving in a simulation environment. The
practice-run discrimination and individual classification had comparable results, both slightly above average
(70 to 80%). The evaluation metric values showed that the discrimination of sleep-deprived exams yielded
significantly better. This suggests that the proposed methodology is capable of classifying sleep deprivation
and surpasses existing ones in its portability.
1 INTRODUCTION
In a growing society, sleep restrictions have a
negative impact and risks from multiple factors.
Driving activity places highly complex perceptual,
physical, and cognitive demands on the driver
(Sawyer et al., 2012). According to the American
Academy of Sleep Medicine (Moser, 2009), being
awake for at least 18 hours is the same as someone
having a blood alcohol content (BAC) of 0.05%,
while being awake for at least 24 hours is equal to
having a blood alcohol content of 0.10%. This is
higher than the legal limit (0.08% BAC) in the USA.
Therefore, methods for detecting sleepiness in driving
are under investigation, with promising results. It is
widely known that monotonous or nighttime driving
for long periods often lowers driving performance
significantly. This contributes to it being one of the
a
https://orcid.org/0000-0003-2102-3407
b
https://orcid.org/0000-0002-4709-1718
leading causes of injuries and deaths from traffic
accidents each year (Lin et al., 2014). Even though a
third of our life is spent sleeping (Mancia, 1993),
sleeping disorders are very common. 15 to 35% of the
adult population complain of sleep quality
disturbance (Breslau et al., 1996). Sleep disturbances
are also related to higher rates of depression, anxiety
disorders, alcohol abuse, or drug abuse. To measure
sleep quality, subjective methodologies can be used,
predominately through questionnaires. However,
these methods are not enough, since they rely on the
self-awareness and honesty of the subject. Then,
objective measurements of sleep are required and thus
enter polysomnography (PSG). These tests tend to be
made in a specialized facility overnight. To find a
response to drowsy driving, a change of paradigms is
necessary, in which methods for sleep evaluation
need to be substituted for the automatic detection of
sleep disturbances or chronic sleep deprivation. This
414
Pereira, D., Faria, B. and Reis, L.
Detection of Drowsy Driving Using Wearable Sensors.
DOI: 10.5220/0012089900003541
In Proceedings of the 12th International Conference on Data Science, Technology and Applications (DATA 2023), pages 414-421
ISBN: 978-989-758-664-4; ISSN: 2184-285X
Copyright
c
2023 by SCITEPRESS – Science and Technology Publications, Lda. Under CC license (CC BY-NC-ND 4.0)

can be achieved by integrating algorithms that also
classify the circadian rhythm of a subject. A low-cost,
portable, and non-intrusive solution is ideal, to
facilitate everyday usage. The project Sono ao
Volante 2.0 (Rodrigues et al., 2021) with the main
objective of developing a prototype of an integrated
data system that is non-intrusive and low-cost, allows
sleep prevision while driving and detects disturbances
or chronic sleep deprivation.
2 BACKGROUND
The contribution from this study focuses on the use of
wearable sensors and intelligent algorithms, to
conceive in detail the functional and technical
architecture of a low-cost, non-intrusive and portable
system for the detection of drowsy driving episodes.
Therefore, concepts in sleep evaluation, driving
monitoring, driving simulation, and signal processing
practices must be reviewed.
2.1 Sleep Evaluation
Sleep evaluation typically involves monitoring and
assessing an individual’s sleep patterns and quality.
This can be done using subjective and objective
measures. Alertness and reaction time vary according
to the circadian rhythm, which makes it an important
factor in this study. Living cells in animals have
rhythmic variations in their function on a circadian
cycle (Barret et al., 2019). If they are entrained, this
process usually coincides with day-night light cycles
in the environment. If they are not entrained, they
become asynchronous from the light-dark cycle. The
entrainment process is dependent on the
suprachiasmatic nuclei, located above the optic
chiasm, bilaterally. The sleep-wake cycle and the
secretion of the pineal hormone melatonin are reliant
on neurohormonal signals that participate in this
entrainment. According to (Leung and Martinez,
2020), circadian rhythm biomarkers include cortisol
levels, peak expiratory flow, blood lipids, DNA
damage, lipid peroxidation, protein oxidation,
antioxidants, white blood cell counts, estradiol,
progesterone, follicle-stimulating hormone, body
temperature, blood pressure, and muscle strength.
Cellular responses include inflammatory response
and cellular trafficking, while some affected
molecular processes include oxidative stress
responses, DNA methylation, and histone
modification. Only signals which are measured
during polysomnography exams are considered.
2.1.1 Subjective Methods
Pittsburgh Quality Index (PSQI) Questionnaire is one
of the most used questionnaires for sleep quality
assessment (Mollayeva et al., 2016). The PSQI
insides on sleep quality during the previous month
(Buysse et al., 1989). This provides information about
the night-to-night variations occurring in sleep
quality, as well as the duration, frequency, and
severity of abnormal behaviour duration and
frequency over a long period. The PSQI is constituted
of 19 self-rated questions and 5 questions rated by the
bed partner or roommate. The self-rated questions
focus on a vast quantity of factors relating to sleep
quality, such as sleep duration, latency, frequency,
and severity estimated for each specific sleep issue.
The 19 items are grouped into 7 component scores,
each weighted from 0 to 3. The seven scores are then
added to each other to obtain the global PSQI score,
with a range of 0-21. Higher scores are associated
with worse sleep quality. The 7 components of the
PSQI are subjective sleep quality, sleep duration,
sleep latency, usual sleep efficiency, sleep
disturbances, use of sleeping medications, and
daytime dysfunction. Satisfaction, Alertness, Timing,
Efficiency and Duration (SATED) Questionnaire is a
more recent and reliable approach to subjective sleep
quality assessment, SATED evaluates five
dimensions of sleep health: 1) satisfaction, 2)
alertness while awake, 3) timing, 4) efficiency, and 5)
duration. Objective measures can be obtained from
every level, excluding satisfaction (Benítez et al.,
2020). The total score ranges from 0 to 10 points,
from worst to best sleep quality, respectively.
2.1.2 Polysomnography and
Electroencephalography
Polysomnography (PSG) plays a critical role in
confirming suspicions found in more subjective
exams and helps guide further diagnosis of sleep
disorders (Chokroverty and Bhat, 2014). PSG
consists of the overnight recording of various
physiological characteristics during sleep. These
recordings allow evaluation of sleep stages, alertness,
cardio-circulatory functions, respiration, and body
movements. Electroencephalography (EEG),
electrooculography (EOG), and electromyography
(EMG) applied to the chin area are of particular
interest for sleep staging (Berry, 2012).
Detection of Drowsy Driving Using Wearable Sensors
415

2.2 Wearable Signal Acquisition
User-acceptable and reliable EEG devices for real-
time monitoring are still a challenging proposition
(Lin et al., 2014). Data acquisition from most EEG
recording techniques requires skin preparation and
conductive gel to reach optimal electrical
conductivity at the interface. These procedures can be
slow at the time of application and uncomfortable.
Also, the gel may have to be reapplied, since the
reading decays in quality as the gel dries out.
Therefore, the EEG system needed must be a dry-
electrode, both wearable and wireless, facilitating
prolonged and portable use. The system must also be
able to capture the required brain signals for assessing
wakefulness and sleep stages. According to (LaRocco
et al., 2020), some promising consumer EEG
wearable headsets with Bluetooth compatibility
include InteraXon Muse, Neurosky Mindwave,
OpenBCI, Emotiv Epoc and Insight. Even though
there is a decent amount of commercial headsets
available in the market, a large portion of them lacks
the number of electrodes since they are more targeted
for focus, relaxation, or gaming purposes. The ones
with the better characteristics are Emotiv EPOC and
Open BCI, but the price of the latter exceeds most
consumer capabilities. Therefore, Emotiv EPOC
seems to be the best candidate, as it offers a wide
range of electrodes, which allow the recording of
signals from different brain regions, all at an
accessible price counting that the shipping taxes do
not increase the cost too much. Regarding Brainlink
Pro, it can be of interest to the proposed solution,
since the Fp1-Fp2 channel has been used in literature
for sleep stage scoring, nominally (Lucey et al.,
2016). This study obtained a poor sensitivity of 0.2
for stage N1 due to the lack of occipital electrodes.
The study also found that sleep latency and REM
onset latency readings were compromised relatively
to the PSG diagnosis, as well as sleep disturbance
detection (e.g., sleep apnea). However, a strong and
substantial agreement ratio with PSG measurements
of 67% was verified overall, having particularly
found that REM assessment, combined with N2 and
N3 sleep and frontal slow wave activity can be well
assessed through single-channel means. However,
this study did not use automatic means for sleep
classification, which introduced subjective factors,
due to the use of a limited number of human EEG
scorers, biased for standard PSG analysis. The
Empatica E4 wristband has been the target of study
for ECG applications that depend on heart rate (HR)
measurements, with promising results (Ollander et
al., 2016) (Milstein and Gordon, 2020) (McCarthy et
al., 2016). The wristband derives heart rate variability
(HRV) from Blood Volume Pressure (BVP), which is
another designation for PPG. These studies also
include electrical conductivity in the skin, peripheral
skin temperature, and motion-based activity.
Additionally, the E4 possesses internal memory that
allows for recording of up to 36 hours, with a USB
connection to a device needed to recover the data; or
a Bluetooth streaming mode that allows for
visualization of data in real-time. After recording, the
data can be uploaded to the Empatica cloud service
and visualized or imported through a web dashboard.
2.3 Signal Processing
The general structure found in Machine Learning
(ML) systems for automatic sleep staging follows the
phases of pre-processing, feature extraction, and
classification. Initially, the user’s biosignals are
recorded, followed by, a pre-processing stage, which
includes filtering and artefact removal for signal
enhancement. The resulting signals finally suffer
feature extraction to return useful attributes for the
classification stage (Aboalayon et al., 2016) (van
Wouwe et al., 2011) (Guillodo et al., 2018). Some
systems also include dimension reduction and feature
selection, to generate new features with low
dimensions derived from the input features.
3 METHODOLOGY
The proposed solution can provide human driver
interaction with digital devices in the vehicle by
translating the different biosignals into a diagnosis of
sleep deprivation. The system flow consists of signal
acquisition, followed by data processing, which
includes pre-processing, feature extraction, feature
selection and classification.
3.1 Experimental Setup and Procedure
The study was non-probabilistic and conducted
during the morning, throughout two work weeks.
Subjects were young adults and a driver’s license was
mandatory. In the first session, subjects are asked
how many hours of sleep they had the previous night.
Non-sleep-deprived participants are asked if they
want to leave their contact information for the
scheduling of a non-mandatory second session, in
which they are sleep-deprived. Participants answer
both the Pittsburgh and SATED questionnaires
during the first session. Volunteers read and sign an
agreement of consent.
DATA 2023 - 12th International Conference on Data Science, Technology and Applications
416
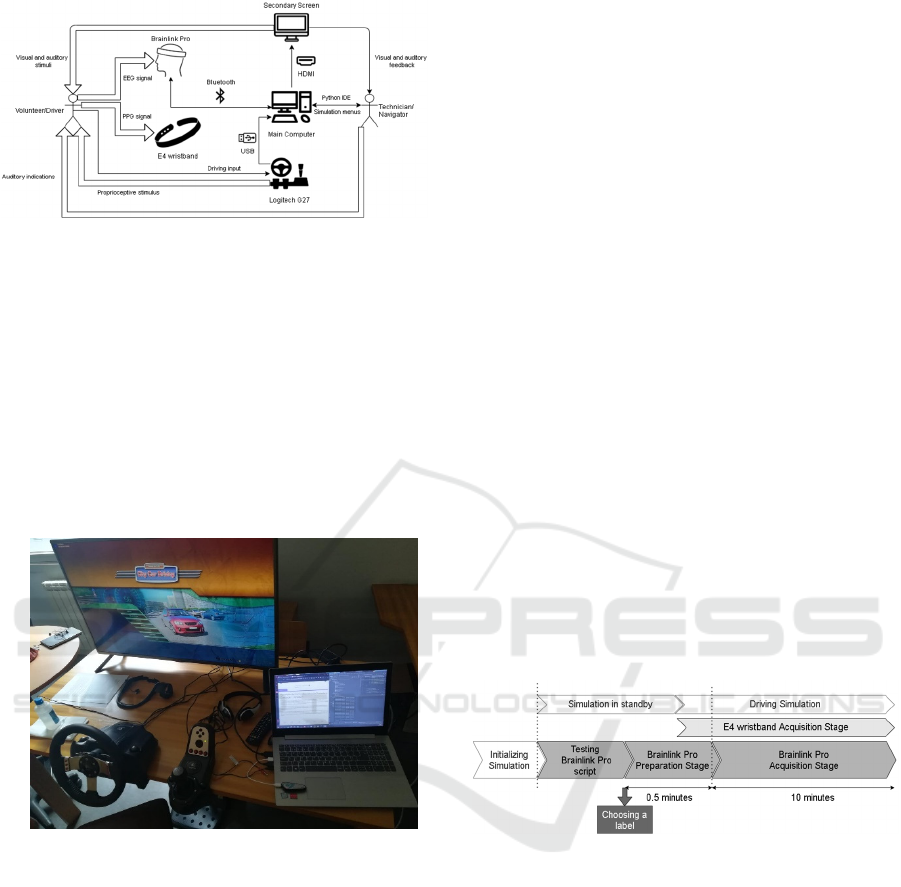
Figure 1: Experimental setup.
The Logitech G27 driving wheel, gearbox, and
pedals are connected via USB to the main computer,
with Logitech’s Gaming Software Profiler running
the default calibration sequence (Figure 1). The wheel
provides proprioceptive feedback during simulation.
A dual display screen is set up (Figure 2), with the
larger one presenting the simulation environment to
the volunteer and technician, and the smaller one
presenting the script and a real-time raw EEG signal
graph to the technician. The secondary screen is
connected to the main computer via HDMI.
Figure 2: Experimental scenario setup.
Sequentially, a practice run and an exam run are
performed, both with a 10-minute duration and within
the same route. The practice run serves as a way for
the volunteers to get used to the simulation-specific
conditions, such as controls, as well as the route itself.
Signal acquisition is performed during both runs. For
both runs, the City Car Driving simulation software is
run, and the free driving option and European Union
traffic regulations are selected. To reduce the number
of stressful situations presented to the subjects as well
as sources of distraction, the optional settings are set
to low traffic density (20%), quiet traffic, 0%
pedestrian density, default vehicle, spring, clean
weather, daytime, violation pop-ups disabled, fuel
consumption, radio, and emergencies disabled. The
view is locked in the first person. The route is the
same for every run, to limit route-dependent
variables, such as the number of turns and stops the
volunteer would be required to make. It is also
designed to last more than the acquisition’s 10-minute
duration, as well as to provide a wide range of driving
situations to volunteers (e.g., roundabouts, traffic
lights, highway segments). The run finishes when
Brainlink Pro’s script ended, regardless of where the
subject is in the route. E4 wristband acquisition is
finished manually soon after.
3.2 Data Acquisition
Before initializing the exams, Brainlink Pro’s
acquisition is tested, to guarantee connection and
stable acquisition. The technician inputs the desired
label, with the following 30 seconds corresponding to
the preparation stage, in which no signal is acquired
nor recorded. Afterwards, the 10-minute acquisition
is initiated (Figure 3), with a sampling rate of 60Hz,
in which the timestamp, raw EEG, blink, attention,
meditation, delta, high-alpha, high-beta, low-alpha,
low-beta, low-gamma, mid-gamma and theta are
recorded into a .csv file. For this study, only the raw
EEG signal is used, due to the low frequency found
in other possibly useful signals. Upon the end of the
10 minutes, the new label is appended into a
Labels.csv file, with both the filename and the
corresponding label.
Figure 3: Acquisition sequence for each run (2 times, for
practice and exam). The white blocks represent simulation-
related activities, the dark-grey blocks represent Brainlink
Pro script-based activities, and the light-grey block
represents E4 wristband activity.
Regarding E4 wristband acquisition, this is
performed via E4’s inbuilt recording feature. The
acquisition is initiated during Brainlink Pro script’s
preparation stage. At the end of Brainlink Pro’s script,
the acquisition is stopped manually. Later, the E4
wristband is connected to a computer via USB, where
recorded sessions are uploaded to Empatica’s cloud
via the E4 manager software. Synced sessions can be
searched by date, time and duration, as well as
visualized and imported from the E4 connect website.
The imported .zip file, corresponding to the desired
session, contains a .csv for each of Empatica’s
Detection of Drowsy Driving Using Wearable Sensors
417

recorded signals: accelerometer, blood volume
pressure (BVP), electrodermal activity, heart rate,
interbeat interval and temperature. Each file also
includes the sampling rate for the respective signal in
the first line. For the purposes of this study, only
BVP, with the PPG signal, is used.
3.3 Signal Processing Methods
For this study, the signal processing algorithms were
performed through Python 3.7, with the PyCharm
IDE and proper libraries for data pre-processing,
feature extraction, feature selection, classification
and evaluation metrics. Three optional classification
experiment modes were selected: Practice Run
Discrimination (in which the labels are “Practice” or
“Exam”), Individual Classification (in which the
labels are “Individual” or “Other”) and Sleep
Deprivation Detection (in which the labels are “Exam
SD”, for sleep-deprived exams, or “Exam”, for non-
sleep deprived exams).
3.3.1 Pre-Processing
Before pre-processing can be applied, the data from
obtained from the two sensors (BVP/PPG from the E4
wristband and raw EEG from Brainlink Pro) must be
synced time-wise. Following time syncing, the
signals are divided into 30-second duration epochs, in
order to obtain more samples from the limited dataset,
as well as samples that are more manageable for
analysis. In a preliminary state, 10-second duration
epochs were applied, but this would limit wavelet and
heart rate feature extraction further on. Therefore,
from an intersecting pair of signals with roughly 9.5-
minute duration, roughly 19 (9.5×2) epochs can be
obtained. It is worth noting that labels are given to
each epoch according to the file from which the epoch
originates. Due to unexpected acquisition issues (low
sampling frequency) for some Brainlink Pro sessions,
pairs of epochs in which raw EEG frequencies below
30Hz are dominant are discarded. Then, the
remaining raw EEG epochs are resampled to 30Hz.
After syncing and epoching, the actual pre-processing
can be performed for each epoch. Firstly, the raw
EEG mean is set to zero. Bandpass filters are applied
to both the BVP and EEG signals, with ranges
0.6875-10Hz and 4- 30Hz, respectively. No
movement-noise filtering is performed at the current
iteration.
3.3.2 Feature Extraction and Selection
After extraction, the complete feature matrix was
normalized column-wise, to the range 0-1. A custom-
made function for 1-valued statistic extraction from a
1D array is implemented in several stages of data
processing. This function includes the sum of all
values, the value closest to the mean, values closest
to the quartiles, zero-crossings, standard deviation,
kurtosis, range and entropy. The statistics function is
first applied to the pre-processed EEG and BVP.
Wavelet feature extraction is also performed in both
pre-processed epochs. Two main types of wavelet
transform are computed: a three-level DWT and a
morlet CWT. For the three-level DWT, types cycle
between Daubechies 4, Daubechies 20, Coiflet 3,
Haar, Symlet 4, and Discrete Meyer. Boundry
conditions cycle between zero-padding,
symmetrization and smooth padding. For the morlet
CWT, widths cycle between the values 10, 15, 48, 72,
80 and 120. The wavelet transforms output
coefficient arrays, which are then passed through the
1D statistics function. For the extraction of the heart
rate from the pre-processed BVP, the signal is
initially inverted, and peaks are found with a distance
higher than 37. Peaks are then counted for the 30-
second interval. Power Spectral Density feature
extraction is per- formed in the pre-processed BVP
and EEG signals. Welch, periodogram, and
multitaper is extracted, all using the default function
parameters. Afterwards, statistics are extracted from
the array of powers. For the entropy feature
extraction, functions are applied to the pre-processed
epochs, which allows for the extraction of sample,
Shannon, and spectral entropy, with default function
parameters. The selected feature matrix is converted
to a data frame. The correlation matrix is then
obtained, consisting of a matrix in which each value
is the absolute correlation between the row feature
and the column feature. If any correlation value in a
column is inferior to 0.95, that column’s index is
added to a list. The corresponding columns are
dropped from the initial data frame. Afterwards, from
this matrix, the 30 best features are selected through
the Chi-squared test. Thus, the 1893 extracted
features were reduced to the 30 best.
3.3.3 Classification Algorithms and
Evaluation
The classifiers used are Nearest Neighbors, Radial
Basis Function (RBF) SVM, Gaussian Process,
Decision Tree, Random Forest, Multi-layer
Perceptron, AdaBoost, Naive Bayes, QDA, and
Logistic Regression. The defined constant initial
conditions are the RBF kernel and one vs one decision
function shape for the SVM, alpha equal to 1 and a
maximum number of iterations of value 2000 for the
DATA 2023 - 12th International Conference on Data Science, Technology and Applications
418

Multi-Layer Perceptron, the random state value of 0
for the AdaBoost, and binary class mode (one versus
rest) for the Logistic Regression. The data is split into
train and test sets, after which a hyperparameter grid
search is performed. Finally, each model is trained,
and fitting to the test data is performed, to obtain a
vector of predicted labels for each model. The report
includes precision, recall and F1-score for each given
class, as well as the accuracy of the classifier. The
macro average (averaging the unweighted mean per
label) and weighted average (averaging the support-
weighted mean per label, i.e., the mean considering
the real difference between class sample sizes) of the
previous four values are then calculated. The ROC-
AUC score is computed and added to the
corresponding final report.
4 RESULTS
All the participants were young adults with driver’s
licenses, aged 21 to 24 years old. For the non-sleep
deprived group, there were 11 participants in total, 9
male and 3 female. The education level was mostly
graduates, 8 out of 11, with the 3 remaining having
completed high school. None of the participants were
previously diagnosed with any chronic sleep diseases.
Approximately half of the volunteers with good sleep
quality claimed to have drunk coffee less than 12
hours before the experiment. The normal sleep group
presented a PSQI mean value of 6.73 and a standard
deviation of 2.34, while SATED scores had a mean
value of 5.68 and a standard deviation of 1.94. At
their extremes, these values are within the range of
average sleep quality found in (Manzar et al., 2016)
and (Dalmases et al., 2018), for PSQI and SATED
scores respectively. The amount of sleep during the
night previous to the exams had a mean value of 7
hours, with a standard deviation of 1.5 hours.
Regarding the sleep-deprived dataset, data was
obtained from 2 young adults, a female with PSQI of
12 and SATED score of 1.5, and a male with PSQI of
7 and SATED score of 3. As expected from bad sleep
quality individuals, PSQI was higher than normal and
SATED was below the normal in the female subject,
while the male subject had normal PSQI and bad
SATED. Both individuals were awake for more than
24 hours. None of these individuals drank coffee 12
hours previously to the experiment. Due to the low
amount of sleep-deprived subjects, 10 exams were
performed by the male individual: 5 under sleep
deprivation and 5 under a normal sleep schedule.
Normal sleep sessions were used for the classification
performed in a single individual. This classification
served as a comparison to the classification
performed with the complete non-sleep-deprived
group versus the sleep-deprived group.
4.1 Classification Experiments
Regarding the practice (“Practice”) vs exam
(“Exam”) classification nearly all classifiers reached
65% averages and 70% ROC AUC, excluding
Decision Tree and QDA. The best classifier was
AdaBoost, with averages and accuracy above 70%,
and 76% ROC AUC value. Closely behind were the
MLP, Random Forest and Gaussian Process, all with
the same ROC AUC of 76%, but worse means and
accuracy, slightly below 70%. The Decision Tree
classifier was the worst performing in this
classification, with the most discrepancy between
classes. The values of precision, recall and F1-score
were, respectively, 71%, 26% and 38% for the exam
data, and 56%, 90% and 69% for the practice data.
The macro averages were 63%, 58% and 53% with
the weighted averages being nearly identical. The
accuracy and ROC AUC for this classifier had a value
of 59%. For all classifiers, the “Individual” class had
more precision than recall, with the opposite being
found in the “Other” class. F1-scores were better for
the “Individual” class (except in Naive Bayes). The
best-performing classifier was Random Forest, with
84% AUC and 78% accuracy and averages. MLP,
Gaussian Process, Logistic Regression and Nearest
Neighbors all attained ROC AUC of 80%, accuracy
of 70-76% and averages in the range 70-78%. The
worst performing classifier was QDA, with 68 ROC
AUC, accuracy and averages between 65-70%.
4.2 Sleep Deprivation Detection
For the sleep-deprived exam (“Exam SD”) vs non-
sleep deprived exam (Exam) classification, the
discussed results are shown in Table 1. Overall, the
“Exam SD” class achieved better recall than
precision, with the opposite happening to the “Exam”
class. F1-scores were overall better in the “Exam”
class. The obtained results for this classification were
the best of all three datasets and labels. The best
classifier was Random Forest, with 95% ROC AUC,
and accuracy and averages in the range of 87-89%.
Closely behind were Naive Bayes, AdaBoost, MLP
and Logistic regression, with ROC AUC 90- 94%,
accuracy and averages between 78% and 89%. The
worst classifier was the Decision Tree, with 78%
ROC AUC and 76-79% accuracy and averages.
Detection of Drowsy Driving Using Wearable Sensors
419
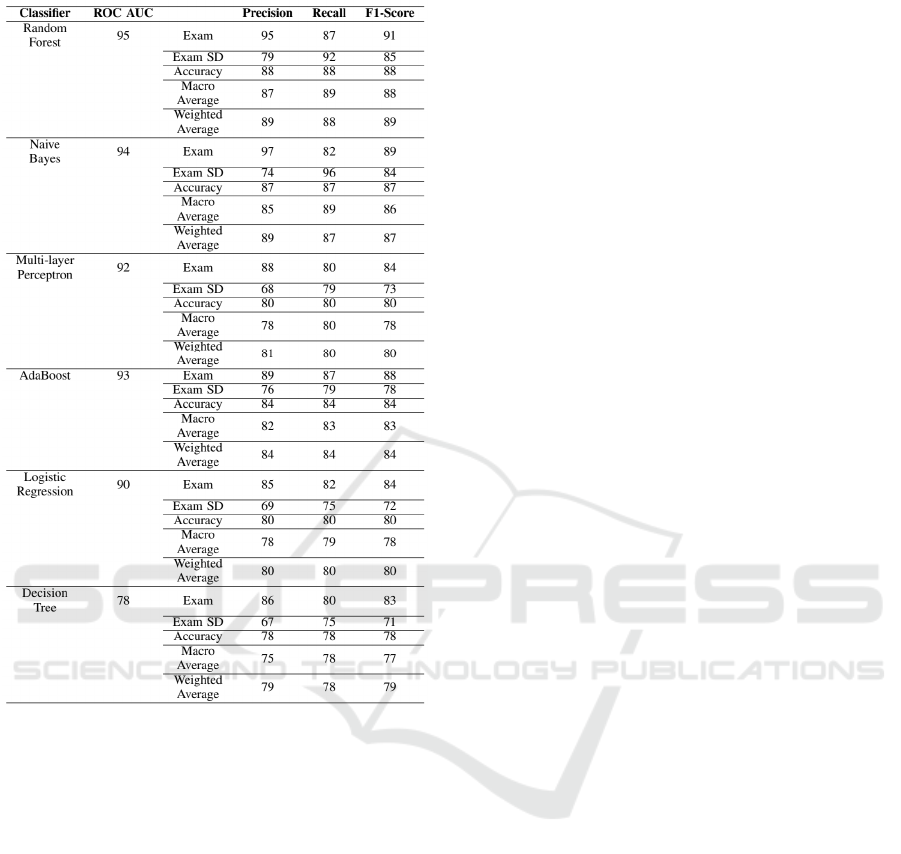
Table 1: Sleep deprivation detection results.
5 DISCUSSION
Volunteers found the experience was close to reality
regarding control and perception, and the sensors
were comfortable to use. The main complaints
presented were about the sensibility of the wheel
being too high and the pedals being difficult to step
on, compared to real vehicles. The low amount of
volunteers pose a threat to the statistical validity,
mainly when it comes to gender inequality and age
range, as well as the very low amount of sleep-
deprived individuals. Further work should invest in
obtaining more volunteers. The sleep questionnaire
results support that nearly study participants have
sleep habits corresponding to a young adult
population, with some scoring worse than the norm.
Regarding classification results, the practice-run
discrimination and individual classification had
comparable results to each other, both slightly above
average (70 to 80%) regarding their evaluation metric
values. When it comes to the practice discrimination,
results proved that while the simulation environment
had some impact on the performance of at least some
subjects, this was somewhat reduced by the 10-
minute practice sequence. Regarding the individual
classification, results do not allow for completely
discarding the effect of the low sample size in the
sleep-deprived population. However, the results
found in the discrimination of sleep-deprived exams
were significantly better than other dataset-label
experiments, which leads us to believe that sleep
deprivation classification is possible with the
proposed methodology with very good evaluation
metrics to back them up (above 90%). The best-
performing classifiers were Random Forest, Naive
Bayes, AdaBoost, MLP and Gaussian Process.
6 CONCLUSIONS
Polysomnography and marketed solutions for drowsy
driving assessment have validated objective results,
some of which are derived from physiological
signals. However, these solutions lack the portability
that a solution integrating wearable devices offers.
The proposed system integrates commonly used
algorithms in PPG and EEG-based Machine
Learning, obtaining promising results when it comes
to the detection of last-night sleep deprivation. The
sensors are costly, particularly the E4 wristband, but
it is expected that they become cheaper as research in
the field progresses. Overall, the proposed solution
far surpasses the current solutions in portability and
day-to-day applicability. Future work should apply to
other kinds of sleep deprivation, such as chronic sleep
deprivation. Also, it should implement the prediction
of the sleep-deprived state through monitoring of the
circadian rhythm. Integration of the sleep
questionnaires with the objective sleep evaluation
methods may be of interest for a future circadian
rhythm monitoring system. Also, movement noise
removal must be applied in the PPG signal, to provide
a good basis for the interbeat interval, heart rate, and
heart rate variability computation.
ACKNOWLEDGEMENTS
This work was financially supported by Base Funding
UIDB- 00027-2020 of LIACC - funded by national
funds through the FCT/MCTES (PIDDAC) and Sono
ao Volante 2.0 - Information system for predicting
sleeping while driving and detecting disorders or
DATA 2023 - 12th International Conference on Data Science, Technology and Applications
420

chronic sleep deprivation (NORTE-01-0247-FEDER-
039720), supported by (NORTE2020), under the
PT2020 Partnership Agreement.
REFERENCES
Aboalayon, K. A. I., Faezipour, M., Almuhammadi, W. S.,
& Moslehpour, S. (2016). Sleep stage classification
using EEG signal analysis: A comprehensive survey
and new investigation. Entropy, 18(9).
https://doi.org/10.3390/e18090272
Barret, K., Barman, S., Brooks H., Yuan, J. (2019)
Ganong’s review of medical physiology. Mcgraw-hill
education.
Benítez, I., Roure, N., Pinilla, L., Sapiña-Beltran, E., Buysse,
D. J., Barbé, F., & de Batlle, J. (2020). Validation of the
Satisfaction, Alertness, Timing, Efficiency and Duration
(SATED) Questionnaire for Sleep Health Measurement.
Annals of the American Thoracic Society, 17(3), 338–
343. https://doi.org/10.1513/annalsats.201908-628oc
Berry, R. B. (2012). Chapter 1 - Sleep Stages and Basic
Sleep Monitoring. In R. B. Berry (Ed.), Fundamentals
of Sleep Medicine (pp.1–11). W.B. Saunders.
https://doi.org/10.1016/B978-1-4377-0326-9.00001-4
Breslau, N., Roth, T., Rosenthal, L., & Andreski, P. (1996).
Sleep disturbance and psychiatric disorders: A
longitudinal epidemiological study of young Adults.
Biological Psychiatry, 39(6), 411–418.
https://doi.org/10.1016/0006-3223(95)00188-3
Buysse, D. J., Reynolds, C. F., Monk, T. H., Berman, S. R.,
& Kupfer, D. J. (1989). The Pittsburgh sleep quality
index: A new instrument for psychiatric practice and
research. Psychiatry Research, 28(2), 193–213.
https://doi.org/10.1016/0165-1781(89)90047-4
Chokroverty, S., & Bhat, S. (2014). Chapter 1 -
Polysomnographic Recording Technique., Atlas of
Sleep Medicine (Second, pp. 1–25). W.B. Saunders.
https://doi.org/10.1016/B978-1-4557-1267-0.00001-1
Dalmases, M., Benítez, I. D., Mas, A., Garcia-Codina, O.,
Medina-Bustos, A., Escarrabill, J., Saltó, E., Buysse, D.
J., Roure, N., Sánchez-de-la-Torre, M., Rué, M., Barbé,
F., & de Batlle, J. (2018). Assessing sleep health in a
European population: Results of the Catalan Health
Survey 2015. PLOS ONE, 13(4), e0194495.
https://doi.org/10.1371/journal.pone.0194495
Guillodo, E., Lemey, C., Simmonet, M., Ropars, J., &
Berrouiguet, S. (2018). Sleep monitoring and wearables :
a systematic review of clinical trials and future
applications (Preprint). https://doi.org/10.2196/
preprints.13044
LaRocco, J., Le, M. D., & Paeng, D.-G. (2020). A Systemic
Review of Available Low-Cost EEG Headsets Used for
Drowsiness Detection. Frontiers in Neuroinformatics,
14. https://doi.org/10.3389/fninf.2020.553352
Leung, J. M., & Martinez, M. E. (2020). Circadian Rhythms
in Environmental Health Sciences. Current
Environmental Health Reports, 7(3), 272–281.
https://doi.org/10.1007/s40572-020-00285-2
Lin, C., Chuang, C., Huang, C., Tsai, S., Lu, S., Chen, Y.,
& Ko, L. (2014). Wireless and Wearable EEG System
for Evaluating Driver Vigilance. IEEE Transactions on
Biomedical Circuits and Systems, 8(2), 165–176.
https://doi.org/10.1109/TBCAS.2014.2316224
Lucey, B. , Mcleland, J., Toedebusch, C., Boyd, J., Morris,
J., Landsness, E., Yamada, K., & Holtzman, D. (2016).
Comparison of a single-channel EEG sleep study to
polysomnography. J. of Sleep Research, 25(6), 625–
635. https://doi.org/10.1111/jsr.12417
Mancia, G. (1993). Autonomic Modulation of the
Cardiovascular System during Sleep. New England
Journal of Medicine, 328(5), 347–349. https://doi.org/
10.1056/nejm199302043280511
Manzar, M. D., Zannat, W., Hussain, M. E., Pandi-Perumal,
S. R., Bahammam, A. S., Barakat, D., Ojike, N. I.,
Olaish, A., & Spence, D. W. (2016). Dimensionality of
the Pittsburgh Sleep Quality Index in the young
collegiate adults. SpringerPlus, 5(1). https://doi.org/10.
1186/s40064-016-3234-x
McCarthy, C., Pradhan, N., Redpath, C., & Adler, A.
(2016). Validation of the Empatica E4 wristband. 2016
IEEE EMBS International Student Conference (ISC),
1–4. https://doi.org/10.1109/EMBSISC.2016.7508621
Milstein, N., & Gordon, I. (2020). Validating Measures of
Electrodermal Activity and Heart Rate Variability
Derived From the Empatica E4 Utilized in Research
Settings That Involve Interactive Dyadic States. Front
Behav Neurosci, 14, 148.
Mollayeva, T., Thurairajah, P., Burton, K., Mollayeva, S.,
Shapiro, C. , & Colantonio, A. (2016). The Pittsburgh
sleep quality index as a screening tool for sleep
dysfunction in clinical and non-clinical samples: A
systematic review and meta-analysis. Sleep Med Rev,
25, 52–73.
Moser, D., Anderer, P., Gruber, G., Parapatics, S., Loretz,
E., Boeck, M., Kloesch, G., Heller, E., Schmidt, A.,
Danker-Hopfe, H., Saletu, B., Zeitlhofer, J., Dorffner,
G. (2009). Sleep Classification According to AASM
and Rechtschaffenamp; Kales: Effects on Sleep Scoring
Parameters. Sleep, 32(2), 139–149. https://doi.
org/10.1093/sleep/32.2.139
Ollander, S., Godin, C., Campagne, A., & Charbonnier, S.
(2016). A comparison of wearable and stationary
sensors for stress detection. 2016 IEEE Int. Conf. on
Systems, Man, and Cybernetics (SMC), 4362–4366.
doi.org/10.1109/SMC.2016.7844917
Rodrigues, C., Faria, B.M., Reis, L.P. (2021). Detecting,
Predicting, and Preventing Driver Drowsiness with
Wrist-Wearable Devices. Progress in Artificial
Intelligence. EPIA 2021. Lecture Notes in Computer
Science, vol 12981. Springer, Cham. https://doi.
org/10.1007/978-3-030-86230-5_9
Sawyer, B., Teo, G., and Mouloua, M. (2012). Driveid:
Safety innovation through individuation. Work,
41:4273–4278. 10.3233/WOR-2012-0722-4273
van Wouwe, N., Valk, P., & Veenstra, B. (2011). Sleep
Monitoring: A Comparison Between Three Wearable
Instruments. Military Medicine, 176, 811–816.
https://doi.org/10.7205/MILMED-D-10-00389.
Detection of Drowsy Driving Using Wearable Sensors
421
