
Integrated Web Based Information System with Short Message
Service (SMS) Gateway for Natural Disaster Preparations:
Case Study in Kediri Region, East Java Indonesia
Ahmad Habib
a
, Muhammad Suma, Roenadi Koesdijarto,
Gery Kusnanto,
Ery Sadewa Y., Agus Darwanto and Chaidir Chalaf Islamy
Department of Informatics Engineering, Universitas 17 Agustus 1945 Surabaya,
Jl. Semolowaru No. 45, Surabaya, Indonesia
Keywords: Geo Graphics Information System, Google Maps, Global Positioning System, Disasters, PHP, MySQL.
Abstract: Geo graphics Information System is a system that can be used to collecting, manipulating and analyzing
information of geo graphics. This technology does not only function as a tool maker of digital maps, but
capable of producing a system used for the planning, geographical data analysis and decision-making. Based
on geographical location and geological, Indonesian is one of a country often experienced disasters. There for
needed a technology that could help in handling the disaster. One of the technology needed for the handling
of disasters namely by utilizing geo graphics information system. The process of making geo graphics
information system using software PHP, database MySQL and Google maps. Besides comprising mapping
prone to disaster, system to be made it may help a quick reaction team for information disaster that was going
on in an area, that a team quick reaction be able to come to the residing and do study data. By using with
global positioning system village officials (user who given the access) to send information about disaster that
was going on in the area, so that data it can be processed by admin to disaster mitigation.
1 INTRODUCTION
Geographically Indonesia lies in two oceans namely
Indian Ocean and Pacific Ocean, located in the tropics
which is an area crossed by the equator. The influence
of geographical location makes some areas of
Indonesia have a constantly changing weather.
Geologically, Indonesia lies on three tectonic plates,
these plates often experience friction. As a result of
geographical and geological location of Indonesia
that resulted in frequent floods of Indonesia,
droughts, landslides, earthquakes, tsunamis,
volcanoes and so forth. One of the disaster-prone
areas of Indonesia is East Java, which has 13
volcanoes, is passed by a Bengawan solo river, there
is a vast forest and is in a tropical region that makes
East Java vulnerable to disasters, especially the
Kediri region (Geography, 2018).
Kediri region flanked by two different mountains,
namely mount Kelud in the east that is volcanic and
mount Wilis in the west that is non volcanic, it makes
a
https://orcid.org/0000-0001-7474-8773
the Kediri area prone to volcanic eruptions, landslides
and cold lava floods. Based on the topography
condition, there are eight areas that are prone to
landslide and flood disaster. Areas that enter the
vulnerable zone are located in the area around the
slopes. Eight prone areas include Mojo, Semen,
Banyakan, Grogol, Tarokan, Kepung, Puncu and
Kandangan sub districts (Geography of Kediri
regency, 2018).
Based on the topographic condition of Kediri
region, there have been occurrences of natural
disaster, one of which is the eruption of mount Kelud
on Thursday 13 February 2014. Its impact covers
Kediri and its surroundings. Based on Indonesian
disaster data and information obtained from
dibi.bnpb.go.id, the disaster was recorded 39018
residents of Kediri to evacuate [9,11,12]. At that time
the signs will erupt so quickly, that the villagers are
less prepared to face the eruption. From the event
there should be a system that provides a picture of the
Habib, A., Suma, M., Koesdijarto, R., Kusnanto, G., Y., E., Darwanto, A. and Islamy, C.
Integrated Web Based Information System with Short Message Service (SMS) Gateway for Natural Disaster Preparations: Case Study in Kediri Region, East Java Indonesia.
DOI: 10.5220/0012106800003680
In Proceedings of the 4th International Conference on Advanced Engineering and Technology (ICATECH 2023), pages 247-254
ISBN: 978-989-758-663-7; ISSN: 2975-948X
Copyright
c
2023 by SCITEPRESS – Science and Technology Publications, Lda. Under CC license (CC BY-NC-ND 4.0)
247
disaster and how to deal with it both before and after
the disaster.
The existence of disaster-prone areas of the
district and city of Kediri and based on the disaster
event, need a technology that can assist in disaster
mitigation [9,12]. Disaster mitigation is an effort to
anticipate or cope with disaster after disaster or before
disaster (Puturuhu, 2015).
In the research of Mustopa Ali et al (Ali et al.,
2015) produce analysis of Geographic Information
System (GIS) for the earthquake disaster integrated in
Special Region of Yogyakarta. The research produced
a new system design of the old system. The study was
conducted with several steps, namely the old system
analysis and formal documentation used in system
development. Then analyze the system requirements
and make technical documentation of the main
system design and standard rules of system
development.
From research Munir and Agus Qomaruddin
(Munir et al., 2014) produced a technology that is
Geographic Information System (GIS) Mapping of
Natural Disasters Using Google Maps. The
Information System utilizes Google Maps which is a
free online mapping service provided by Google.
Google Maps itself provides an API of one form of
java script library to access this geographic
information. With web API the programming can
build its own web which features GIS with the help
of Google Maps (Roesdiana et al., 2014),(Google
Maps, 2018).
In this study, researchers used web based
information system and geo graphics information
system (GIS) to generate a system useful for mapping
disaster prone areas, managing news portals
containing current disaster news, managing disaster
information data going on, and managing disaster
preparedness articles. So hopefully this system is
beneficial to society and agency of related institution
(Disaster Data, 2018).
2 MATERIALS AND METHODS
In solving a research required a research method, in
order to produce a study that really maximal. The
approach used refers to the rules of the development
cycle of a soft ware. In this research using Waterfall
Method approach (Understanding ERD and DFD,
2018). The details of the troubleshooting approach
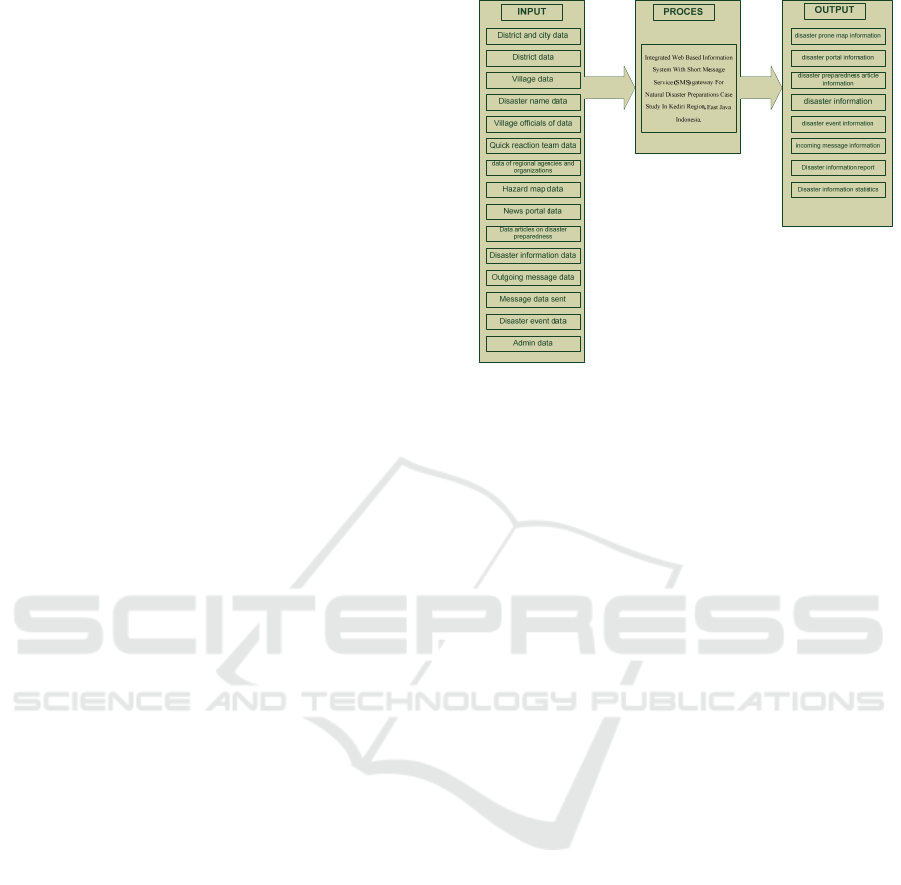
are described below at figure 1.
Figure 1: Block Diagram.
2.1 System Analysis
At this stage an analysis of the system needs. Needs
analysis is done to collect information about the needs
of users of the system and analyze the elements
required by the system. From the results of system
analysis obtained the need for data to support this
system that is the data of disaster prone areas of the
district and city of Kediri. The data is used to make
system design and then built the system (Analysis of
information system design, 2018).
The data is obtained based on sampling criteria
that is determined, namely the district and city of
Kediri obtained from Regional Disaster Management
Agency East Java Province. The data were collected
by observation and interview.
2.2 System Design
At this stage modeling the system by describing the
process and the flow of data that is going on to
produce a detailed conceptual picture of the Disaster
Preparedness Information System district and
municipal district Kediri web based.
At this stage modeling the system by describing
the process and the flow of data that is going on to
produce a detailed conceptual picture of the Disaster
Preparedness Information System district and
municipal district Kediri web based.
2.2.1 Tiered Diagram
The tiered diagram of the Disaster Preparedness
Information System of Kediri district and municipal
areas based on the web can be seen on the picture
shown on the figure 2.
ICATECH 2023 - International Conference on Advanced Engineering and Technology
248
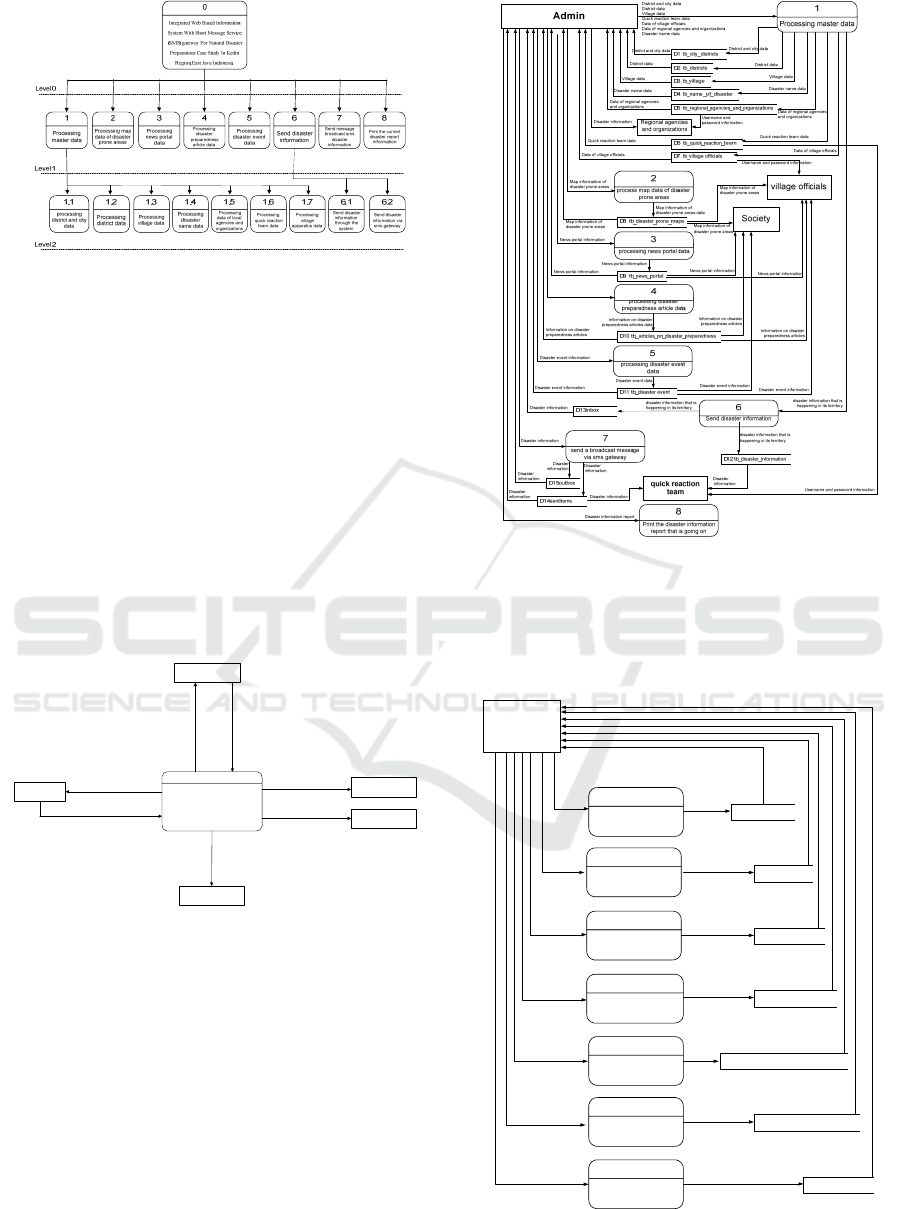
Figure 2: Tiered Diagram.
2.2.2 Data Flow Diagram (DFD)
Data Flow Diagram compiled as a tool that is useful
for the preparation and design of Information Systems
in a structured, while the advantage is to facilitate
users who lack the computer field to understand the
system worked or developed (Understanding ERD
and DFD, 2018).
2.2.3 Data Flow Diagram (DFD) Level 0
Data Flow Diagram level 0 from Disaster
Preparedness Information System of Kediri district
and municipality area based on web can be seen on
the picture which is listed on the figure 3.
Integrated Web Based Information
System With Short Message Service
(SMS) gateway For Natural Disaster
Preparations Case Study In Kediri
Region, East Java Indonesia
0
Admin
Village officials
Regional agencies
and organizations
Society
Quick Reaction Team
Disaster data is happening in its territory
Map informat ion of dis aster prone areas
News portal information
Information on disaste r prepared ness articl es
Username and password i nformation
Map information of disaster prone areas
News portal information
Information on disaster preparedness articles
Username and password information
Disaster information (from village officials)
Map information of disaster prone areas
News portal information
Information on disaster preparedness articles
Username and password information
Disaster information (from village officials)Disaster
information via sms gateway
Map informat ion of dis aster pron e areas
News portal information
Information on disaste r prepared ness articl es
District and city data
District data
Village data
Quick reaction team data
Data of village officials
Admin data
Data of regional agencies and organizations
disaster information report
Map information of disaster prone areas
News portal information
Information on disaster preparedness articles
Disaster information (from village officials)
District and city data
District dataVillage data
Quick reaction team data
Data of village officials
Admin data
Data of regional agencies and organizations
Map information of disaster prone areasNews portal information
Information on disaster preparedness articles
Disaster information via sms gateway
Figure 3: Data Flow Diagram (DFD) Level 0.
2.2.4 Data Flow Diagram (DFD) Level 1
Data Flow Diagram level 1 of Disaster Preparedness
Information System Kediri district and municipal
area based on the web can be seen on the picture
shown on the figure 4.
Figure 4: Data Flow Diagram (DFD) Level 1.
Data Flow Diagram level 1 process master data
from Disaster Preparedness Information System
Kediri district and municipal areas based on the web
can be seen in the picture shown on the figure 5.
ADMIN
Processing district and
city data
1.1
Processing district data
1.2
Processing village data
1.3
Processing disaster
name data
1.4
Processing data of local
agencies and
organizations
1.5
Processing quick
reaction team data
1.6
Processing village
apparatus data
1,7
D1 tb_city_ districts
D2 tb_districts
D3 tb_village
D4 tb_name _of_ disaster
D5 tb_regional_agencies_and_organizations
D6 tb_quick_reaction_team
D7 tb_village officials
Data of village officials
District and city data
District and
city data
District and
city data
District data
District data
District
data
Village data
Village data
Village
data
Disaster name dataDisaster name data
Disaster
name data
Data of regional
agencies and
organizations
Data of regional
agencies and
organizations
Data of regional
agencies and
organizations
Quick reaction team data
Quick reaction
team data
Quick reaction
team data
Data of village officials
Data of village
officials
Figure 5: Data Flow Diagram (DFD) Level 1.
Integrated Web Based Information System with Short Message Service (SMS) Gateway for Natural Disaster Preparations: Case Study in
Kediri Region, East Java Indonesia
249
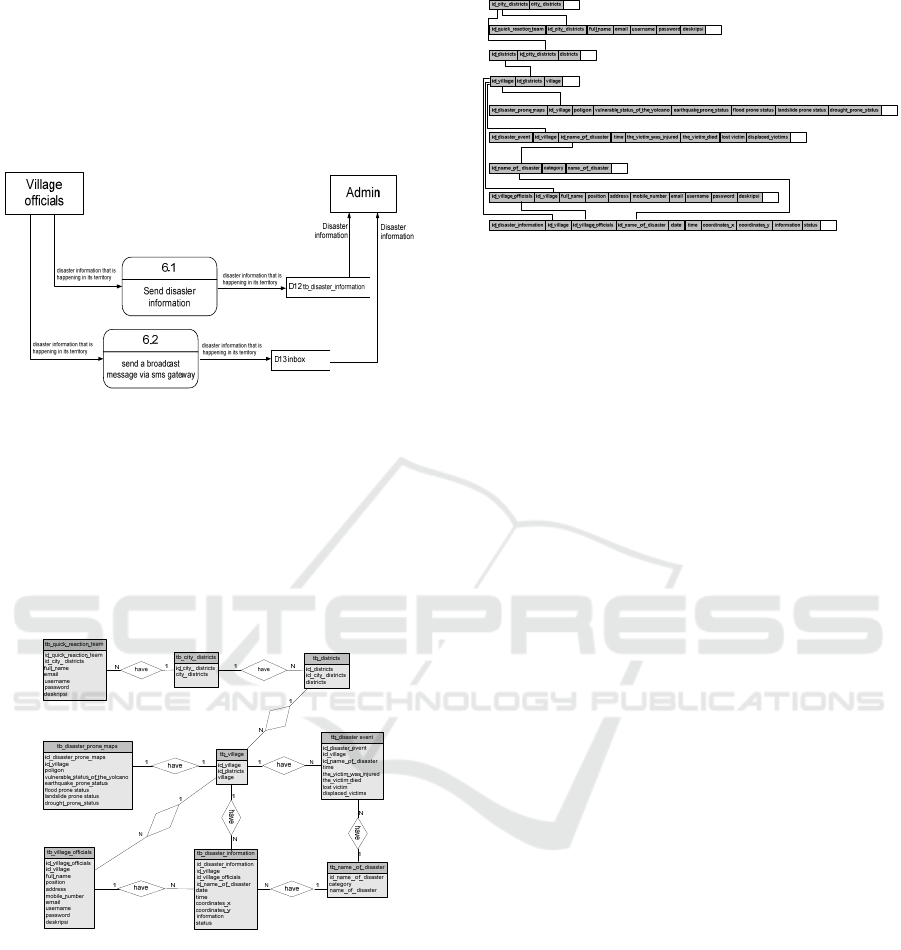
2.2.5 Data Flow Diagram (DFD) Level 2,
Sending Disaster Information
Data Flow Diagram level 2 send disaster information
from Disaster Prevention Information System Kediri
district and municipal area based on web can be seen
in the picture shown on the figure 6.
Figure 6: Data Flow Diagram (DFD) Level 2, Sending
Disaster Information.
2.2.6 Entity Relation Diagram (ERD)
Entity Relationship Diagram (ERD) describes the
relationship between data in the database by using
symbols, where the attributes of an entity have
relations (relation) with attributes on other entities.
The description can be seen in the figure 7.
h
a
v
e
h
a
v
e
Figure 7: Entity Relationship Diagram (ERD).
2.3 Mapping
The process of mapping between tables is a
combination between tables that have the same
primary key, so the tables become one unity
connected by the key field. In this process the data
elements are grouped into one database file along
with the entities and their relationships
(Understanding ERD and DFD, 2018). The
description can be seen in the figure 8.
Figure 8: Mapping.
2.4 Interface Design
System Development At this stage the
implementation of the results of analysis and system
design. What is done in this stage is system creation,
input interface and output software.
2.4.1 System Trial and Evaluation
This stage is the final stage of the development of
Disaster Preparedness Information System of Kediri
district and municipality. At this stage a system test
has been established and followed by evaluation of
the advantages and disadvantages of this system.
2.4.2 System Development
Implementation of the program is the stage where
researchers apply or install software that has been
created and tested against all system functions. By
considering the consequences and following the
stages in the Waterfall method well then the
opportunity to get a quality system will become
bigger.
3 RESULTS
3.1 User Interface and Implementation
The following is the user interface and system
implementation on Disaster Preparedness
Information System Kediri district and municipal
areas web based:
3.1.1 System Implementation at Admin
Implementation of system at admin consists of 10
menu that is home menu, data master menu, disaster
prone map menu, news portal menu, disaster
preparedness menu, disaster information menu, SMS
Gateway menu, disaster event menu, report and
ICATECH 2023 - International Conference on Advanced Engineering and Technology
250
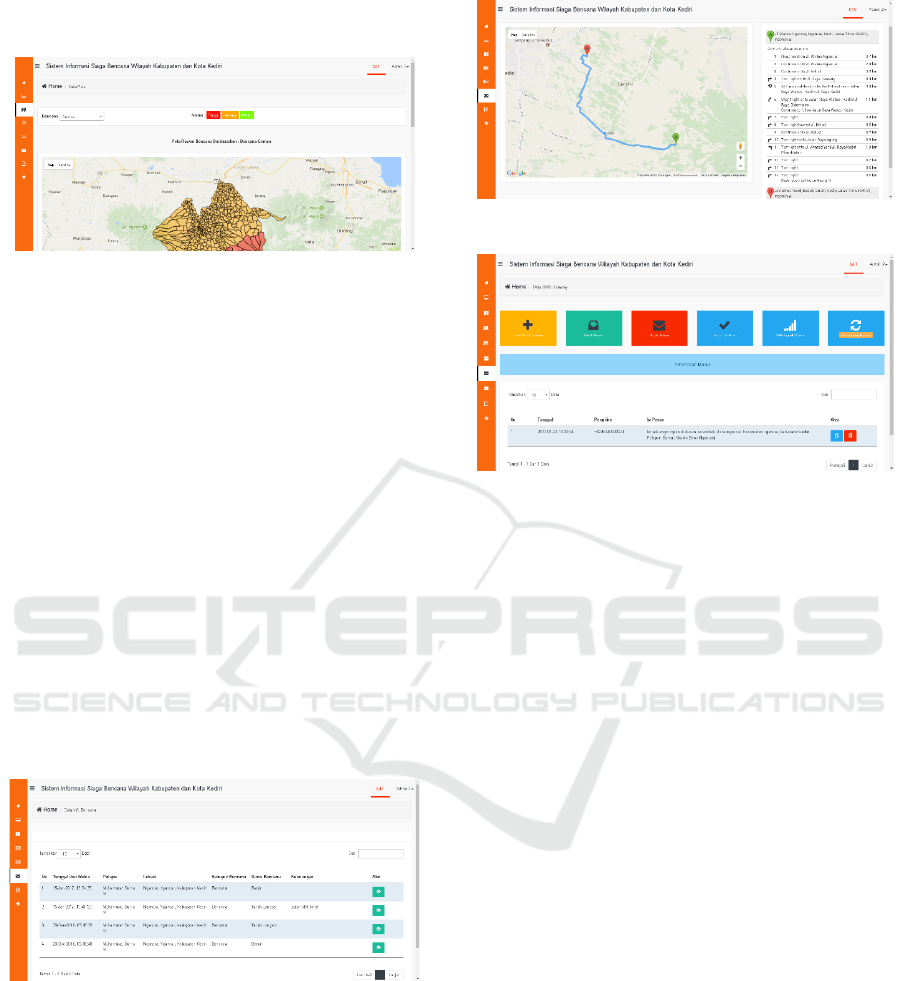
statistics menu, and admin data menu (Habib et al.,
2016).
Figure 9: Map Prone to Disaster Menu.
Figure 9 is a disaster prone map menu containing
disaster prone areas data, on the menu admin can only
change the status of disaster prone and change the
polygon map. In the menu there is no "Delete" and
"Add" buttons because the data on the disaster prone
map is automatically increased or erased if the data in
the village increases or deletes.
The news portal menu contains news portal data
from the database. In this menu consists of tables
containing news portals, "Add" button to open the add
form, "Edit" button to open the edit form, and
"Delete" button to delete the data.
The news portal menu contains news portal data
from the database. In this menu consists of the
Disaster Preparedness Menu containing disaster
preparedness data articles from the database. In this
menu consists of tables containing disaster
preparedness article data, "Add" button to open the
add form, "Edit" button to open the edit form, and
"Delete" button to delete the data.
Figure 10: Disaster Information Menu.
Figure 10 is a disaster information menu
containing disaster information data from village
apparatus reports. In this menu there is a button to go
to Maps Directions form to disaster location by
utilizing google maps API and GPS.
Figure 11 is the Maps Direction page to the
disaster location by using GPS.
Figure 11: Directions to Disaster Locations.
Figure 12: SMS Gateway menu.
Figure 12 is a menu on SMS Gateway (SMS
Gateway Visual Basic, 2018). The menus include
sends broadcast messages used to send disaster
information messages to disaster response teams,
inbox menus containing incoming message data
disaster information from village apparatus, outbox
menu containing outgoing message data that has not
been sent or pending, sent message menu containing
sent message data, modem signal menu shows how
many percent of modem signals, Gammu's connected
menu shows whether your Gammu service is
disconnected or disconnected.
The Disaster reports and statistics menu contains
a sub menu of disaster information reports and
disaster information statistics. Disaster information
report sub menu to display disaster information report
based on date and year and sub menu of disaster
information statistics to display pie chart of disaster
information statistics.
The Disaster reports and statistics menu contains
a sub menu of disaster information reports and Figure
13 above is a page that contains disaster event data
from the database. On the page there is a table that
contains the disaster event data, the "Add" button to
open the form added data, the “Open” button to open
the edit data form, and “Delete” button to delete the
data.
Integrated Web Based Information System with Short Message Service (SMS) Gateway for Natural Disaster Preparations: Case Study in
Kediri Region, East Java Indonesia
251

Figure 13: Sub Menu of Disaster Information Report.
Figure 14 is a sub menu of disaster information
reports there is a "Process" button to process or
display reports based on month and year input data,
"Print" button to display the print ready page of
disaster information report.
Figure 14: Sub Menu of Disaster Information Report.
Figure 15 is a sub menu of disaster information
statistics containing disaster information statistics in
the form of pie charts.
The admin menu contains admin data and this
menu is used to add, modify and delete admin data.
Figure 15: Sub Menu Disaster Information Statistics.
3.1.2 User System Implementation
The implementation of the system provides users with
news portals, disaster preparedness articles, disaster
prone maps, emergency response facilities to transmit
existing disaster information sent by village officials
and disaster information facilities that can be utilized
by disaster response teams, local agencies and
organizations. Figure 16 is a user's home page
containing a map of disaster-prone areas, the latest
disaster news and disaster information going on
(Function and duty BPBD East Java Province, 2018).
Figure 16: Home page.
Figure 17 is a page that contains a collection of
disaster news.
Figure 17: News List Portal page.
Figure 18 is a page that contains a collection of
disaster preparedness articles.
Figure 18: Disaster Preparedness Articles Page.
Figure 19 is a page with a full description of the
news portal.
Figure 19: Content Fill News Portal.
Figure 20 is a page with a full description of
disaster preparedness articles.
ICATECH 2023 - International Conference on Advanced Engineering and Technology
252
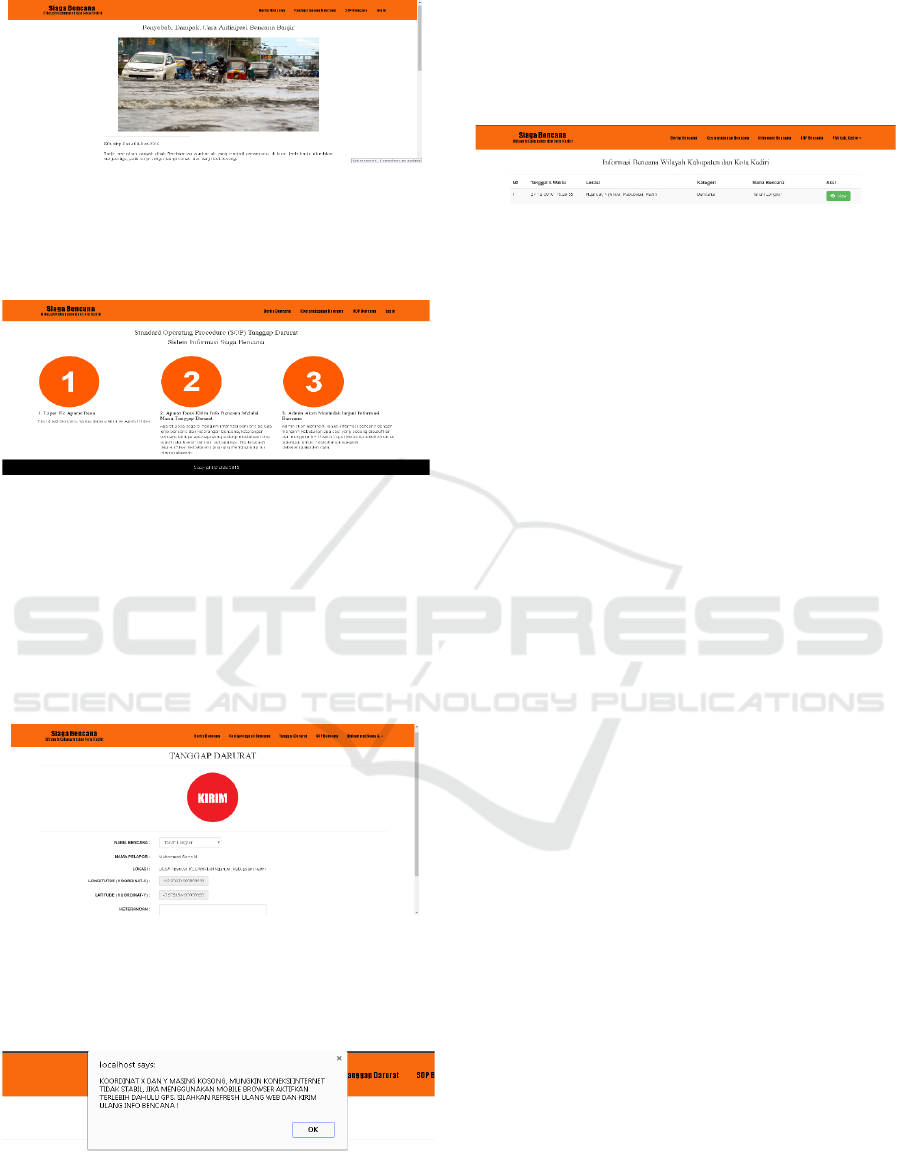
Figure 20: Page Contents Articles Disaster Preparedness.
Figure 21 is a page that contains information on
disaster reporting information procedures to the
system.
Figure 21: Page Standard Operating Procedure for Disaster
Management.
Figure 22 is a page that contains disaster reporting
forms to the system in the event of a disaster. When
the village apparatus users successfully log into the
system then it will automatically open the page, then
the village apparatus chooses the name of the disaster,
enter the information when necessary and press the
"Submit" button.
Figure 22: Emergency Response Page.
Figure 23 is an alert that contains information that
a failure occurred in sending disaster information
because the coordinate data is still empty.
Figure 23: Alert Failed Load Coordinate Data.
Figure 24 is a page that contains disaster
information data. This page can only be accessed by
rapid response teams, and local agencies and
organizations. On this page is a "View" button to open
the maps page direction to the location of disaster
information.
Figure 24: Disaster Information Page.
System testing is an important part of the software
development cycle. Testing is done to ensure the
quality and also know the weakness of the software.
Testing on this system using black box method. Black
box testing is done by testing whether the system
developed in accordance with what is contained in the
functional specifications of the system.
4 DISCUSSION
After the planning and making of the system, then in
this research will be followed by the discussion of the
results of implementation and trial of the disaster
preparedness information system of Kediri district
and municipality of Kediri web based. To test the
system, it takes some support system (Roesdiana et
all., 2014).
4.1 Supporting the Application
Program
Prior to the implementation and testing of the system
built, previously required installation process support
system, including.
4.1.1 Hardware
The hardware available to test the system includes :
1. Intel Inside Core i5 2.40 GHz processor
2. 4GB DDR3 Memory
3. 500GB hard drive
4. 14 inch monitor
5. Modem Prolink PHS600.
4.1.2 Software
Required software such as:
1. Microsoft Windows 7 Ultimate operating
system
2. Xampp Version 1.8.3 Control Panel v3.2.1
Integrated Web Based Information System with Short Message Service (SMS) Gateway for Natural Disaster Preparations: Case Study in
Kediri Region, East Java Indonesia
253

3. SQL database version 11.11
4. Google Chrome version 55.0.2883.87
5 CONCLUSIONS
Based on the result of the research, it can be
concluded that the disaster preparedness information
system of regency and municipality district can help
the community and Regional Disaster Management
Agency in the event of disaster.
This system is equipped with GPS to assist the
ongoing disaster reporting so that when pressing the
"View" button on the disaster information data, it
directly shows the route of the map to the disaster
location using the facility in Google Maps API.
It is expected that this system can be developed
based on android and there are additional donor
facilities and volunteers and the process of sending
the results of disaster data assessment from the rapid
reaction team.
REFERENCES
Habib, A. & Wibowo, A. D. (2016). Reminder app based
on location with global positioning system (GPS) based
android. Konvergensi, 12, 19-27. ISSN:858-0688. [in
Indonesian].
Ali, M., Rosidi, A., & Sofyan, A. F. (2015). Geographical
Information System Analysis for Integrated Earth
Disasters in Yogyakarta Special Region. Scientific
Journals DASI, 16, 19-16. [in Indonesian].
Munir & Qomaruddin, A. (2014). Geographic Information
System Mapping Natural Disasters Using Google
Maps. Journal of Information Technology, IX.
ISSN:1907-2430. [in Indonesian].
Puturuhu, F. (2015). Disaster mitigation and remote
sensing. Yogyakarta: Graha Ilmu.
Roesdiana, K. E., Raharjo, B., & Heryanto, I. (2014). Web
programming (HTML, PHP & MySQL). Bandung:
Modula.
Habib, A., Darwanto, A., Ronando, E., & Slamet. (2016).
Pump Control System Using Microcontroller and Short
Message Service (SMS) Gateway for Flood Prevention.
Springer Proceedings in Physics. International
Conference on Physics and Mechanics of New
Materials and Their Applications, Surabaya, Indonesia,
Chapter 50, 607.
SMS Gateway Visual Basic. (n.d.). Know How to Work
SMS Gateway. Retrieved January 22, 2018, from
http://sms-gateway-visual-
basic.blogspot.co.id/2012/07/know-how-to-work-sms-
gateway
Google Maps. (n.d.). In Wikipedia. Retrieved December 1,
2018, from https://id.wikipedia.org/wiki/Google_Maps
Geography. (n.d.). In Kediri Kota. Retrieved January 10,
2018, from
http://kedirikota.go.id/read/Profil/10/1/32/Geography.
html
Function and duty BPBD East Java Province. (n.d.).
Retrieved January 10, 2018, from
http://bpbd.jatimprov.go.id/index.php/profil/function-
and-task
Disaster Data. (n.d.). In BNPB. Retrieved January 10, 2018,
from http://dibi.bnpb.go.id/data-disaster
Geography of Kediri regency. (n.d.). In Kediri Kab.
Retrieved January 10, 2018, from
https://kedirikab.go.id/index.php?option=com_content
&view=article&id=94&Itemid=181
Advantages and Disadvantages of Waterfall Methods in
System Development. (n.d.). In DosenIT.com.
Retrieved January 20, 2018, from
http://dosenit.com/kuliah-it/teknologi-
informasi/kelebihan-dan-kekurangan-metode-waterfall
Understanding ERD and DFD. (n.d.). In AVFAH.
Retrieved January 5, 2018, from
http://avfah.wordpress.com/2010/01/29/pengertian-
erd-dan-dfd
Analysis of information system design. (n.d.). In
SlideShare. Retrieved January 5, 2018, from
http://www.slideshare.net/guestb7aaaf1e/perancangan-
dan-analisa
ICATECH 2023 - International Conference on Advanced Engineering and Technology
254
