
K-Means Algorithm Grouping for Visualizing Potential of Hydrogen
(pH) Data in Kali Lamong River
Shah Khadafi
1
a
,
Achmad Chusnun Ni’am
2
b
and
Gayuh Fajar Alamsyah
1
1
Department of Information System, Institut Teknologi Adhi Tama Surabaya, Surabaya, Indonesia
2
Department of Environmental Engineering, Institut Teknologi Adhi Tama Surabaya, Surabaya, Indonesia
Keywords: Davies-Bouldin Index, K-Means Algorithm, Kali Lamong, Water Quality.
Abstract: Water quality monitoring becomes vital in water management, such as in the Lamong River. Changes in the
values of water pH will affect the water quality. For this reason, it is necessary to classify water quality to
find information on water quality zones with good and poor conditions. This study employed the K-Means
algorithm method for grouping water quality, and the final results of grouping were visualized on a website-
based application. The test was carried out three times with the numbers of clusters 2, 3, and 4, then cluster
analysis was carried out using the Davies-Bouldin Index to determine the best number of clusters. The
research results indicated that the best number of clusters produced using the K-Means algorithm were two
clusters (k = 3), with the smallest validity value of the Davies-Bouldin Index by 0.36. Three clusters were
formed, with 43 stations from Cluster 1, 45 stations from Cluster 2 and 29 stations from Cluster 3. It yielded
four iterations, with information C1 for poor conditions, C2 for good conditions, and C3 for medium
conditions.
1 INTRODUCTION
Kali Lamong River is a river located on the border
between Surabaya City and Gresik Regency. The
upstream part of Kali Lamong river is between
Mojokerto district and Lamongan district while the
downstream part is between Mojokerto district and
Surabaya city. Around the banks of Lamong River is
often used for residents to do their daily activities
(Luki Nasiti, Rahayu, & Indah, 2017). Kali Lamong
River also functions as a water supplier for the people
of Lamongan Regency and Gresik Regency, and is
used in daily activities such as agricultural waters,
industry and household activities. Water quality
monitoring is an important instrument in water
management, one of which is in Lamong River,
because it can find out important information about
the physical, chemical and biological state of water
resources, determine a pattern and identify the
emergence of water quality problems during certain
situations (Ni’Am, Prasetya, & Utami, 2021).
(Ni’am, Aulady, Hamidah, & Prasetya, 2022)
a
https://orcid.org/0000-0003-1225-8909
b
https://orcid.org/0000-0002-7408-9672
One of the parameters that can be used to measure
water quality is the potential of hydrogen (pH). The
pH value of water can affect the distribution of
chemical factors of waters, and the distribution of
microoganisms whose metabolism is influenced by
the distribution of these chemical factors (Supriatna,
2020). Grouping data for water quality determination
needs to be completed to obtain information on water
quality at each location point in Lamong River. From
a programming point of view, artificial intelligence
includes the study of symbolic programming,
problem solving, and search processes (Hani Subakti
et al., 2022). This study will construct a system for
classifying the water quality value of Lamong River
using the K-Means algorithm. This research aims to
help researchers in the field of AMDAL
(Environmental Impact Analysis) in analyzing water
quality based on which points the pH value of the
water is included in good, medium, and poor quality.
Then further analysis can be completed about the
impact that will occur after clustering. In this study
also proposed the use of the Davies-Bouldin Index
(DBI) method to determine the best number of
Khadafi, S., Ni’am, A. and Alamsyah, G.
K-Means Algorithm Grouping for Visualizing Potential of Hydrogen (pH) Data in Kali Lamong River.
DOI: 10.5220/0012108900003680
In Proceedings of the 4th International Conference on Advanced Engineer ing and Technology (ICATECH 2023), pages 69-75
ISBN: 978-989-758-663-7; ISSN: 2975-948X
Copyright
c
2023 by SCITEPRESS – Science and Technology Publications, Lda. Under CC license (CC BY-NC-ND 4.0)
69

clusters, the smallest DBI value is used as the number
of clusters selected. Finally, the final results of
clustering using the K-Means algortima will be
displayed in the form of visual analysis using website
program applications, Orange data mining, and
Surfer.
2 THEORY
2.1 Kali Lamong Gresik
Kali Lamong is a river that has a length of ± 89 km
and has 7 tributaries, Lamong River is located in
Kedung Kumpul, Lamongan Regency to Madura
Strait, Segoromadu, Gresik Regency. Kali Lamong
River is used as a water supplier by the people of
Lamongan and Gresik Regencies and also used in
daily activities such as agricultural waters and
fisheries.
2.2 pH
The degree of acidity or pH is a parameter that aims
to determine or measure acid/base levels in water. pH
is used in determining alkalinity, CO2, and in acid-
base equilibrium. At a given temperature, the
intensity of the acid or base character in a solution can
be indicated by pH and hydrogen ion activity. Causes
of changes in the pH of water will cause changes in
odor, taste, and color. The pH value = 7 is declared a
neutral state, 0 < pH < 7 is declared an acidic state, 7
< pH < 14 is declared an alkaline state (Aswant,
2016).
2.3 K-Means Algorithm
Clustering aims to group and understand the data
structure. Clustering is only the initial stage and then
continues with core processing and class labeling for
each group. K-Means is one of the non-hierarchical
data clustering methods that seek to partition existing
data into one or more clusters or groups so that similar
data and data with different characteristics are
grouped into other groups (Wahyudi, 2020). The
stages of the K-means algorithm used are as follows
(Ainun Novia, 2020) :
• Determine k as the number of clusters to be
formed.
• Determine k initial centroids randomly.
• Calculate the distance of each object to each
centroid of each Cluster using the Euclidian
Distance method as in equation 1.
𝑑
(
𝑥,𝑦
)
=
∑
(𝑥𝑖 − 𝑦𝑖)²
(1)
Where:
𝑑
(
𝑥,𝑦
)
measure of dissimilarity
𝑥𝑖 = (𝑥
,𝑥
,…,𝑥
) which is the data
variable
𝑦𝑖 = (𝑦
,𝑦
,…,𝑦
) i.e. the variable at the
center point
• Allocate each object to the closest centroid.
• Perform iteration, then determine the new
centroid position using the equation
𝐶=
∑
(2)
Description:
C: Centroid data
m: Data members that belong to the closest
Cluster distance
n: The amount of data that is a member of a
particular Cluster.
2.4 Davies-Bouldin Index (DBI)
DBI is a cluster validation found by Davidi L. Davies
and Donaldi W, DBI is used to determine the best
number of clusters that can be assessed using DBI.
The grouping with the best number of clusters is a
grouping that has a minimum value of Davies
Bouldin Index (DBI) (Badruttamam, Sudarno, &
Maruddani, 2020). The following stages of using DBI
are formulated as follows:
1. Sum of square within cluster (SSW) which is
an equation used to determine the cohesion
matrix in an i-th cluster which is formulated as
follows:
𝑆𝑆𝑊
=
∑
𝑑(𝑥
,𝑐
) (3)
Description:
𝑚
is the number of data in the i-th cluster
𝑐
is the i-th centroid
𝑑(𝑥
,𝑐
)is the distance from the i-th data to the
i-th cluster point.
The smaller the SSW value, the better the
clustering results.
2. Sum of square between clusters (SSB) is an
equation used to determine the separation
between clusters, which is calculated using the
following equation:
𝑆𝑆𝐵
.
=𝑑(𝑐
,𝑐
) (4)
3. After the cohesion and separation values are
obtained, then the ratio measurement (Rij) is
carried out to determine the comparison value
between the i-th cluster and the j-th cluster
using the following equation:
𝑅
=
(5)
ICATECH 2023 - International Conference on Advanced Engineering and Technology
70
Notes: A good cluster is one that has the
smallest possible cohesion value and the
largest possible separation.
4. The ratio value obtained is used to find the
Davies-Bouldin index (DBI) value from the
following equation :
𝐷𝐵𝐼 =
∑
𝑅
,
(
6
)
k is the number of clusters used.
The smaller the DBI value (non-negative >=
0), the better the cluster obtained from the k-
means clustering.
3 METHOD RESEARCH
3.1
Water Quality Clustering
Research that performs water quality clustering is
used to analyze data with high complexity, especially
those caused by environmental changes around the
Haihe river water in China. To determine the water
quality value, several studies were conducted using a
fast clustering algorithm to identify and analyze the
quality of Haihe river water samples in China. The
results of the simulation-based research can perform
discriminative analysis and determine the most
significant indexes that can affect water quality (Zou,
Zou, & Wang, 2015).
Research on water quality grouping using the K-
Means method was conducted to evaluate the quality
of groundwater samples. The data was taken in the
hydrographic basin region: the northern part of the
Santo Domingo basin, the Baja California Peninsula
state in Mexico. Groundwater samples are used as a
dataset, which has several hydrogeochemical
variables used in this study. The K-Means method
and the spatial evaluation technique of the
Geographic Information System (GIS) were used to
identify the hydrogeochemical classes. The classes
are illustrated into clusters. The first cluster is shallow
wells and deep wells which are located close to the
beach area and the city. The second cluster is medium
and deep wells which are located adjacent to
industrial areas in the city and residential areas. The
third cluster is deeper wells which are located mainly
close to agricultural areas and cities(Celestino, Cruz,
Sánchez, Reyes, & Soto, 2018).
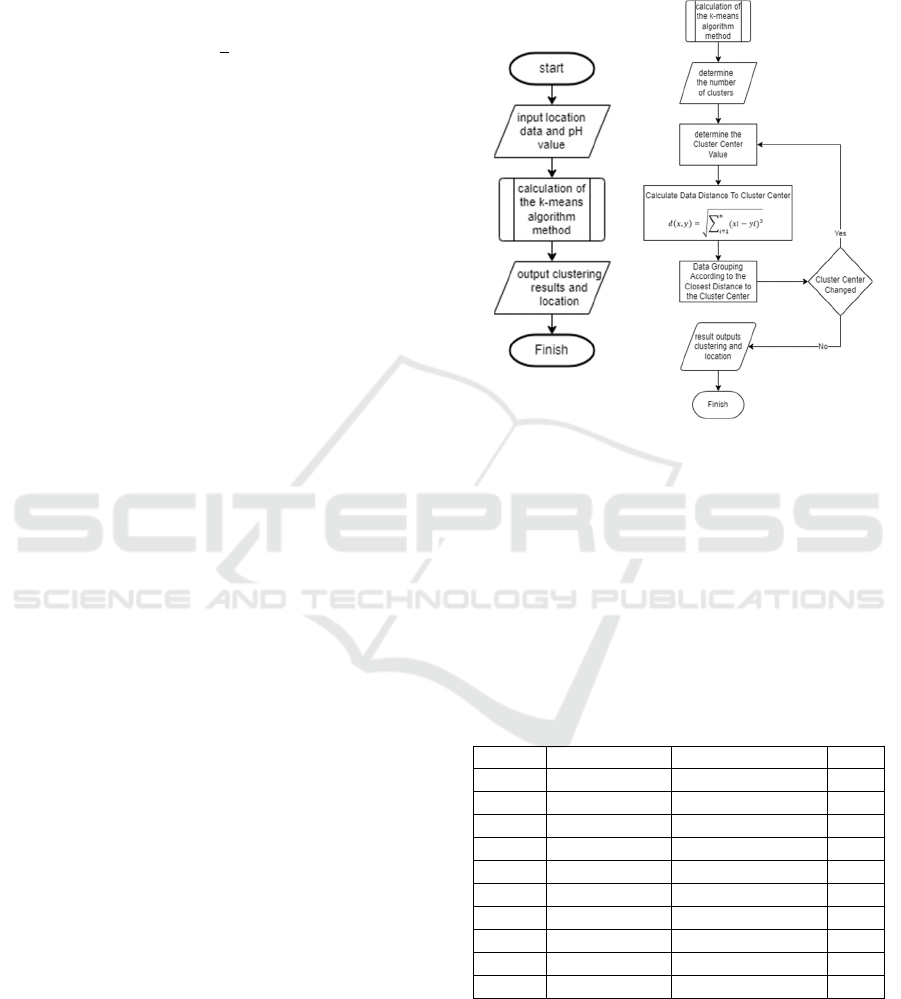
3.2 Flowchart System
Firstly, the system receives input of location point
Latitude and Longtitude values along with water pH
value data. Furthermore, the system performs
calculations using the K-Means algorithm, and the
final result is the result of water quality grouping
based on pH value. Flowchart of the water quality
grouping system is shown in Figure 1 (a).
(a) (b)
Figure 1: (a) Flowchart of water quality group of mapping
system, (b) K-Means Sub Process Flowchart.
3.3 Calculation of K-Means Algorithm
To calculate the Clustering method using the K-
Means flowchart algorithm can be seen in Figure 1
(b). K-Means algorithm calculation data uses
Latitude and Longtitude values along with water pH
values. These data can be seen in table 1.
Table 1: Latitude and Longitude
Station Latitude Lon
g
ititude
p
H
1
-7.19844335
112.6650415899 6.8
2
-7.1983343 112.6651770014
7.8
3
-7.19818011 112.6653213017
7.0
4
-7.19803752 112.6647503840
6.8
5
-7.19797383 112.6648587989
7.8
6
-7.19789205 112.6649671478
7.0
7
-7.19764996 112.6644049217
6.8
8
-7.19757713 112.6645404651
7.7
9
-7.19751337 112.6646669875
7.2
10
-7.19714456 112.6641405158
6.8
They were determining the number of clusters and
initial initialization where the cluster center is done
randomly, in this calculation example using 3 clusters
(k = 3). The cluster center points are shown in table
2.
K-Means Algorithm Grouping for Visualizing Potential of Hydrogen (pH) Data in Kali Lamong River
71

Table 2: Initial Center Point of Each Cluster
Centroi
d
1 2 3
p
H 6.7 7.0 7.8
The final results of the K-Means algorithm
calculation using the data presented in table 1 and the
cluster membership used in table 2, the calculation is
done 4 times, so that the membership of each cluster
does not change or converge. The final result can be
seen in table 3.
Table 3: Calculation results on the 4th iteration
Station C1 C2 C3 Cluster
Nearest
Cluster
1
0.03 0.47 0.91 0.03
1
2
0.97 0.53 0.09 0.09
3
3
0.17 0.27 0.71 0.17
1
4
0.03 0.47 0.91 0.03
1
5
0.97 0.53 0.09 0.09
3
6
0.17 0.27 0.71 0.17
1
7
0.03 0.47 0.91 0.03
1
8
0.87 0.43 0.01 0.01
3
9
0.37 0.07 0.51 0.07
2
10
0.03 0.47 0.91 0.03
1
Based on the results obtained in table 3, the
membership of each cluster can be seen in table 4.
Table 4: Calculation result
Station pH Cluster
1
6.8
1
2
7.8
3
3
7.0
1
4
6.8
1
5
7.8
3
6
7.0
1
7
6.8
1
8
7.7
3
9
7.2
2
10
6.8
1
4 RESULT AND DISCUSSION
In this chapter, the accuracy of the Kali Lamong
water quality grouping system is tested based on the
pH value. The data used is the pH value of water with
117 station points scattered around the Lamong River
estuary. The location of the data collection is shown
in Figure 2.
Figure 2: Location of data collection in Kali Lamong Gresik
4.1 System Testing
System testing needs to determine the accuracy of the
results of the K-Means calculation. System testing is
k-means based on the number of clusters (k = 2,3,4).
Table 5: Results of Total Membership of Clusters 2,
3 and 4 Using K-Means Calculation.
Table 5: Results of Total Membership of Clusters 2,
3 and 4 Using K-Means Calculation
Cluster Total
23 4
C 12123 1 2 3 4
Total
mem
b
e
r
49 68 43 45 29 39 22 27 29
The results of the K-Means algorithm calculation in
table 5 above show that each cluster number 2, 3 and
4 has a different number of members. In this case, in
the K-Means calculation, K = 2, that cluster 1
members are 49 data and cluster 2 members are 68
data. In the K-Means calculation, K = 3, cluster 1
members are 43 data, cluster 2 members are 45 data,
and cluster 3 members are 29 data. In the calculation
of K-Means K = 4, cluster 1 members are 39 data,
cluster 2 members are 22 data, cluster 3 members are
27 data, and cluster 4 members are 29 data.
4.2 Cluster Analysis Using Davies
Bouldin Index (DBI)
The DBI calculation stage aims to determine the
number of clusters that produce the best K value. An
example of calculation with 2 clusters (K = 2), first
calculating the Sum of square within cluster (SSW)
using equation (3) produces the following values:
SSW1=0.10 and SSW2=0.20. Furthermore,
calculating the Sum of square between clusters (SSB)
using equation (4) produces the following values:
SSB1,2=0.61. Furthermore, calculating the R ratio
ICATECH 2023 - International Conference on Advanced Engineering and Technology
72
measurement of cluster 2 using equation (5) results in
R_1,2=0.49. Finally, calculating the DBI value using
equation (6) results in: DBI=0.49. The results of the
DBI calculation for clusters 2, 3 and 4 (K = 2, 3, or 4)
can be seen in table 6, respectively.
Table 6. DBI value K = 2,3,4
K 2 3 4
DBI 0.49 0.36 0.47
Based on table 6, the smallest Davies-Bouldin Index
value is 0.36 at K = 3, so the best number of clusters
in this experiment is three.
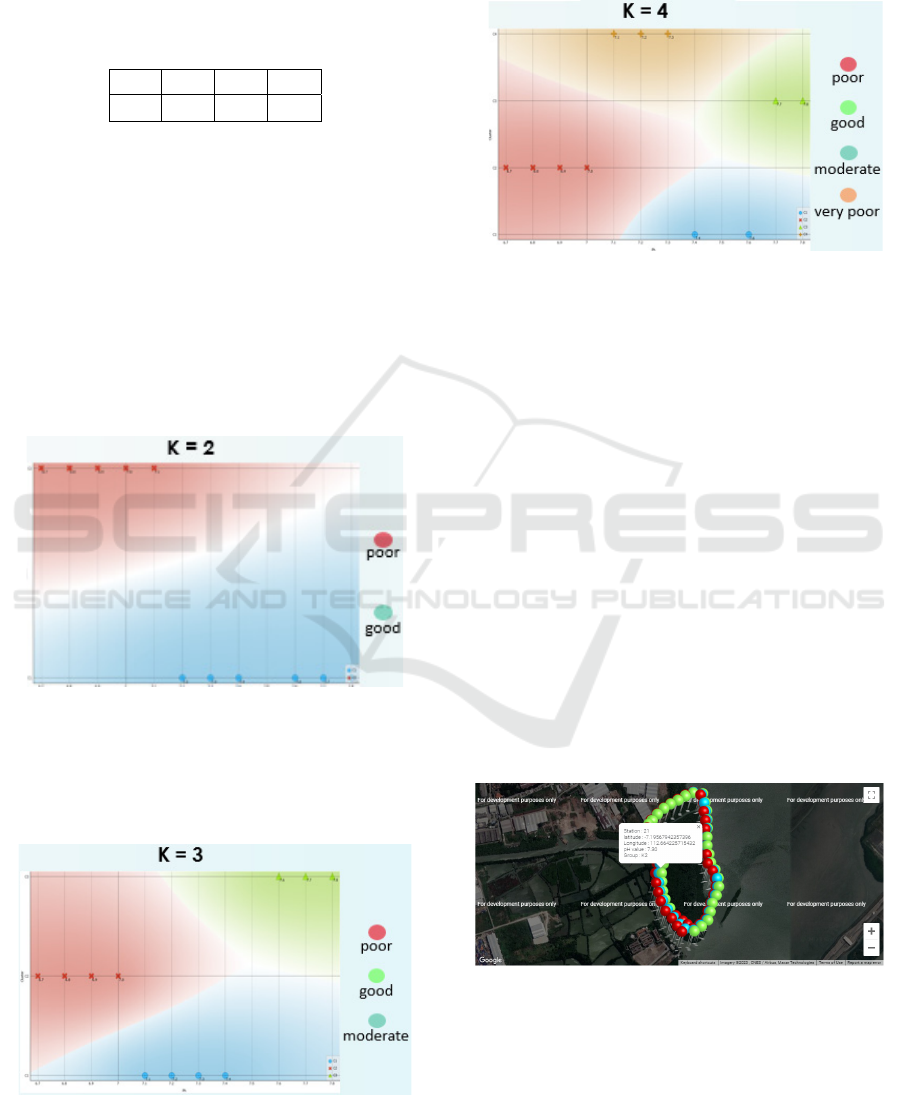
4.3 Visualization of Cluster Results
Using Orange Data Mining
To make it easier to analyze the results of the K-
Means algorithm calculation, the Orange Data
Mining application is used. This application will
display visualizations in the form of scatter plots for
the number of K = 2, 3, and also 4.
Figure 3: Cluster implementation results to the orange data
mining application with K = 2.
Figure 3 shows the number of clusters K = 2, where
the first cluster has 49 stations (red color) and the
second cluster has 49 stations (blue color).
Figure 4: Cluster implementation results to the orange data
mining application with K = 3.
Figure 4 displays the number of Cluster K = 3, where
the first cluster is 45 stations (red color), the second
cluster is 43 stations (blue color), and the third cluster
is 29 stations (green color).
Figure 5: Cluster implementation results to the orange data
mining application with K = 3.
Figure 5 displays the number of Cluster K = 4, where
the first cluster is 19 stations (green color), the second
cluster is 21 stations (blue color), and the third cluster
is 34 stations (brown color), and the fourth cluster is
43 stations (red color).
4.4 Web-Based Implementation
The quality classification system of Kali Lamong is
website-based (Khadafi, Salim, Prabowo, & Choirul,
2019). This website application was developed using
the PHP programming language, JavaScript was
created using the CodeIgniter framework, for
marking location points it was created using the
Google Maps API which is a library developed using
the JavaScript programming language, while google
maps is a popular digital map which is often
developed for applications based on website to
display information on a location (Khadafi, 2016).
Figure 6: Implementation Results to website-based
applications
In Figure 6, the cluster result grouping system is a
display after processing the K-Means method and has
obtained a group on each water quality data
respectively, in the image below there are three icons
K-Means Algorithm Grouping for Visualizing Potential of Hydrogen (pH) Data in Kali Lamong River
73

with different colors and each color difference has a
different meaning where the red icon is intended for
group 1 with poor conditions totaling 43 stations,
green for group 2 with good conditions totaling 45
stations and blue for group 3 with moderate
conditions totaling 29 stations, on the icon if clicked
will display information in the form of station
number, lat long, pH value and also group number.
4.5 Implementation Using Surfer
Application
To find out the distribution of water pH values using
the Surfer application program can be seen in Figure
7 below.
Figure 7: Results Implementation to the Surfer application
The display of the implementation results in the
Surfer application can be explained by the
distribution of pH values where variable X is
Longitude, variable Y is Latitude and variable Z is the
pH value of water. Red color information indicates
that the pH value is high or the pH is alkaline, the
lower the light green pH is neutral and the lower or
blue to purple the pH value is low or the pH is acidic.
From the description of Figure 5, it can also be seen
that the highest pH value is 7.8 and the lowest is 6.1.
5 CONCLUSION
1. By using the K-Means algorithm, it can
categorize water quality with good and bad
conditions.
2. Based on the results, it can be concluded that
the best number of clusters produced using
the k-means algorithm method is three
clusters (k = 3) with the smallest Davies-
Bouldin Index validity value of 0.36. Where
the three clusters are each membership,
namely, the first cluster of 43 stations, the
second cluster of 45 stations and the third
cluster of 29 stations. In addition, it produces
4 iterations, with a description of C1 with
poor conditions, C2 with good conditions
and C3 with moderate conditions.
3. The use of Google Maps API and Code
Igniter Framework can display visualization
of clustering results well in accordance with
the dataset used, namely the pH water
quality values in Lamong River.
REFERENCES
Ainun Novia, E. (2020). SISTEM PERBANDINGAN
ALGORITMA K-MEANS DAN NAÏVE BAYES
UNTUK MEMPREDIKSI PRI... - Google Books.
Aswant, I. AL. (2016). Analisis Perbandingan Metode
Interpolasi untuk Pemetaan pH Air Pada Sumur Bor di
Kabupaten Aceh Besar Berbasis SIG. UPT
Perpustakaan Universitas Syiah Kuala, 1–76.
Badruttamam, A., Sudarno, S., & Maruddani, D. A. I.
(2020). PENERAPAN ANALISIS KLASTER K-
MODES DENGAN VALIDASI DAVIES BOULDIN
INDEX DALAM MENENTUKAN
KARAKTERISTIK KANAL YOUTUBE DI
INDONESIA (Studi Kasus: 250 Kanal YouTube
Indonesia Teratas Menurut Socialblade). Jurnal
Gaussian, 9(3), 263–272.
https://doi.org/10.14710/j.gauss.v9i3.28907
Celestino, A. E. M., Cruz, D. A. M., Sánchez, E. M. O.,
Reyes, F. G., & Soto, D. V. (2018). Groundwater
quality assessment: An improved approach to K-means
clustering, principal component analysis and spatial
analysis: A case study. Water (Switzerland), 10(4), 1–
21. https://doi.org/10.3390/w10040437
Hani Subakti, S. P. M. P., Ikhsan Romli, S. S. M. S., Nur
Syamsiyah, S. T. M. T. I., Adam Arif Budiman, M. K.,
Herianto, S. P. M. T., Lulut Alfaris, S. T. M. T., …
others. (2022). Artificial Intelligence. Media Sains
Indonesia.
Khadafi, S. (2016). Implementasi Algoritma Pso Untuk
Probabilitas Urutan Pengiriman Paket Pengantaran
Kurir. Seminar Nasional Sains Dan Teknologi Terapan
IV 2016 Institut Teknologi Adhi Tama Surabaya, 93–
98.
Khadafi, S., Salim, A., Prabowo, R., & Choirul, A. (2019).
Rancang Bangun Website UKM Reviora Tanggulangin
Sidoarjo Menggunakan Metode Waterfall Sebagai
Media Pemasaran Online. Seminar Nasional Sains Dan
Teknologi Terapan VII 2019, 705–710.
Luki Nasiti, E., Rahayu, Y., & Indah, N. (2017). Kualitas
Perairan Kali Lamong Berdasarkan Keanekaragaman
Plankton. LenteraBio: Berkala Ilmiah Biologi, 6(3).
Ni’am, A. C., Aulady, M. F. N., Hamidah, N. L., &
Prasetya, K. D. (2022). Analysis of distribution
ICATECH 2023 - International Conference on Advanced Engineering and Technology
74

dissolved oxygen concentration in Kali Lamong river
estuary, Surabaya during pandemic Covid-19. AIP
Conference Proceedings, 2534(1), 30006.
https://doi.org/10.1063/5.0106238
Ni’Am, A. C., Prasetya, K. D., & Utami, R. P. (2021).
Analysis of Ammonia in Kali Lamong River Estuary
Surabaya during Pandemic Covid-19. Journal of
Physics: Conference Series, 2117(1).
https://doi.org/10.1088/1742-6596/2117/1/012020
Supriatna, M. (2020). Hubungan pH dengan Parameter
Kualitas Air pada Tambak Intensif Udang Vannamei
(Litopenaeus vannamei). JFMR-Journal of Fisheries
and Marine Research, 4(3), 368–374.
Wahyudi, M. (2020). Data Mining: Penerapan Algoritma
K-Means Clustering dan K-Medoids Clusterin... -
Google Books.
Zou, H., Zou, Z., & Wang, X. (2015). An enhanced K-
Means algorithm for water quality analysis of the haihe
river in China. International Journal of Environmental
Research and Public Health, 12(11), 14400–14413.
https://doi.org/10.3390/ijerph121114400
K-Means Algorithm Grouping for Visualizing Potential of Hydrogen (pH) Data in Kali Lamong River
75
